Polusi udara di Downtown: indeks kualitas udara real-time dan siaga asap.
Perkiraan kualitas polusi dan udara untuk Downtown. Hari ini Rabu, 17 Juni 2026. Nilai polusi udara berikut telah tercatat untuk Downtown:- nitrogen dioksida (NO2) - 48 (Moderat)
- ozon (O3) - 115 (Moderat)
- partikulat Matter (PM10) debu tersuspensi - 22 (Moderat)
- partikulat Matter (PM 2.5) debu - 3 (Bagus)
- karbon monoksida (CO) - 360 (Bagus)
- sulfur dioksida (SO2) - 5 (Bagus)

Apa kualitas udara di Downtown hari ini? Apakah udara tercemar di Downtown?. Apakah ada Smog?
Seberapa tinggi tingkat NO2? (nitrogen dioksida (NO2))
48 (Moderat)
Bagaimana tingkat O3 hari ini di Downtown? (ozon (O3))
115 (Moderat)
Apa tingkat PM10 hari ini di Downtown? (partikulat Matter (PM10) debu tersuspensi)
Level saat ini dari partikulat Matter PM10 di Downtown adalah:
22 (Moderat)
Apa tingkat saat PM 2,5 in Downtown? (partikulat Matter (PM 2.5) debu)
Hari ini PM 2.5 tingkat:
3 (Bagus)
Sebagai perbandingan, tingkat tertinggi PM 2,5 in Downtown dalam 7 hari terakhir adalah: 4 (Jumat, 27 Mei 2022) dan Terendah: 4 (Jumat, 27 Mei 2022).
Nilai tertinggi PM 2.5 direkam: 35 (Agustus 2018).
Tingkat terendah dari partikulat Matter PM 2.5 polusi terjadi di bulan: Mei (2.1).
Seberapa tinggi tingkat CO? (karbon monoksida (CO))
360 (Bagus)
Apa tingkat polusi SO2? (sulfur dioksida (SO2))
5 (Bagus)
Data saat ini Jumat, 27 Mei 2022 15.00
NO2 48 (Moderat)
O3 115 (Moderat)
PM10 22 (Moderat)
PM2,5 3 (Bagus)
CO 360 (Bagus)
SO2 5 (Bagus)
Data tentang polusi udara dari beberapa hari terakhir di Downtown
index
2022-05-27
no2
10
Good
o3
98
Moderate
pm10
14
Good
pm25
4
Good
co
249
Good
so2
2
Good
data source »
Polusi udara di Downtown dari Maret 2016 ke Mei 2020

index
2020-05
2020-04
2020-03
2020-02
2020-01
2019-12
2019-11
2019-10
2019-09
2019-08
2019-07
2019-06
2019-05
2019-04
2019-03
2019-02
2019-01
2018-12
2018-11
2018-10
2018-09
2018-08
2018-07
2018-06
2018-05
2018-04
2018-03
2018-02
2018-01
2017-12
2017-11
2017-10
2017-09
2017-08
2017-07
2017-06
2017-05
2017-04
2016-09
2016-08
2016-04
2016-03
no2:ppm
0.01 (Good)
0.01 (Good)
0.02 (Good)
0.02 (Good)
0.03 (Good)
0.02 (Good)
0.02 (Good)
0.01 (Good)
0.01 (Good)
0.01 (Good)
0.01 (Good)
0.01 (Good)
0.01 (Good)
0.01 (Good)
0.02 (Good)
0.03 (Good)
0.02 (Good)
0.02 (Good)
0.02 (Good)
0.01 (Good)
0.01 (Good)
0.01 (Good)
0.01 (Good)
0.01 (Good)
0.01 (Good)
0.02 (Good)
0.02 (Good)
0.02 (Good)
0.02 (Good)
0.02 (Good)
0.02 (Good)
0.02 (Good)
0.01 (Good)
0.01 (Good)
0.01 (Good)
0.01 (Good)
0.01 (Good)
0.01 (Good)
0.01 (Good)
0.01 (Good)
0.01 (Good)
0.02 (Good)
o3:ppm
0.03 (Good)
0.03 (Good)
0.03 (Good)
0.02 (Good)
0.01 (Good)
0.01 (Good)
0.01 (Good)
0.02 (Good)
0.02 (Good)
0.02 (Good)
0.02 (Good)
0.03 (Good)
0.04 (Good)
0.04 (Good)
0.03 (Good)
0.02 (Good)
0.02 (Good)
0.01 (Good)
0.01 (Good)
0.02 (Good)
0.01 (Good)
0.02 (Good)
0.03 (Good)
0.03 (Good)
0.04 (Good)
0.04 (Good)
0.03 (Good)
0.02 (Good)
0.01 (Good)
0.02 (Good)
0.01 (Good)
0.02 (Good)
0.02 (Good)
0.02 (Good)
0.03 (Good)
0.03 (Good)
0.03 (Good)
0.02 (Good)
0.01 (Good)
0.02 (Good)
0.03 (Good)
0.02 (Good)
pm25
2.1 (Good)
3 (Good)
3.9 (Good)
4.4 (Good)
7.7 (Good)
6.9 (Good)
3.9 (Good)
2.7 (Good)
2.8 (Good)
3.5 (Good)
4.8 (Good)
8.8 (Good)
8.9 (Good)
4.1 (Good)
8.8 (Good)
9.4 (Good)
6.4 (Good)
7.2 (Good)
7.6 (Good)
6.7 (Good)
4.9 (Good)
35 (Unhealthy for Sensitive Groups)
9.3 (Good)
5.4 (Good)
6.4 (Good)
6.7 (Good)
11 (Good)
4.6 (Good)
8.6 (Good)
5.3 (Good)
10 (Good)
4.3 (Good)
8.3 (Good)
12 (Good)
14 (Moderate)
6.1 (Good)
6.2 (Good)
5.8 (Good)
4.6 (Good)
5.9 (Good)
6.1 (Good)
7.4 (Good)
co:ppm
- (Good)
- (Good)
- (Good)
- (Good)
- (Good)
0.34 (Good)
0.39 (Good)
0.27 (Good)
0.24 (Good)
0.19 (Good)
0.28 (Good)
0.29 (Good)
0.33 (Good)
0.39 (Good)
0.43 (Good)
0.43 (Good)
0.2 (Good)
0.29 (Good)
0.37 (Good)
0.27 (Good)
0.24 (Good)
0.46 (Good)
0.28 (Good)
0.26 (Good)
0.3 (Good)
0.3 (Good)
0.43 (Good)
0.41 (Good)
0.33 (Good)
0.31 (Good)
0.46 (Good)
0.28 (Good)
0.32 (Good)
0.3 (Good)
0.33 (Good)
0.3 (Good)
0.28 (Good)
0.48 (Good)
0.19 (Good)
0.26 (Good)
0.33 (Good)
0.35 (Good)
data source »
Kualitas hidup di Downtown
Hijau dan taman di kota
Downtown
85%
Amerika Serikat: 70%
Venezuela: 41%
Islandia: 72%
partikulat Matter PM 2.5
Downtown
9 (Good)
Kenikmatan menghabiskan waktu di kota
Downtown
81%
Amerika Serikat: 75%
Bahama: 53%
Venezuela: 41%
Islandia: 89%
partikulat Matter PM10
Downtown
16 (Good)
Polusi udara
Downtown
28%
Amerika Serikat: 29%
Bahama: 52%
Venezuela: 59%
Islandia: 13%
Pembuangan sampah
Downtown
84%
Amerika Serikat: 71%
Bahama: 29%
Venezuela: 18%
Islandia: 79%
Ketersediaan dan kualitas air minum
Downtown
86%
Amerika Serikat: 71%
Bahama: 55%
Venezuela: 28%
Islandia: 96%
Kebersihan dan kerasnya
Downtown
68%
Amerika Serikat: 60%
Bahama: 35%
Venezuela: 22%
Islandia: 75%
Kebisingan dan polusi cahaya
Downtown
43%
Amerika Serikat: 47%
Bahama: 39%
Venezuela: 47%
Islandia: 23%
Polusi air
Downtown
28%
Amerika Serikat: 44%
Bahama: 58%
Venezuela: 76%
Islandia: 8,4%
Source: Numbeo
Edmonton Central
Jumat, 27 Mei 2022 15.00
NO2 48 (Moderat)
nitrogen dioksida (NO2)
O3 115 (Moderat)
ozon (O3)
PM10 22 (Moderat)
partikulat Matter (PM10) debu tersuspensi
PM2,5 2.5 (Bagus)
partikulat Matter (PM 2.5) debu
CO 360 (Bagus)
karbon monoksida (CO)
SO2 5 (Bagus)
sulfur dioksida (SO2)
Edmonton Central
index
2022-05-27
no2
10
o3
98
pm10
14
pm25
4.1
co
249
so2
2.1
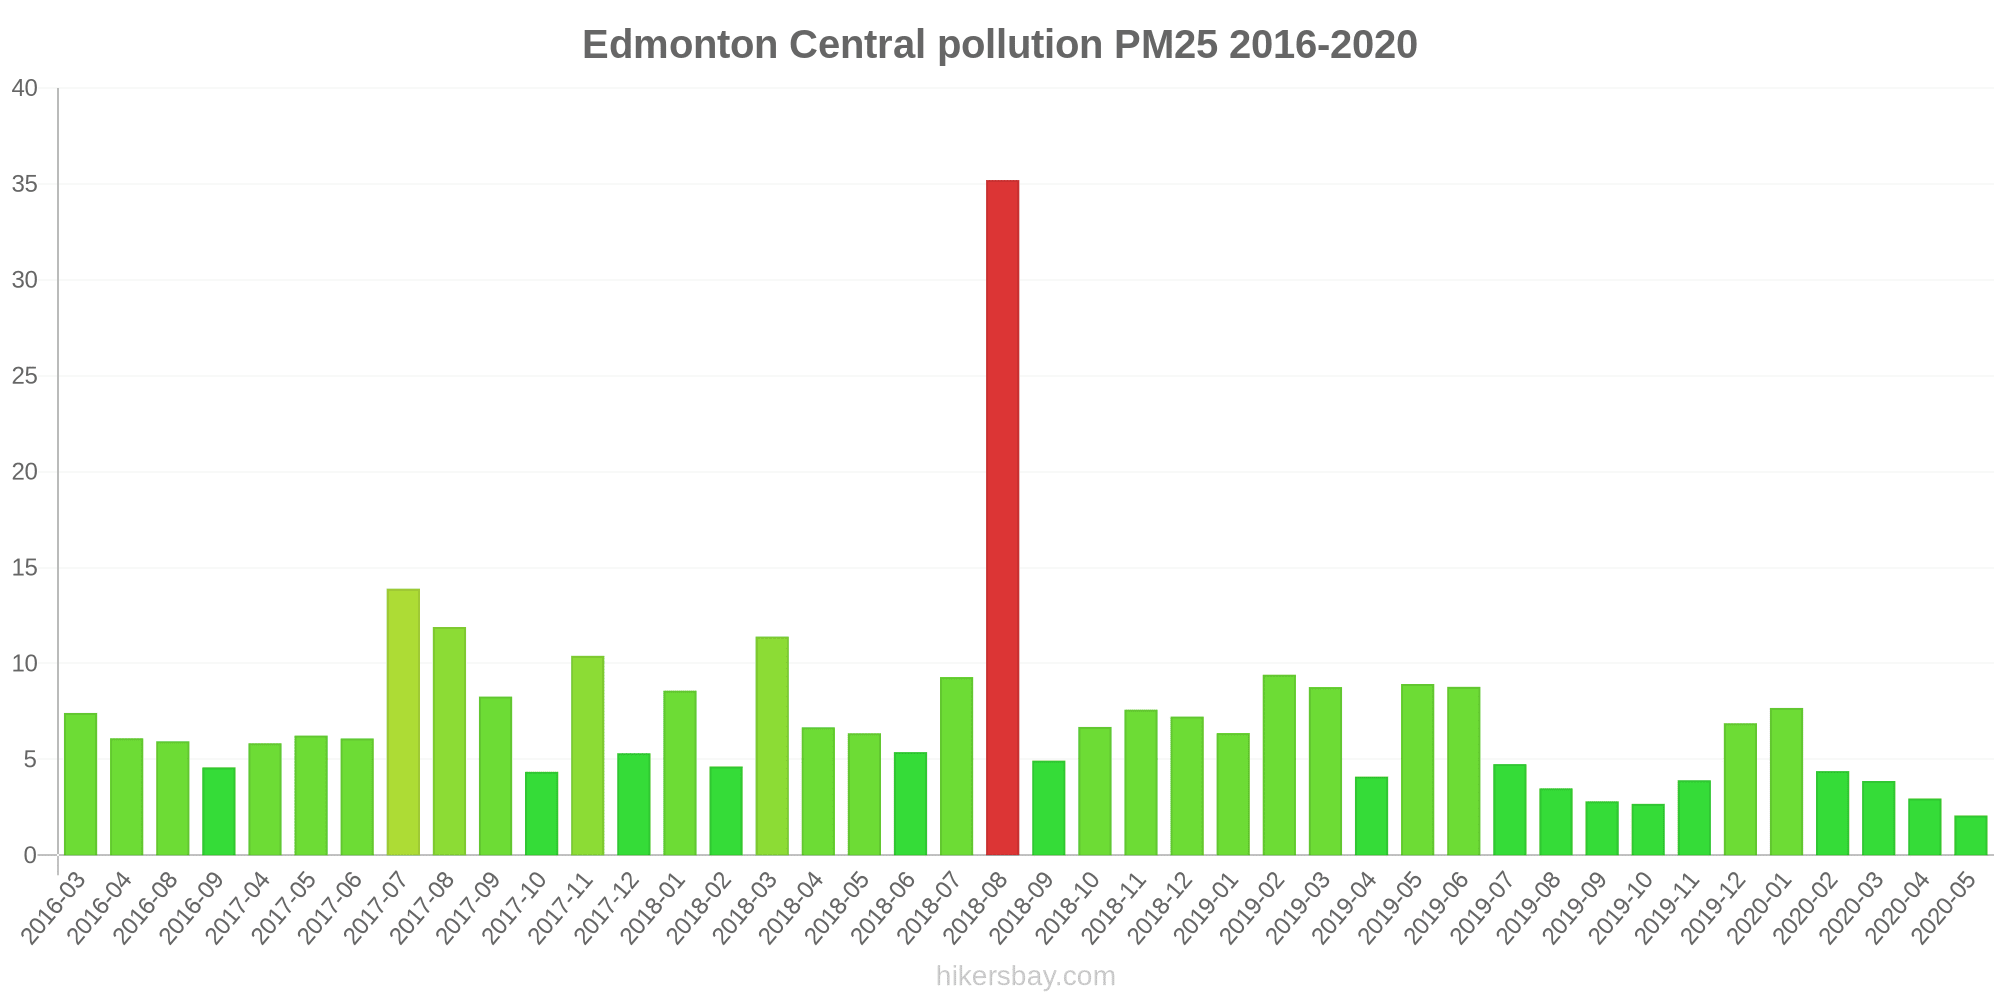
Edmonton Central
2016-03 2020-05

index
2020-05
2020-04
2020-03
2020-02
2020-01
2019-12
2019-11
2019-10
2019-09
2019-08
2019-07
2019-06
2019-05
2019-04
2019-03
2019-02
2019-01
2018-12
2018-11
2018-10
2018-09
2018-08
2018-07
2018-06
2018-05
2018-04
2018-03
2018-02
2018-01
2017-12
2017-11
2017-10
2017-09
2017-08
2017-07
2017-06
2017-05
2017-04
2016-09
2016-08
2016-04
2016-03
pm25
2.1
3
3.9
4.4
7.7
6.9
3.9
2.7
2.8
3.5
4.8
8.8
8.9
4.1
8.8
9.4
6.4
7.2
7.6
6.7
4.9
35
9.3
5.4
6.4
6.7
11
4.6
8.6
5.3
10
4.3
8.3
12
14
6.1
6.2
5.8
4.6
5.9
6.1
7.4
no2:ppm
0.01
0.01
0.02
0.02
0.03
0.02
0.02
0.01
0.01
0.01
0.01
0.01
0.01
0.01
0.02
0.03
0.02
0.02
0.02
0.01
0.01
0.01
0.01
0.01
0.01
0.02
0.02
0.02
0.02
0.02
0.02
0.02
0.01
0.01
0.01
0.01
0.01
0.01
0.01
0.01
0.01
0.02
co:ppm
-
-
-
-
-
0.34
0.39
0.27
0.24
0.19
0.28
0.29
0.33
0.39
0.43
0.43
0.2
0.29
0.37
0.27
0.24
0.46
0.28
0.26
0.3
0.3
0.43
0.41
0.33
0.31
0.46
0.28
0.32
0.3
0.33
0.3
0.28
0.48
0.19
0.26
0.33
0.35
o3:ppm
0.03
0.03
0.03
0.02
0.01
0.01
0.01
0.02
0.02
0.02
0.02
0.03
0.04
0.04
0.03
0.02
0.02
0.01
0.01
0.02
0.01
0.02
0.03
0.03
0.04
0.04
0.03
0.02
0.01
0.02
0.01
0.02
0.02
0.02
0.03
0.03
0.03
0.02
0.01
0.02
0.03
0.02
* Pollution data source:
https://openaq.org
(AirNow)
The data is licensed under CC-By 4.0
NO2 48 (Moderat)
O3 115 (Moderat)
PM10 22 (Moderat)
PM2,5 3 (Bagus)
CO 360 (Bagus)
SO2 5 (Bagus)
Data tentang polusi udara dari beberapa hari terakhir di Downtown
| index | 2022-05-27 |
|---|---|
| no2 | 10 Good |
| o3 | 98 Moderate |
| pm10 | 14 Good |
| pm25 | 4 Good |
| co | 249 Good |
| so2 | 2 Good |
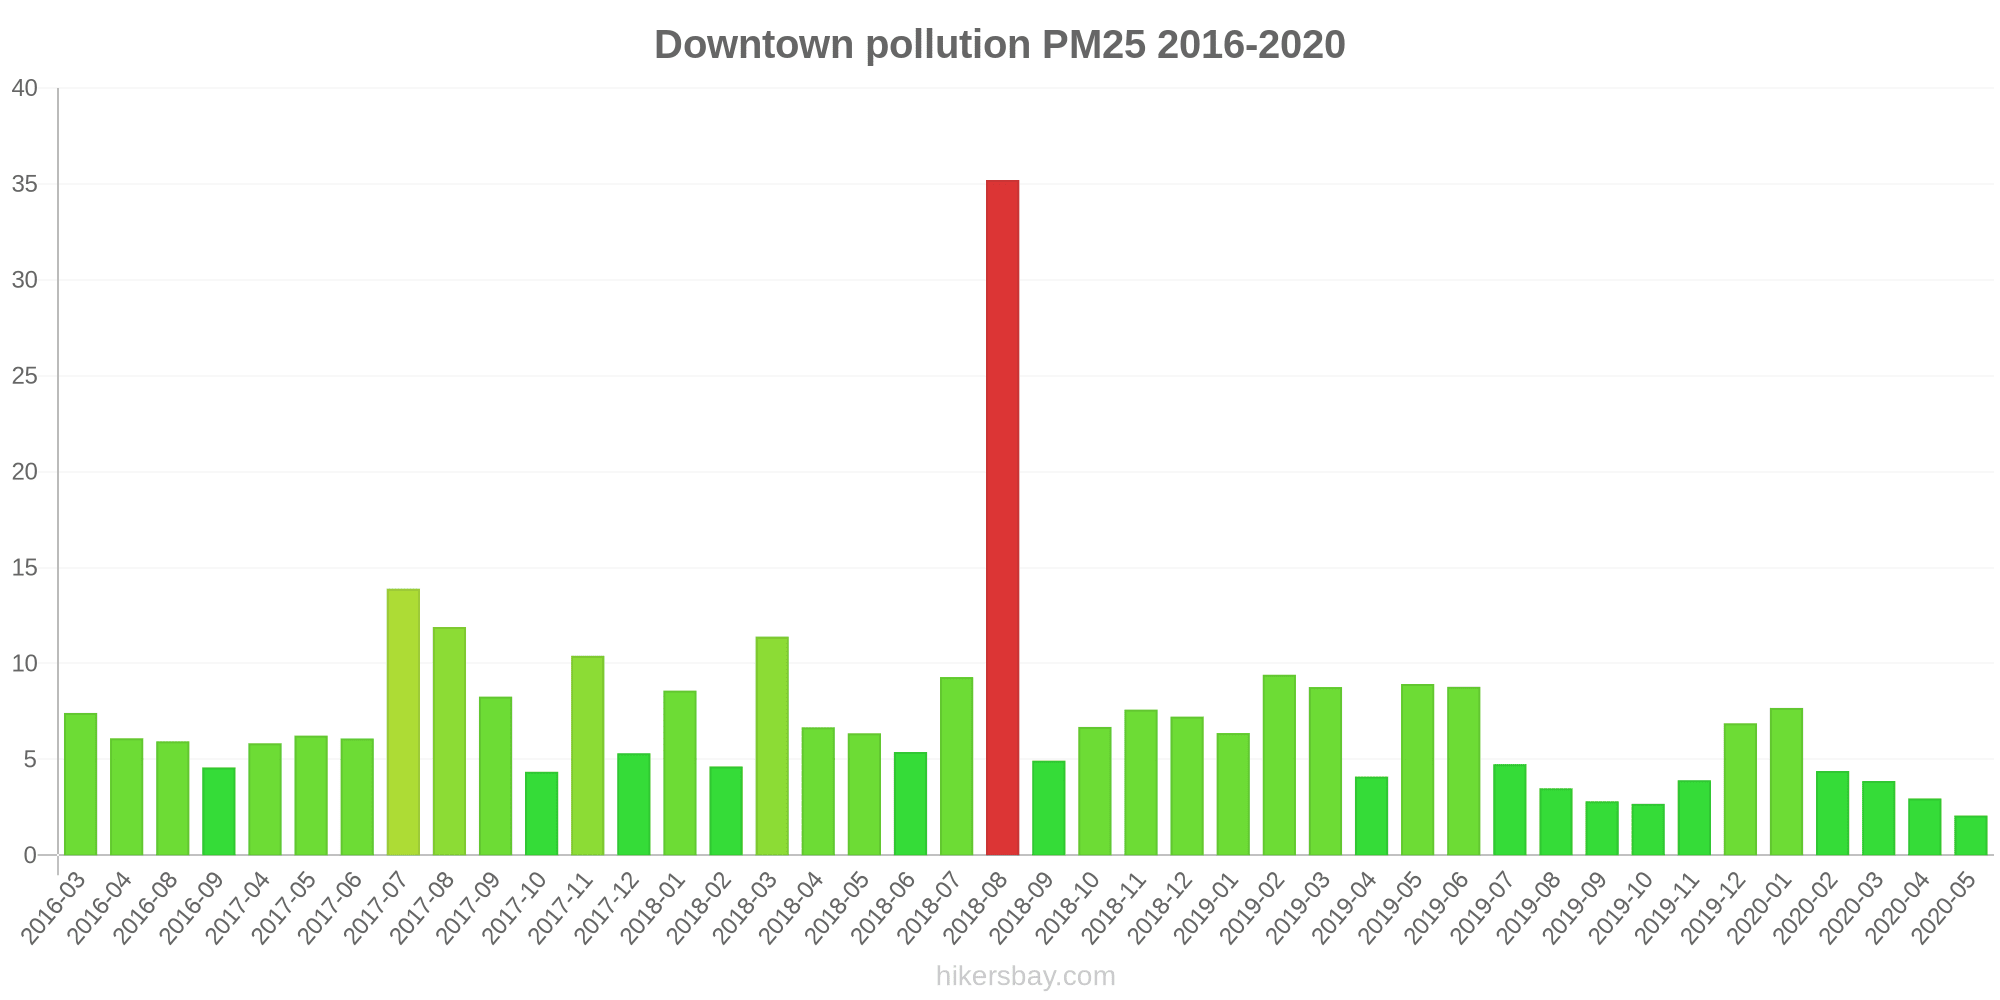
| index | 2020-05 | 2020-04 | 2020-03 | 2020-02 | 2020-01 | 2019-12 | 2019-11 | 2019-10 | 2019-09 | 2019-08 | 2019-07 | 2019-06 | 2019-05 | 2019-04 | 2019-03 | 2019-02 | 2019-01 | 2018-12 | 2018-11 | 2018-10 | 2018-09 | 2018-08 | 2018-07 | 2018-06 | 2018-05 | 2018-04 | 2018-03 | 2018-02 | 2018-01 | 2017-12 | 2017-11 | 2017-10 | 2017-09 | 2017-08 | 2017-07 | 2017-06 | 2017-05 | 2017-04 | 2016-09 | 2016-08 | 2016-04 | 2016-03 |
|---|---|---|---|---|---|---|---|---|---|---|---|---|---|---|---|---|---|---|---|---|---|---|---|---|---|---|---|---|---|---|---|---|---|---|---|---|---|---|---|---|---|---|
| no2:ppm | 0.01 (Good) | 0.01 (Good) | 0.02 (Good) | 0.02 (Good) | 0.03 (Good) | 0.02 (Good) | 0.02 (Good) | 0.01 (Good) | 0.01 (Good) | 0.01 (Good) | 0.01 (Good) | 0.01 (Good) | 0.01 (Good) | 0.01 (Good) | 0.02 (Good) | 0.03 (Good) | 0.02 (Good) | 0.02 (Good) | 0.02 (Good) | 0.01 (Good) | 0.01 (Good) | 0.01 (Good) | 0.01 (Good) | 0.01 (Good) | 0.01 (Good) | 0.02 (Good) | 0.02 (Good) | 0.02 (Good) | 0.02 (Good) | 0.02 (Good) | 0.02 (Good) | 0.02 (Good) | 0.01 (Good) | 0.01 (Good) | 0.01 (Good) | 0.01 (Good) | 0.01 (Good) | 0.01 (Good) | 0.01 (Good) | 0.01 (Good) | 0.01 (Good) | 0.02 (Good) |
| o3:ppm | 0.03 (Good) | 0.03 (Good) | 0.03 (Good) | 0.02 (Good) | 0.01 (Good) | 0.01 (Good) | 0.01 (Good) | 0.02 (Good) | 0.02 (Good) | 0.02 (Good) | 0.02 (Good) | 0.03 (Good) | 0.04 (Good) | 0.04 (Good) | 0.03 (Good) | 0.02 (Good) | 0.02 (Good) | 0.01 (Good) | 0.01 (Good) | 0.02 (Good) | 0.01 (Good) | 0.02 (Good) | 0.03 (Good) | 0.03 (Good) | 0.04 (Good) | 0.04 (Good) | 0.03 (Good) | 0.02 (Good) | 0.01 (Good) | 0.02 (Good) | 0.01 (Good) | 0.02 (Good) | 0.02 (Good) | 0.02 (Good) | 0.03 (Good) | 0.03 (Good) | 0.03 (Good) | 0.02 (Good) | 0.01 (Good) | 0.02 (Good) | 0.03 (Good) | 0.02 (Good) |
| pm25 | 2.1 (Good) | 3 (Good) | 3.9 (Good) | 4.4 (Good) | 7.7 (Good) | 6.9 (Good) | 3.9 (Good) | 2.7 (Good) | 2.8 (Good) | 3.5 (Good) | 4.8 (Good) | 8.8 (Good) | 8.9 (Good) | 4.1 (Good) | 8.8 (Good) | 9.4 (Good) | 6.4 (Good) | 7.2 (Good) | 7.6 (Good) | 6.7 (Good) | 4.9 (Good) | 35 (Unhealthy for Sensitive Groups) | 9.3 (Good) | 5.4 (Good) | 6.4 (Good) | 6.7 (Good) | 11 (Good) | 4.6 (Good) | 8.6 (Good) | 5.3 (Good) | 10 (Good) | 4.3 (Good) | 8.3 (Good) | 12 (Good) | 14 (Moderate) | 6.1 (Good) | 6.2 (Good) | 5.8 (Good) | 4.6 (Good) | 5.9 (Good) | 6.1 (Good) | 7.4 (Good) |
| co:ppm | - (Good) | - (Good) | - (Good) | - (Good) | - (Good) | 0.34 (Good) | 0.39 (Good) | 0.27 (Good) | 0.24 (Good) | 0.19 (Good) | 0.28 (Good) | 0.29 (Good) | 0.33 (Good) | 0.39 (Good) | 0.43 (Good) | 0.43 (Good) | 0.2 (Good) | 0.29 (Good) | 0.37 (Good) | 0.27 (Good) | 0.24 (Good) | 0.46 (Good) | 0.28 (Good) | 0.26 (Good) | 0.3 (Good) | 0.3 (Good) | 0.43 (Good) | 0.41 (Good) | 0.33 (Good) | 0.31 (Good) | 0.46 (Good) | 0.28 (Good) | 0.32 (Good) | 0.3 (Good) | 0.33 (Good) | 0.3 (Good) | 0.28 (Good) | 0.48 (Good) | 0.19 (Good) | 0.26 (Good) | 0.33 (Good) | 0.35 (Good) |
Hijau dan taman di kota
Downtown 85%
Amerika Serikat: 70% Venezuela: 41% Islandia: 72%partikulat Matter PM 2.5
Downtown 9 (Good)
Kenikmatan menghabiskan waktu di kota
Downtown 81%
Amerika Serikat: 75% Bahama: 53% Venezuela: 41% Islandia: 89%partikulat Matter PM10
Downtown 16 (Good)
Polusi udara
Downtown 28%
Amerika Serikat: 29% Bahama: 52% Venezuela: 59% Islandia: 13%Pembuangan sampah
Downtown 84%
Amerika Serikat: 71% Bahama: 29% Venezuela: 18% Islandia: 79%Ketersediaan dan kualitas air minum
Downtown 86%
Amerika Serikat: 71% Bahama: 55% Venezuela: 28% Islandia: 96%Kebersihan dan kerasnya
Downtown 68%
Amerika Serikat: 60% Bahama: 35% Venezuela: 22% Islandia: 75%Kebisingan dan polusi cahaya
Downtown 43%
Amerika Serikat: 47% Bahama: 39% Venezuela: 47% Islandia: 23%Polusi air
Downtown 28%
Amerika Serikat: 44% Bahama: 58% Venezuela: 76% Islandia: 8,4%NO2 48 (Moderat)
nitrogen dioksida (NO2)O3 115 (Moderat)
ozon (O3)PM10 22 (Moderat)
partikulat Matter (PM10) debu tersuspensiPM2,5 2.5 (Bagus)
partikulat Matter (PM 2.5) debuCO 360 (Bagus)
karbon monoksida (CO)SO2 5 (Bagus)
sulfur dioksida (SO2)Edmonton Central
| index | 2022-05-27 |
|---|---|
| no2 | 10 |
| o3 | 98 |
| pm10 | 14 |
| pm25 | 4.1 |
| co | 249 |
| so2 | 2.1 |
Edmonton Central
| index | 2020-05 | 2020-04 | 2020-03 | 2020-02 | 2020-01 | 2019-12 | 2019-11 | 2019-10 | 2019-09 | 2019-08 | 2019-07 | 2019-06 | 2019-05 | 2019-04 | 2019-03 | 2019-02 | 2019-01 | 2018-12 | 2018-11 | 2018-10 | 2018-09 | 2018-08 | 2018-07 | 2018-06 | 2018-05 | 2018-04 | 2018-03 | 2018-02 | 2018-01 | 2017-12 | 2017-11 | 2017-10 | 2017-09 | 2017-08 | 2017-07 | 2017-06 | 2017-05 | 2017-04 | 2016-09 | 2016-08 | 2016-04 | 2016-03 |
|---|---|---|---|---|---|---|---|---|---|---|---|---|---|---|---|---|---|---|---|---|---|---|---|---|---|---|---|---|---|---|---|---|---|---|---|---|---|---|---|---|---|---|
| pm25 | 2.1 | 3 | 3.9 | 4.4 | 7.7 | 6.9 | 3.9 | 2.7 | 2.8 | 3.5 | 4.8 | 8.8 | 8.9 | 4.1 | 8.8 | 9.4 | 6.4 | 7.2 | 7.6 | 6.7 | 4.9 | 35 | 9.3 | 5.4 | 6.4 | 6.7 | 11 | 4.6 | 8.6 | 5.3 | 10 | 4.3 | 8.3 | 12 | 14 | 6.1 | 6.2 | 5.8 | 4.6 | 5.9 | 6.1 | 7.4 |
| no2:ppm | 0.01 | 0.01 | 0.02 | 0.02 | 0.03 | 0.02 | 0.02 | 0.01 | 0.01 | 0.01 | 0.01 | 0.01 | 0.01 | 0.01 | 0.02 | 0.03 | 0.02 | 0.02 | 0.02 | 0.01 | 0.01 | 0.01 | 0.01 | 0.01 | 0.01 | 0.02 | 0.02 | 0.02 | 0.02 | 0.02 | 0.02 | 0.02 | 0.01 | 0.01 | 0.01 | 0.01 | 0.01 | 0.01 | 0.01 | 0.01 | 0.01 | 0.02 |
| co:ppm | - | - | - | - | - | 0.34 | 0.39 | 0.27 | 0.24 | 0.19 | 0.28 | 0.29 | 0.33 | 0.39 | 0.43 | 0.43 | 0.2 | 0.29 | 0.37 | 0.27 | 0.24 | 0.46 | 0.28 | 0.26 | 0.3 | 0.3 | 0.43 | 0.41 | 0.33 | 0.31 | 0.46 | 0.28 | 0.32 | 0.3 | 0.33 | 0.3 | 0.28 | 0.48 | 0.19 | 0.26 | 0.33 | 0.35 |
| o3:ppm | 0.03 | 0.03 | 0.03 | 0.02 | 0.01 | 0.01 | 0.01 | 0.02 | 0.02 | 0.02 | 0.02 | 0.03 | 0.04 | 0.04 | 0.03 | 0.02 | 0.02 | 0.01 | 0.01 | 0.02 | 0.01 | 0.02 | 0.03 | 0.03 | 0.04 | 0.04 | 0.03 | 0.02 | 0.01 | 0.02 | 0.01 | 0.02 | 0.02 | 0.02 | 0.03 | 0.03 | 0.03 | 0.02 | 0.01 | 0.02 | 0.03 | 0.02 |