Polusi udara di Regional District of Fraser-Fort George: indeks kualitas udara real-time dan siaga asap.
Perkiraan kualitas polusi dan udara untuk Regional District of Fraser-Fort George. Hari ini Kamis, 18 Juni 2026. Nilai polusi udara berikut telah tercatat untuk Regional District of Fraser-Fort George:- ozon (O3) - 0 (Bagus)
- sulfur dioksida (SO2) - 0 (Bagus)
- nitrogen dioksida (NO2) - 0 (Bagus)
- partikulat Matter (PM 2.5) debu - 3 (Bagus)
- partikulat Matter (PM10) debu tersuspensi - 9 (Bagus)

Apa kualitas udara di Regional District of Fraser-Fort George hari ini? Apakah udara tercemar di Regional District of Fraser-Fort George?. Apakah ada Smog?
Bagaimana tingkat O3 hari ini di Regional District of Fraser-Fort George? (ozon (O3))
0 (Bagus)
Apa tingkat polusi SO2? (sulfur dioksida (SO2))
0 (Bagus)
Seberapa tinggi tingkat NO2? (nitrogen dioksida (NO2))
0 (Bagus)
Apa tingkat saat PM 2,5 in Regional District of Fraser-Fort George? (partikulat Matter (PM 2.5) debu)
Hari ini PM 2.5 tingkat:
3 (Bagus)
Sebagai perbandingan, tingkat tertinggi PM 2,5 in Regional District of Fraser-Fort George dalam 7 hari terakhir adalah: 7 (Kamis, 11 April 2024) dan Terendah: 3 (Selasa, 9 April 2024).
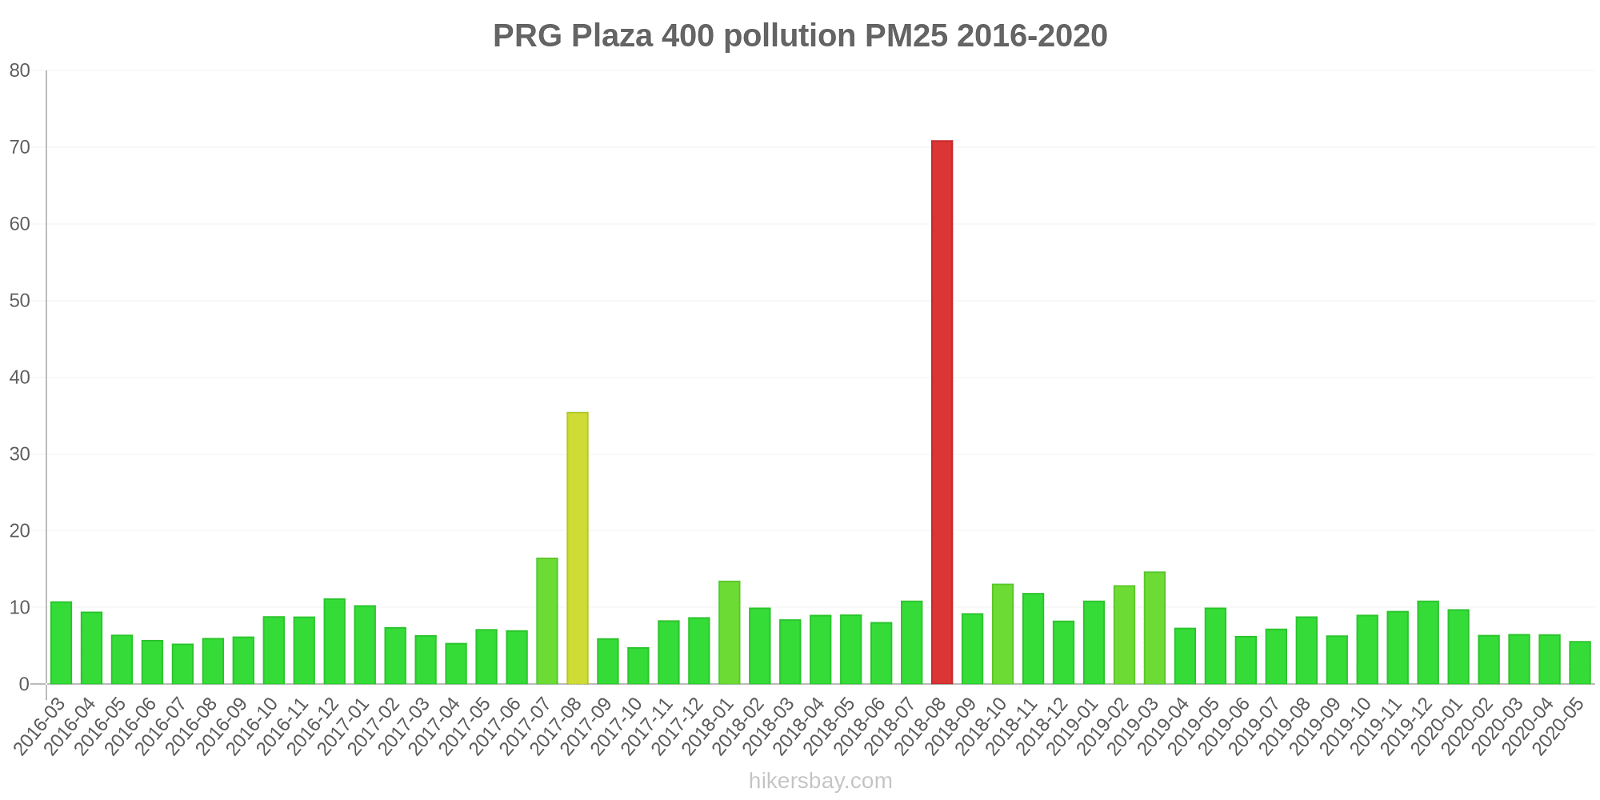
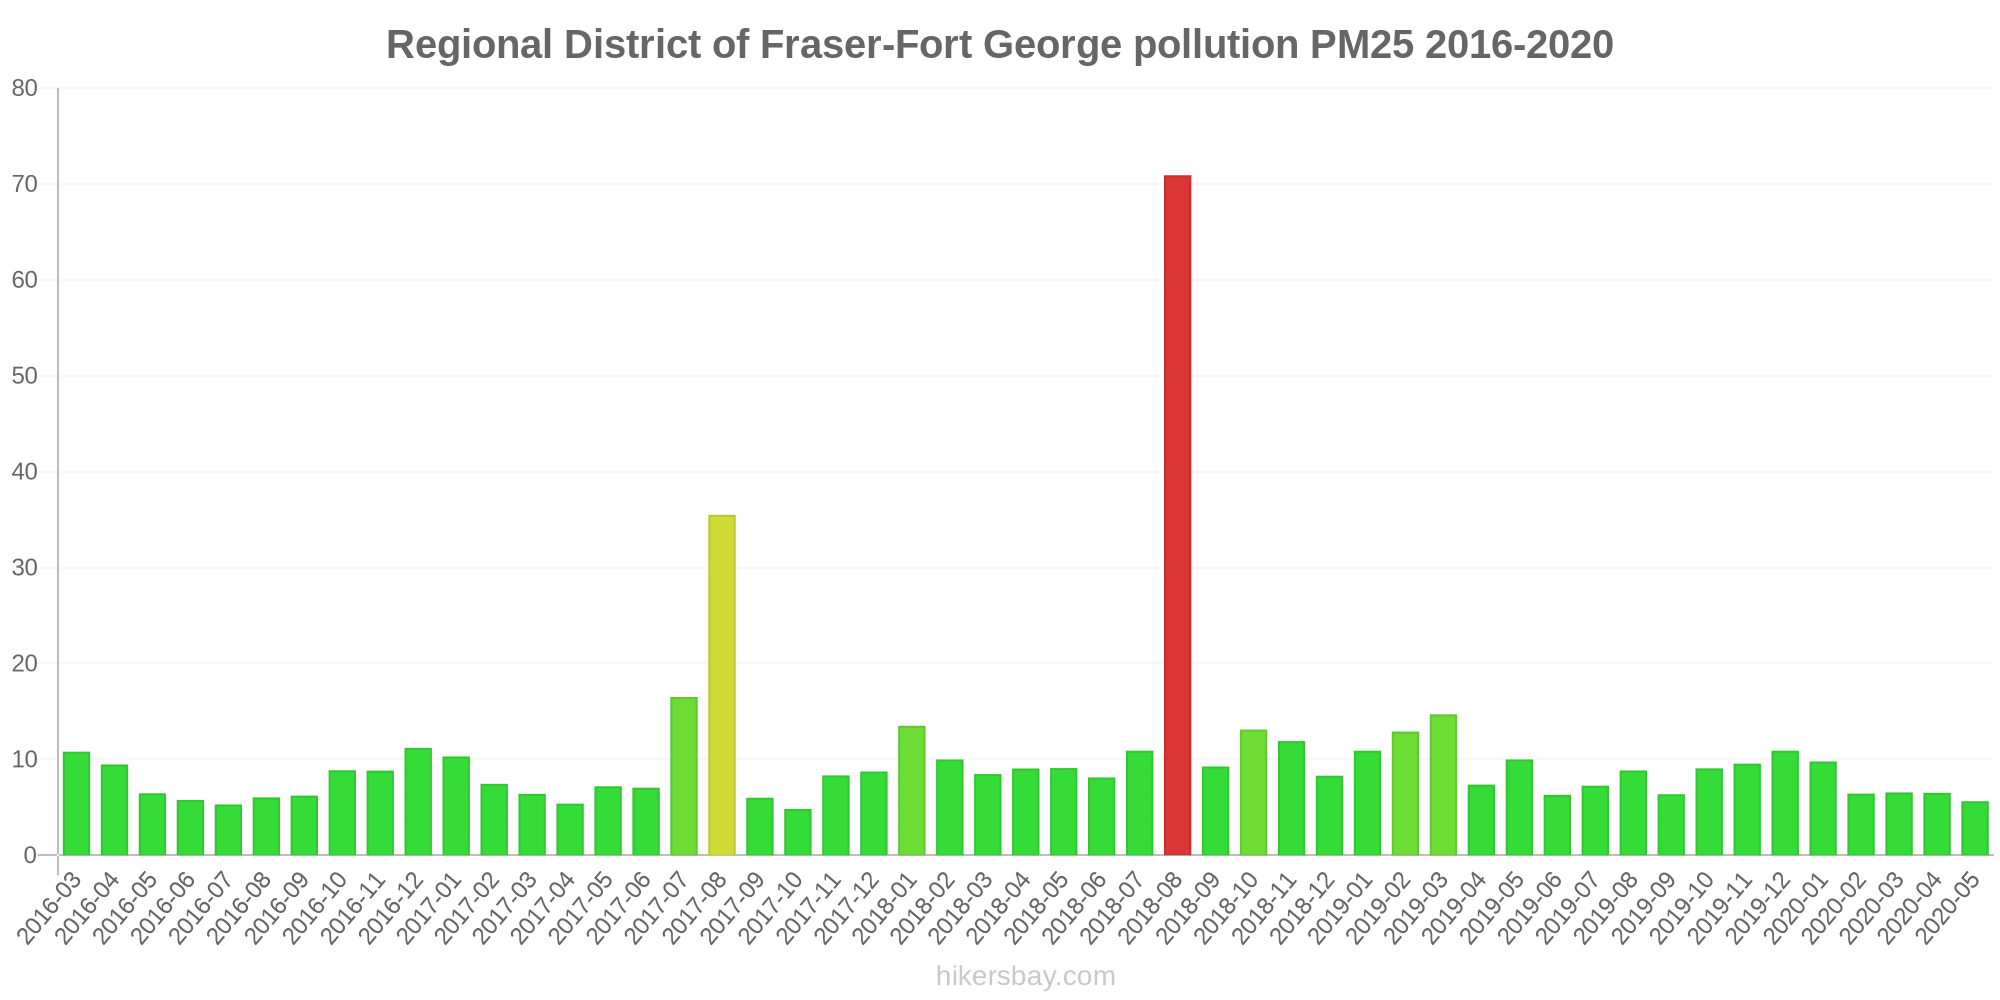
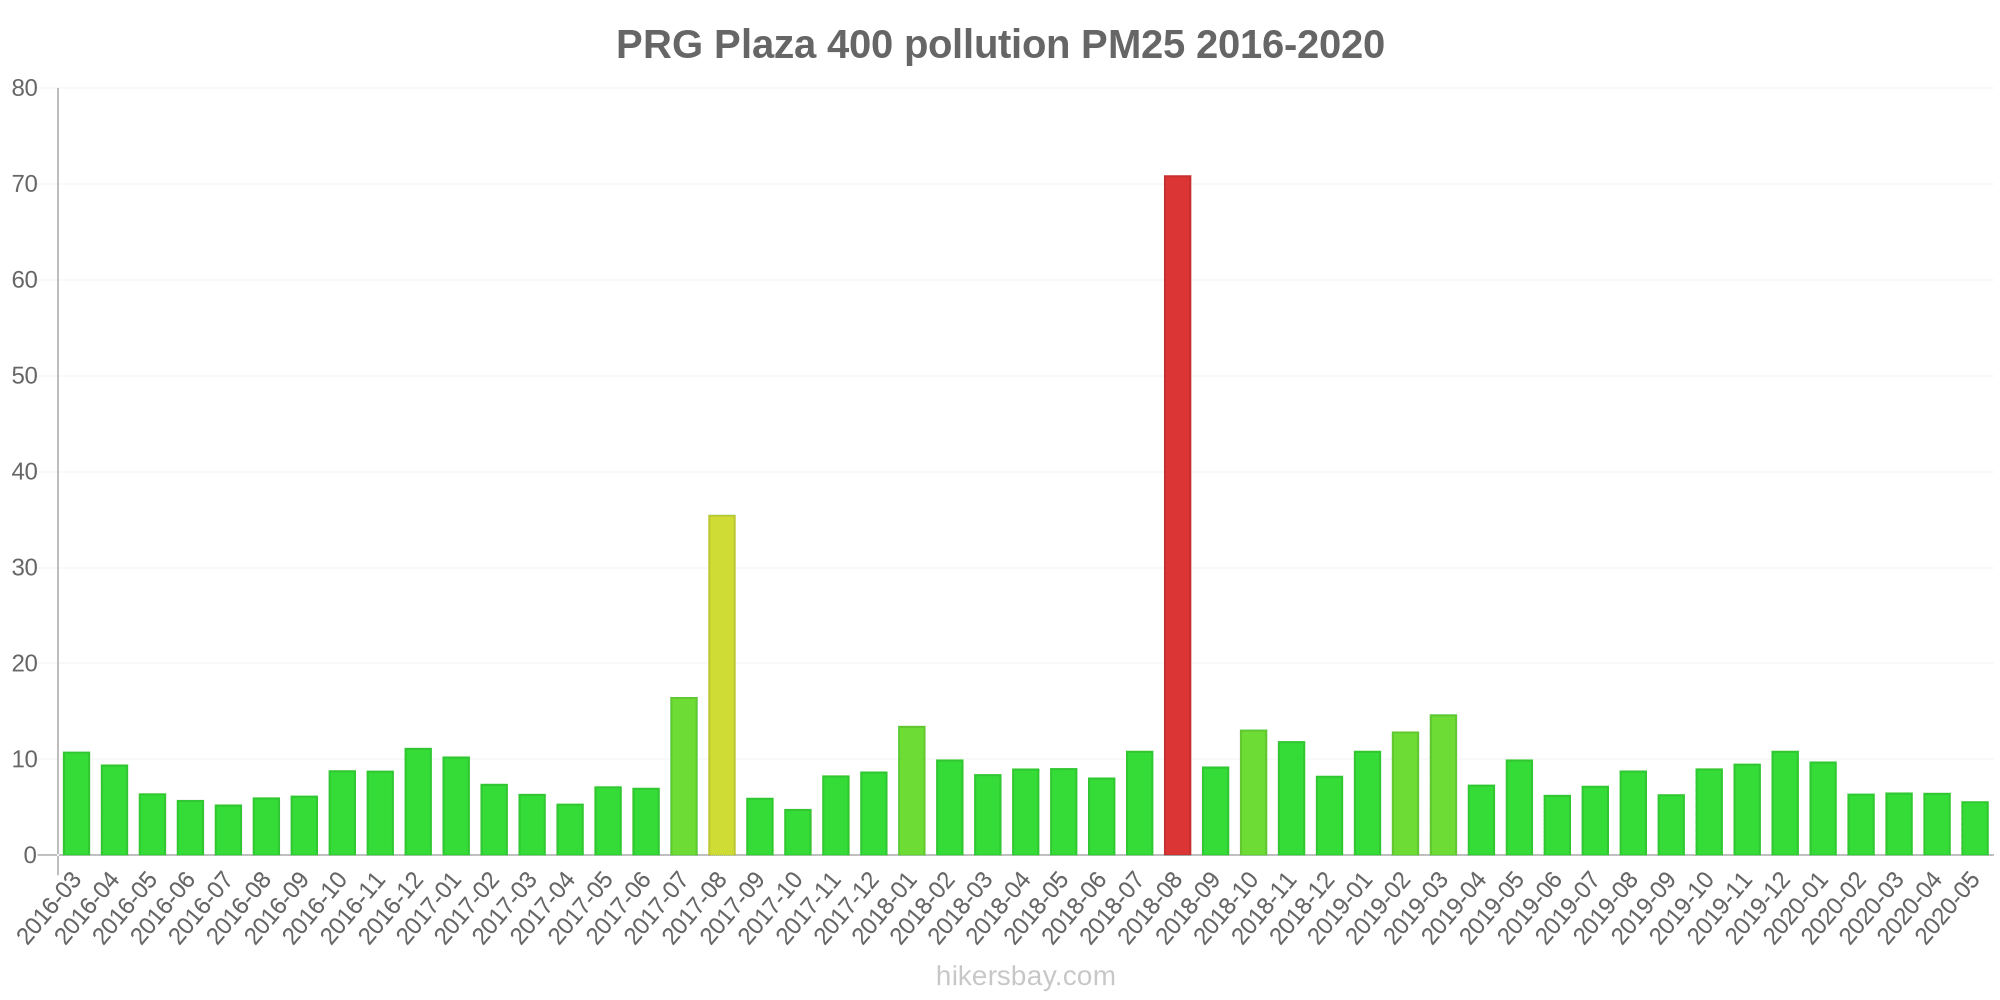
Nilai tertinggi PM 2.5 direkam: 71 (Agustus 2018).
Tingkat terendah dari partikulat Matter PM 2.5 polusi terjadi di bulan: Oktober (4.8).
Apa tingkat PM10 hari ini di Regional District of Fraser-Fort George? (partikulat Matter (PM10) debu tersuspensi)
Level saat ini dari partikulat Matter PM10 di Regional District of Fraser-Fort George adalah:
9 (Bagus)
Data saat ini Selasa, 16 April 2024 10.00
O3 0 (Bagus)
SO2 0 (Bagus)
0 (Bagus)
NO2 0 (Bagus)
PM2,5 3 (Bagus)
PM10 9 (Bagus)
Data tentang polusi udara dari beberapa hari terakhir di Regional District of Fraser-Fort George
index
2024-04-09
2024-04-10
2024-04-11
2024-04-12
2024-04-13
2024-04-14
2024-04-15
2024-04-16
so2
0
Good
0
Good
0
Good
0
Good
0
Good
0
Good
0
Good
0
Good
pm25
3
Good
4
Good
7
Good
3
Good
3
Good
7
Good
3
Good
3
Good
no2
0
Good
0
Good
0
Good
0
Good
0
Good
0
Good
0
Good
0
Good
o3
0
Good
0
Good
0
Good
0
Good
0
Good
0
Good
0
Good
0
Good
pm10
9
Good
20
Moderate
19
Good
5
Good
7
Good
-
Good
7
Good
9
Good
no
0
Good
0
Good
0
Good
0
Good
0
Good
0
Good
0
Good
0
Good
data source »
Polusi udara di Regional District of Fraser-Fort George dari Maret 2016 ke Mei 2020

index
2020-05
2020-04
2020-03
2020-02
2020-01
2019-12
2019-11
2019-10
2019-09
2019-08
2019-07
2019-06
2019-05
2019-04
2019-03
2019-02
2019-01
2018-12
2018-11
2018-10
2018-09
2018-08
2018-07
2018-06
2018-05
2018-04
2018-03
2018-02
2018-01
2017-12
2017-11
2017-10
2017-09
2017-08
2017-07
2017-06
2017-05
2017-04
2017-03
2017-02
2017-01
2016-12
2016-11
2016-10
2016-09
2016-08
2016-07
2016-06
2016-05
2016-04
2016-03
no2:ppm
0.01 (Good)
0.01 (Good)
0.01 (Good)
0.01 (Good)
0.01 (Good)
0.01 (Good)
0.01 (Good)
0.01 (Good)
0.01 (Good)
0.01 (Good)
0 (Good)
0 (Good)
0.01 (Good)
0.01 (Good)
0.02 (Good)
0.02 (Good)
0.02 (Good)
0.01 (Good)
0.01 (Good)
0.01 (Good)
0.01 (Good)
0.01 (Good)
0 (Good)
0 (Good)
0.01 (Good)
0.01 (Good)
0.02 (Good)
0.02 (Good)
0.02 (Good)
0.01 (Good)
0.01 (Good)
0.01 (Good)
0.01 (Good)
0.01 (Good)
0.01 (Good)
0 (Good)
0.01 (Good)
0.01 (Good)
0.01 (Good)
0.01 (Good)
0.02 (Good)
0.02 (Good)
0.01 (Good)
0.01 (Good)
0.01 (Good)
0 (Good)
0 (Good)
0 (Good)
0.01 (Good)
0.01 (Good)
0.01 (Good)
o3:ppm
0.03 (Good)
0.03 (Good)
0.03 (Good)
0.02 (Good)
0.02 (Good)
0.01 (Good)
0.01 (Good)
0.02 (Good)
0.01 (Good)
0.02 (Good)
0.02 (Good)
0.02 (Good)
0.03 (Good)
0.03 (Good)
0.02 (Good)
0.02 (Good)
0.01 (Good)
0.02 (Good)
0.01 (Good)
0.01 (Good)
0.02 (Good)
0.02 (Good)
0.02 (Good)
0.03 (Good)
0.03 (Good)
0.03 (Good)
0.03 (Good)
0.02 (Good)
0.01 (Good)
0.01 (Good)
0.01 (Good)
0.02 (Good)
0.01 (Good)
0.02 (Good)
0.02 (Good)
0.03 (Good)
0.03 (Good)
0.03 (Good)
0.03 (Good)
0.02 (Good)
0.02 (Good)
0.02 (Good)
0.01 (Good)
0.01 (Good)
0.01 (Good)
0.02 (Good)
0.02 (Good)
0.02 (Good)
0.03 (Good)
0.03 (Good)
0.02 (Good)
pm25
5.6 (Good)
6.5 (Good)
6.5 (Good)
6.4 (Good)
9.8 (Good)
11 (Good)
9.6 (Good)
9.1 (Good)
6.4 (Good)
8.8 (Good)
7.3 (Good)
6.3 (Good)
10 (Good)
7.4 (Good)
15 (Moderate)
13 (Good)
11 (Good)
8.3 (Good)
12 (Good)
13 (Moderate)
9.3 (Good)
71 (Unhealthy)
11 (Good)
8.1 (Good)
9.1 (Good)
9 (Good)
8.5 (Good)
10 (Good)
14 (Moderate)
8.7 (Good)
8.3 (Good)
4.8 (Good)
6 (Good)
36 (Unhealthy for Sensitive Groups)
17 (Moderate)
7 (Good)
7.2 (Good)
5.4 (Good)
6.4 (Good)
7.5 (Good)
10 (Good)
11 (Good)
8.8 (Good)
8.9 (Good)
6.2 (Good)
6 (Good)
5.3 (Good)
5.8 (Good)
6.5 (Good)
9.5 (Good)
11 (Good)
so2:ppm
0 (Good)
0 (Good)
0 (Good)
0 (Good)
0 (Good)
0 (Good)
0 (Good)
0 (Good)
0 (Good)
0 (Good)
0 (Good)
0 (Good)
0 (Good)
0 (Good)
0 (Good)
0 (Good)
0 (Good)
0 (Good)
0 (Good)
0 (Good)
0 (Good)
0 (Good)
0 (Good)
0 (Good)
0 (Good)
0 (Good)
0 (Good)
0 (Good)
0 (Good)
0 (Good)
0 (Good)
0 (Good)
- (Good)
0 (Good)
0 (Good)
0 (Good)
0 (Good)
0 (Good)
0 (Good)
0 (Good)
0 (Good)
0 (Good)
0 (Good)
0 (Good)
0 (Good)
0 (Good)
0 (Good)
0 (Good)
0 (Good)
0 (Good)
0 (Good)
data source »
Kualitas hidup di Regional District of Fraser-Fort George
Hijau dan taman di kota
Regional District of Fraser-Fort George
73%
Amerika Serikat: 70%
Venezuela: 41%
Islandia: 72%
partikulat Matter PM 2.5
Regional District of Fraser-Fort George
9 (Good)
Kenikmatan menghabiskan waktu di kota
Regional District of Fraser-Fort George
67%
Amerika Serikat: 75%
Bahama: 53%
Venezuela: 41%
Islandia: 89%
partikulat Matter PM10
Regional District of Fraser-Fort George
15 (Good)
Polusi udara
Regional District of Fraser-Fort George
42%
Amerika Serikat: 29%
Bahama: 52%
Venezuela: 59%
Islandia: 13%
Pembuangan sampah
Regional District of Fraser-Fort George
83%
Amerika Serikat: 71%
Bahama: 29%
Venezuela: 18%
Islandia: 79%
Ketersediaan dan kualitas air minum
Regional District of Fraser-Fort George
85%
Amerika Serikat: 71%
Bahama: 55%
Venezuela: 28%
Islandia: 96%
Kebersihan dan kerasnya
Regional District of Fraser-Fort George
59%
Amerika Serikat: 60%
Bahama: 35%
Venezuela: 22%
Islandia: 75%
Kebisingan dan polusi cahaya
Regional District of Fraser-Fort George
33%
Amerika Serikat: 47%
Bahama: 39%
Venezuela: 47%
Islandia: 23%
Polusi air
Regional District of Fraser-Fort George
42%
Amerika Serikat: 44%
Bahama: 58%
Venezuela: 76%
Islandia: 8,4%
Source: Numbeo
PRG Plaza 400
Selasa, 16 April 2024 10.00
O3 0.03 (Bagus)
ozon (O3)
SO2 0 (Bagus)
sulfur dioksida (SO2)
0 (Bagus)
index_name_no
NO2 0 (Bagus)
nitrogen dioksida (NO2)
PM2,5 2.7 (Bagus)
partikulat Matter (PM 2.5) debu
PM10 9 (Bagus)
partikulat Matter (PM10) debu tersuspensi
PRG Plaza 400
index
2024-04-16
2024-04-15
2024-04-14
2024-04-13
2024-04-12
2024-04-11
2024-04-10
2024-04-09
so2
0
0
0
0
0
0
0
0
pm25
3.5
3.1
7
2.7
3.1
7.2
4.1
3
no2
0.01
0
0.01
0
0.01
0.01
0.01
0.01
o3
0.03
0.04
0.03
0.04
0.03
0.03
0.03
0.03
pm10
9.1
7.3
-
7.2
5.4
19
20
8.9
no
0
0
0
0
0
0
0
0
PRG Plaza 400
2016-03 2020-05
index
2020-05
2020-04
2020-03
2020-02
2020-01
2019-12
2019-11
2019-10
2019-09
2019-08
2019-07
2019-06
2019-05
2019-04
2019-03
2019-02
2019-01
2018-12
2018-11
2018-10
2018-09
2018-08
2018-07
2018-06
2018-05
2018-04
2018-03
2018-02
2018-01
2017-12
2017-11
2017-10
2017-09
2017-08
2017-07
2017-06
2017-05
2017-04
2017-03
2017-02
2017-01
2016-12
2016-11
2016-10
2016-09
2016-08
2016-07
2016-06
2016-05
2016-04
2016-03
o3:ppm
0.03
0.03
0.03
0.02
0.02
0.01
0.01
0.02
0.01
0.02
0.02
0.02
0.03
0.03
0.02
0.02
0.01
0.02
0.01
0.01
0.02
0.02
0.02
0.03
0.03
0.03
0.03
0.02
0.01
0.01
0.01
0.02
0.01
0.02
0.02
0.03
0.03
0.03
0.03
0.02
0.02
0.02
0.01
0.01
0.01
0.02
0.02
0.02
0.03
0.03
0.02
so2:ppm
0
0
0
0
0
0
0
0
0
0
0
0
0
0
0
0
0
0
0
0
0
0
0
0
0
0
0
0
0
0
0
0
-
0
0
0
0
0
0
0
0
0
0
0
0
0
0
0
0
0
0
no2:ppm
0.01
0.01
0.01
0.01
0.01
0.01
0.01
0.01
0.01
0.01
0
0
0.01
0.01
0.02
0.02
0.02
0.01
0.01
0.01
0.01
0.01
0
0
0.01
0.01
0.02
0.02
0.02
0.01
0.01
0.01
0.01
0.01
0.01
0
0.01
0.01
0.01
0.01
0.02
0.02
0.01
0.01
0.01
0
0
0
0.01
0.01
0.01
pm25
5.6
6.5
6.5
6.4
9.8
11
9.6
9.1
6.4
8.8
7.3
6.3
10
7.4
15
13
11
8.3
12
13
9.3
71
11
8.1
9.1
9
8.5
10
14
8.7
8.3
4.8
6
36
17
7
7.2
5.4
6.4
7.5
10
11
8.8
8.9
6.2
6
5.3
5.8
6.5
9.5
11
* Pollution data source:
https://openaq.org
(AirNow)
The data is licensed under CC-By 4.0
O3 0 (Bagus)
SO2 0 (Bagus)
0 (Bagus)
NO2 0 (Bagus)
PM2,5 3 (Bagus)
PM10 9 (Bagus)
Data tentang polusi udara dari beberapa hari terakhir di Regional District of Fraser-Fort George
| index | 2024-04-09 | 2024-04-10 | 2024-04-11 | 2024-04-12 | 2024-04-13 | 2024-04-14 | 2024-04-15 | 2024-04-16 |
|---|---|---|---|---|---|---|---|---|
| so2 | 0 Good |
0 Good |
0 Good |
0 Good |
0 Good |
0 Good |
0 Good |
0 Good |
| pm25 | 3 Good |
4 Good |
7 Good |
3 Good |
3 Good |
7 Good |
3 Good |
3 Good |
| no2 | 0 Good |
0 Good |
0 Good |
0 Good |
0 Good |
0 Good |
0 Good |
0 Good |
| o3 | 0 Good |
0 Good |
0 Good |
0 Good |
0 Good |
0 Good |
0 Good |
0 Good |
| pm10 | 9 Good |
20 Moderate |
19 Good |
5 Good |
7 Good |
- Good |
7 Good |
9 Good |
| no | 0 Good |
0 Good |
0 Good |
0 Good |
0 Good |
0 Good |
0 Good |
0 Good |
| index | 2020-05 | 2020-04 | 2020-03 | 2020-02 | 2020-01 | 2019-12 | 2019-11 | 2019-10 | 2019-09 | 2019-08 | 2019-07 | 2019-06 | 2019-05 | 2019-04 | 2019-03 | 2019-02 | 2019-01 | 2018-12 | 2018-11 | 2018-10 | 2018-09 | 2018-08 | 2018-07 | 2018-06 | 2018-05 | 2018-04 | 2018-03 | 2018-02 | 2018-01 | 2017-12 | 2017-11 | 2017-10 | 2017-09 | 2017-08 | 2017-07 | 2017-06 | 2017-05 | 2017-04 | 2017-03 | 2017-02 | 2017-01 | 2016-12 | 2016-11 | 2016-10 | 2016-09 | 2016-08 | 2016-07 | 2016-06 | 2016-05 | 2016-04 | 2016-03 |
|---|---|---|---|---|---|---|---|---|---|---|---|---|---|---|---|---|---|---|---|---|---|---|---|---|---|---|---|---|---|---|---|---|---|---|---|---|---|---|---|---|---|---|---|---|---|---|---|---|---|---|---|
| no2:ppm | 0.01 (Good) | 0.01 (Good) | 0.01 (Good) | 0.01 (Good) | 0.01 (Good) | 0.01 (Good) | 0.01 (Good) | 0.01 (Good) | 0.01 (Good) | 0.01 (Good) | 0 (Good) | 0 (Good) | 0.01 (Good) | 0.01 (Good) | 0.02 (Good) | 0.02 (Good) | 0.02 (Good) | 0.01 (Good) | 0.01 (Good) | 0.01 (Good) | 0.01 (Good) | 0.01 (Good) | 0 (Good) | 0 (Good) | 0.01 (Good) | 0.01 (Good) | 0.02 (Good) | 0.02 (Good) | 0.02 (Good) | 0.01 (Good) | 0.01 (Good) | 0.01 (Good) | 0.01 (Good) | 0.01 (Good) | 0.01 (Good) | 0 (Good) | 0.01 (Good) | 0.01 (Good) | 0.01 (Good) | 0.01 (Good) | 0.02 (Good) | 0.02 (Good) | 0.01 (Good) | 0.01 (Good) | 0.01 (Good) | 0 (Good) | 0 (Good) | 0 (Good) | 0.01 (Good) | 0.01 (Good) | 0.01 (Good) |
| o3:ppm | 0.03 (Good) | 0.03 (Good) | 0.03 (Good) | 0.02 (Good) | 0.02 (Good) | 0.01 (Good) | 0.01 (Good) | 0.02 (Good) | 0.01 (Good) | 0.02 (Good) | 0.02 (Good) | 0.02 (Good) | 0.03 (Good) | 0.03 (Good) | 0.02 (Good) | 0.02 (Good) | 0.01 (Good) | 0.02 (Good) | 0.01 (Good) | 0.01 (Good) | 0.02 (Good) | 0.02 (Good) | 0.02 (Good) | 0.03 (Good) | 0.03 (Good) | 0.03 (Good) | 0.03 (Good) | 0.02 (Good) | 0.01 (Good) | 0.01 (Good) | 0.01 (Good) | 0.02 (Good) | 0.01 (Good) | 0.02 (Good) | 0.02 (Good) | 0.03 (Good) | 0.03 (Good) | 0.03 (Good) | 0.03 (Good) | 0.02 (Good) | 0.02 (Good) | 0.02 (Good) | 0.01 (Good) | 0.01 (Good) | 0.01 (Good) | 0.02 (Good) | 0.02 (Good) | 0.02 (Good) | 0.03 (Good) | 0.03 (Good) | 0.02 (Good) |
| pm25 | 5.6 (Good) | 6.5 (Good) | 6.5 (Good) | 6.4 (Good) | 9.8 (Good) | 11 (Good) | 9.6 (Good) | 9.1 (Good) | 6.4 (Good) | 8.8 (Good) | 7.3 (Good) | 6.3 (Good) | 10 (Good) | 7.4 (Good) | 15 (Moderate) | 13 (Good) | 11 (Good) | 8.3 (Good) | 12 (Good) | 13 (Moderate) | 9.3 (Good) | 71 (Unhealthy) | 11 (Good) | 8.1 (Good) | 9.1 (Good) | 9 (Good) | 8.5 (Good) | 10 (Good) | 14 (Moderate) | 8.7 (Good) | 8.3 (Good) | 4.8 (Good) | 6 (Good) | 36 (Unhealthy for Sensitive Groups) | 17 (Moderate) | 7 (Good) | 7.2 (Good) | 5.4 (Good) | 6.4 (Good) | 7.5 (Good) | 10 (Good) | 11 (Good) | 8.8 (Good) | 8.9 (Good) | 6.2 (Good) | 6 (Good) | 5.3 (Good) | 5.8 (Good) | 6.5 (Good) | 9.5 (Good) | 11 (Good) |
| so2:ppm | 0 (Good) | 0 (Good) | 0 (Good) | 0 (Good) | 0 (Good) | 0 (Good) | 0 (Good) | 0 (Good) | 0 (Good) | 0 (Good) | 0 (Good) | 0 (Good) | 0 (Good) | 0 (Good) | 0 (Good) | 0 (Good) | 0 (Good) | 0 (Good) | 0 (Good) | 0 (Good) | 0 (Good) | 0 (Good) | 0 (Good) | 0 (Good) | 0 (Good) | 0 (Good) | 0 (Good) | 0 (Good) | 0 (Good) | 0 (Good) | 0 (Good) | 0 (Good) | - (Good) | 0 (Good) | 0 (Good) | 0 (Good) | 0 (Good) | 0 (Good) | 0 (Good) | 0 (Good) | 0 (Good) | 0 (Good) | 0 (Good) | 0 (Good) | 0 (Good) | 0 (Good) | 0 (Good) | 0 (Good) | 0 (Good) | 0 (Good) | 0 (Good) |
Hijau dan taman di kota
Regional District of Fraser-Fort George 73%
Amerika Serikat: 70% Venezuela: 41% Islandia: 72%partikulat Matter PM 2.5
Regional District of Fraser-Fort George 9 (Good)
Kenikmatan menghabiskan waktu di kota
Regional District of Fraser-Fort George 67%
Amerika Serikat: 75% Bahama: 53% Venezuela: 41% Islandia: 89%partikulat Matter PM10
Regional District of Fraser-Fort George 15 (Good)
Polusi udara
Regional District of Fraser-Fort George 42%
Amerika Serikat: 29% Bahama: 52% Venezuela: 59% Islandia: 13%Pembuangan sampah
Regional District of Fraser-Fort George 83%
Amerika Serikat: 71% Bahama: 29% Venezuela: 18% Islandia: 79%Ketersediaan dan kualitas air minum
Regional District of Fraser-Fort George 85%
Amerika Serikat: 71% Bahama: 55% Venezuela: 28% Islandia: 96%Kebersihan dan kerasnya
Regional District of Fraser-Fort George 59%
Amerika Serikat: 60% Bahama: 35% Venezuela: 22% Islandia: 75%Kebisingan dan polusi cahaya
Regional District of Fraser-Fort George 33%
Amerika Serikat: 47% Bahama: 39% Venezuela: 47% Islandia: 23%Polusi air
Regional District of Fraser-Fort George 42%
Amerika Serikat: 44% Bahama: 58% Venezuela: 76% Islandia: 8,4%O3 0.03 (Bagus)
ozon (O3)SO2 0 (Bagus)
sulfur dioksida (SO2)0 (Bagus)
index_name_noNO2 0 (Bagus)
nitrogen dioksida (NO2)PM2,5 2.7 (Bagus)
partikulat Matter (PM 2.5) debuPM10 9 (Bagus)
partikulat Matter (PM10) debu tersuspensiPRG Plaza 400
| index | 2024-04-16 | 2024-04-15 | 2024-04-14 | 2024-04-13 | 2024-04-12 | 2024-04-11 | 2024-04-10 | 2024-04-09 |
|---|---|---|---|---|---|---|---|---|
| so2 | 0 | 0 | 0 | 0 | 0 | 0 | 0 | 0 |
| pm25 | 3.5 | 3.1 | 7 | 2.7 | 3.1 | 7.2 | 4.1 | 3 |
| no2 | 0.01 | 0 | 0.01 | 0 | 0.01 | 0.01 | 0.01 | 0.01 |
| o3 | 0.03 | 0.04 | 0.03 | 0.04 | 0.03 | 0.03 | 0.03 | 0.03 |
| pm10 | 9.1 | 7.3 | - | 7.2 | 5.4 | 19 | 20 | 8.9 |
| no | 0 | 0 | 0 | 0 | 0 | 0 | 0 | 0 |
PRG Plaza 400
| index | 2020-05 | 2020-04 | 2020-03 | 2020-02 | 2020-01 | 2019-12 | 2019-11 | 2019-10 | 2019-09 | 2019-08 | 2019-07 | 2019-06 | 2019-05 | 2019-04 | 2019-03 | 2019-02 | 2019-01 | 2018-12 | 2018-11 | 2018-10 | 2018-09 | 2018-08 | 2018-07 | 2018-06 | 2018-05 | 2018-04 | 2018-03 | 2018-02 | 2018-01 | 2017-12 | 2017-11 | 2017-10 | 2017-09 | 2017-08 | 2017-07 | 2017-06 | 2017-05 | 2017-04 | 2017-03 | 2017-02 | 2017-01 | 2016-12 | 2016-11 | 2016-10 | 2016-09 | 2016-08 | 2016-07 | 2016-06 | 2016-05 | 2016-04 | 2016-03 |
|---|---|---|---|---|---|---|---|---|---|---|---|---|---|---|---|---|---|---|---|---|---|---|---|---|---|---|---|---|---|---|---|---|---|---|---|---|---|---|---|---|---|---|---|---|---|---|---|---|---|---|---|
| o3:ppm | 0.03 | 0.03 | 0.03 | 0.02 | 0.02 | 0.01 | 0.01 | 0.02 | 0.01 | 0.02 | 0.02 | 0.02 | 0.03 | 0.03 | 0.02 | 0.02 | 0.01 | 0.02 | 0.01 | 0.01 | 0.02 | 0.02 | 0.02 | 0.03 | 0.03 | 0.03 | 0.03 | 0.02 | 0.01 | 0.01 | 0.01 | 0.02 | 0.01 | 0.02 | 0.02 | 0.03 | 0.03 | 0.03 | 0.03 | 0.02 | 0.02 | 0.02 | 0.01 | 0.01 | 0.01 | 0.02 | 0.02 | 0.02 | 0.03 | 0.03 | 0.02 |
| so2:ppm | 0 | 0 | 0 | 0 | 0 | 0 | 0 | 0 | 0 | 0 | 0 | 0 | 0 | 0 | 0 | 0 | 0 | 0 | 0 | 0 | 0 | 0 | 0 | 0 | 0 | 0 | 0 | 0 | 0 | 0 | 0 | 0 | - | 0 | 0 | 0 | 0 | 0 | 0 | 0 | 0 | 0 | 0 | 0 | 0 | 0 | 0 | 0 | 0 | 0 | 0 |
| no2:ppm | 0.01 | 0.01 | 0.01 | 0.01 | 0.01 | 0.01 | 0.01 | 0.01 | 0.01 | 0.01 | 0 | 0 | 0.01 | 0.01 | 0.02 | 0.02 | 0.02 | 0.01 | 0.01 | 0.01 | 0.01 | 0.01 | 0 | 0 | 0.01 | 0.01 | 0.02 | 0.02 | 0.02 | 0.01 | 0.01 | 0.01 | 0.01 | 0.01 | 0.01 | 0 | 0.01 | 0.01 | 0.01 | 0.01 | 0.02 | 0.02 | 0.01 | 0.01 | 0.01 | 0 | 0 | 0 | 0.01 | 0.01 | 0.01 |
| pm25 | 5.6 | 6.5 | 6.5 | 6.4 | 9.8 | 11 | 9.6 | 9.1 | 6.4 | 8.8 | 7.3 | 6.3 | 10 | 7.4 | 15 | 13 | 11 | 8.3 | 12 | 13 | 9.3 | 71 | 11 | 8.1 | 9.1 | 9 | 8.5 | 10 | 14 | 8.7 | 8.3 | 4.8 | 6 | 36 | 17 | 7 | 7.2 | 5.4 | 6.4 | 7.5 | 10 | 11 | 8.8 | 8.9 | 6.2 | 6 | 5.3 | 5.8 | 6.5 | 9.5 | 11 |