Polusi udara di Regional District of Bulkley-Nechako: indeks kualitas udara real-time dan siaga asap.
Perkiraan kualitas polusi dan udara untuk Regional District of Bulkley-Nechako. Hari ini Kamis, 18 Juni 2026. Nilai polusi udara berikut telah tercatat untuk Regional District of Bulkley-Nechako:- partikulat Matter (PM 2.5) debu - 32 (Moderat)
- nitrogen dioksida (NO2) - 0 (Bagus)
- ozon (O3) - 0 (Bagus)
- sulfur dioksida (SO2) - 0 (Bagus)
- partikulat Matter (PM10) debu tersuspensi - 25 (Moderat)
- karbon monoksida (CO) - 100 (Bagus)

Apa kualitas udara di Regional District of Bulkley-Nechako hari ini? Apakah udara tercemar di Regional District of Bulkley-Nechako?. Apakah ada Smog?
Apa tingkat saat PM 2,5 in Regional District of Bulkley-Nechako? (partikulat Matter (PM 2.5) debu)
Hari ini PM 2.5 tingkat:
32 (Moderat)
Sebagai perbandingan, tingkat tertinggi PM 2,5 in Regional District of Bulkley-Nechako dalam 7 hari terakhir adalah: 11 (Jumat, 27 Mei 2022) dan Terendah: 11 (Jumat, 27 Mei 2022).
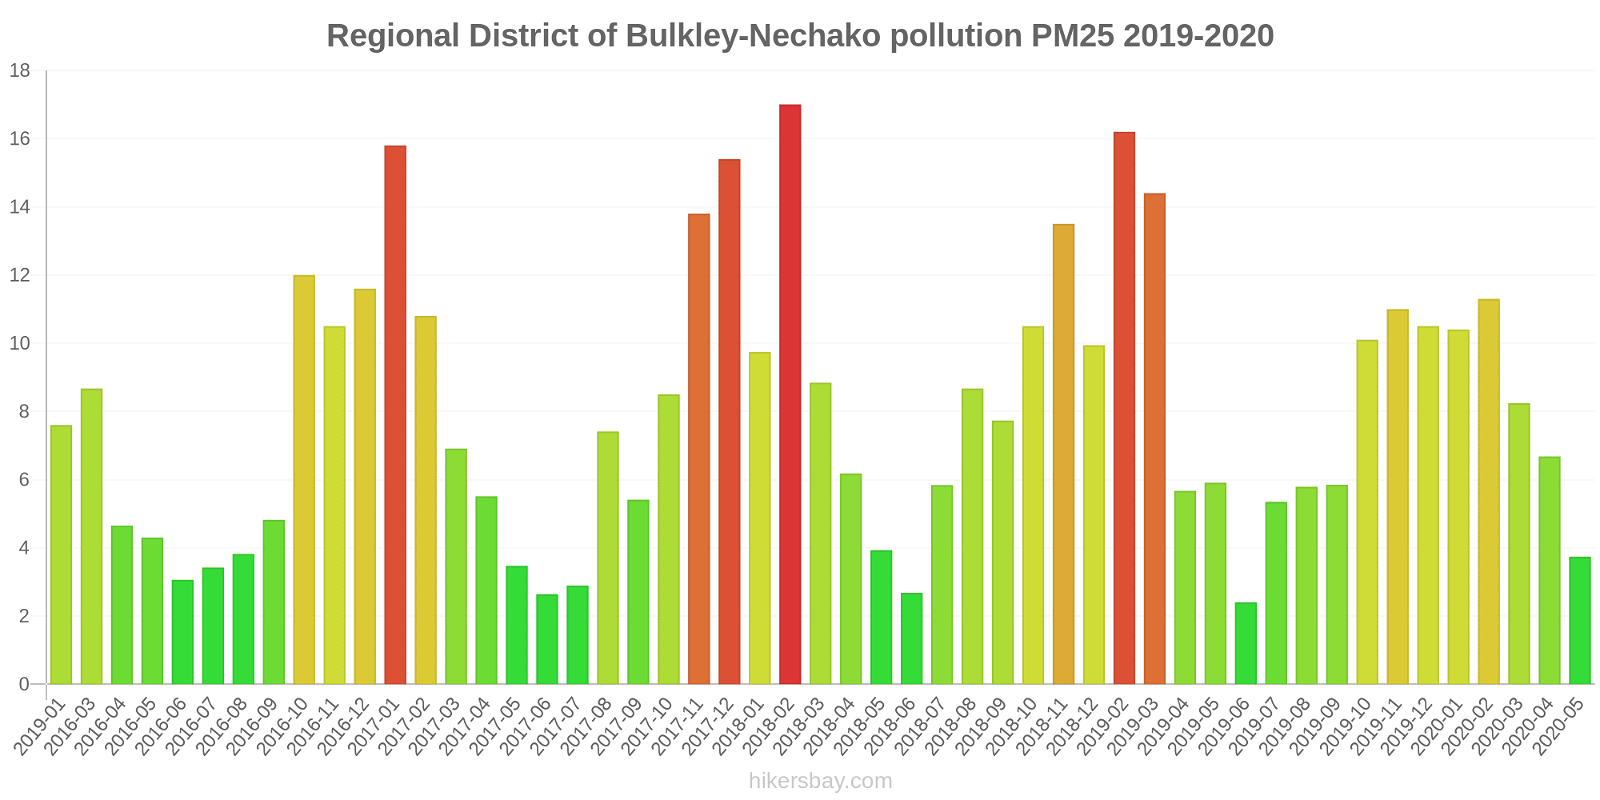
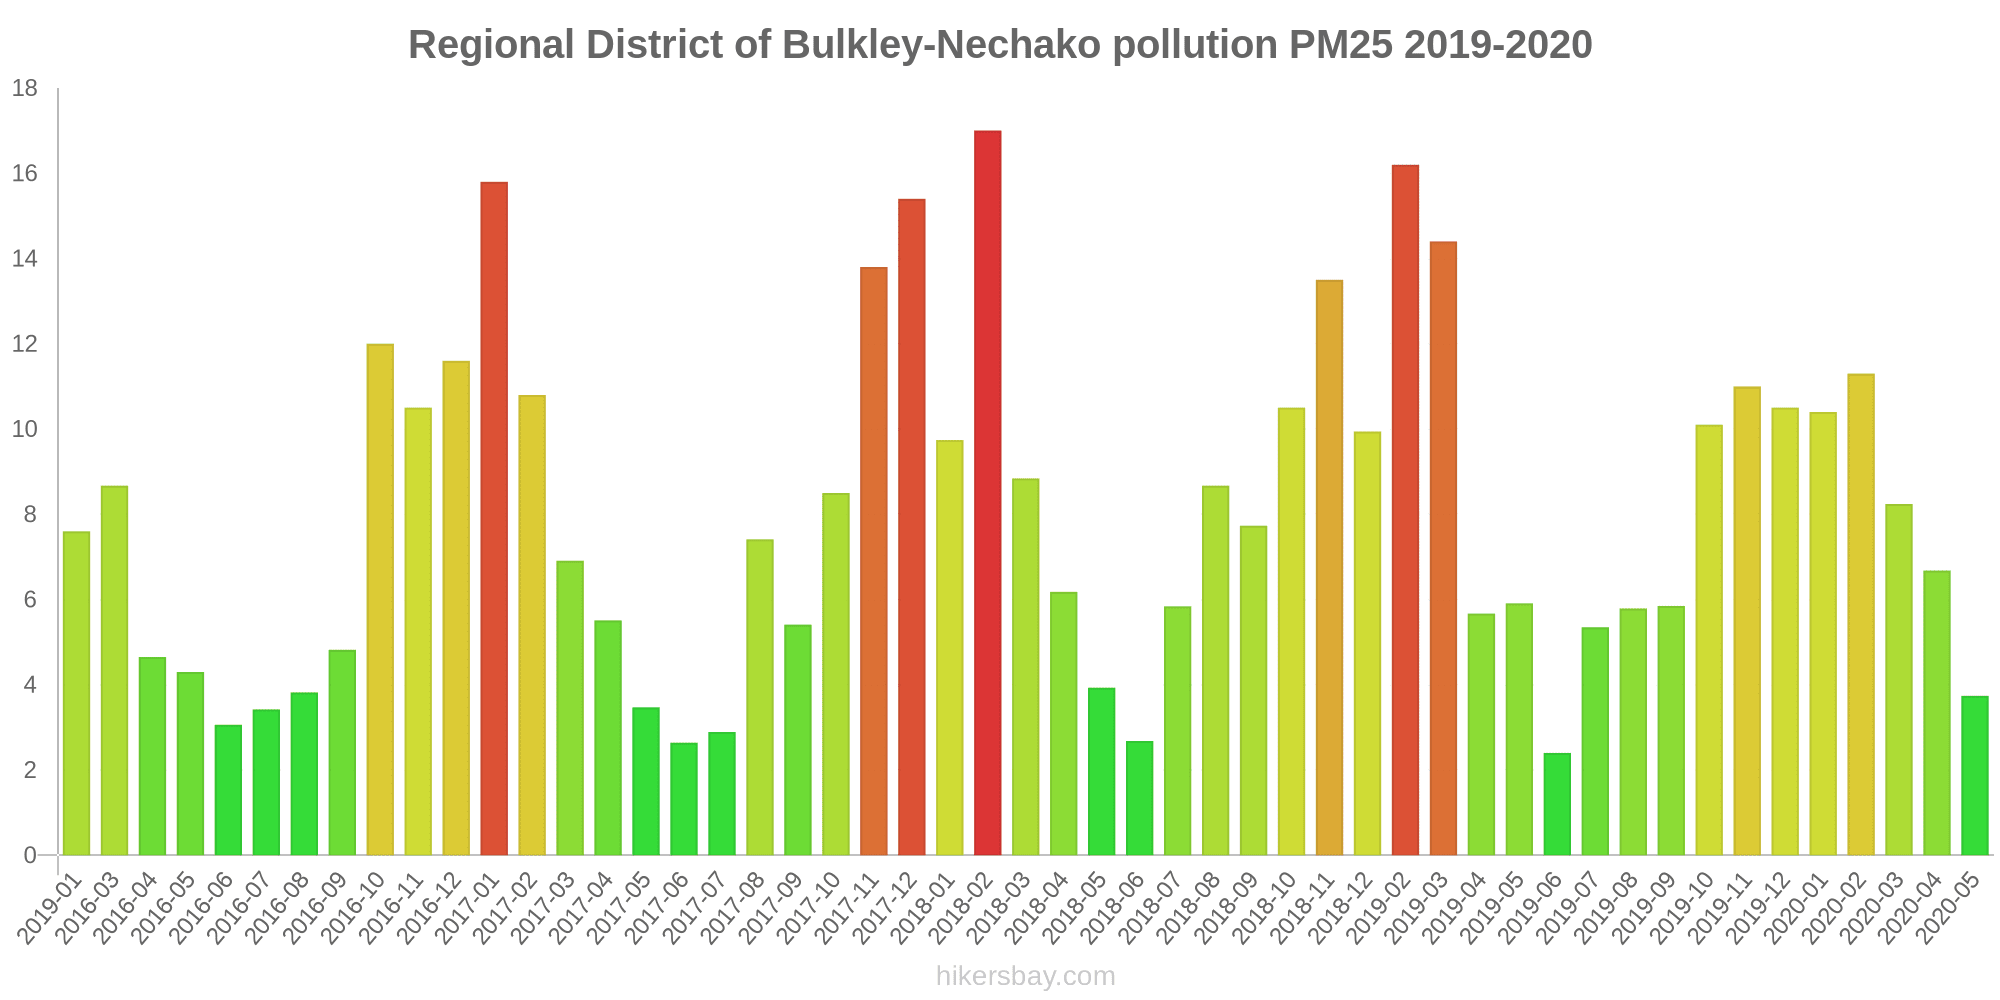
Nilai tertinggi PM 2.5 direkam: 17 (Februari 2018).
Tingkat terendah dari partikulat Matter PM 2.5 polusi terjadi di bulan: Juni (2.4).
Seberapa tinggi tingkat NO2? (nitrogen dioksida (NO2))
0 (Bagus)
Bagaimana tingkat O3 hari ini di Regional District of Bulkley-Nechako? (ozon (O3))
0 (Bagus)
Apa tingkat polusi SO2? (sulfur dioksida (SO2))
0 (Bagus)
Apa tingkat PM10 hari ini di Regional District of Bulkley-Nechako? (partikulat Matter (PM10) debu tersuspensi)
Level saat ini dari partikulat Matter PM10 di Regional District of Bulkley-Nechako adalah:
25 (Moderat)
Nilai PM10 tertinggi biasanya terjadi di bulan: 53 (Mei 2018).
Nilai terendah dari partikulat PM10 pencemaran Regional District of Bulkley-Nechako biasanya dicatat di: Februari (9.8).
Seberapa tinggi tingkat CO? (karbon monoksida (CO))
100 (Bagus)
Data saat ini Jumat, 27 Mei 2022 15.00
PM2,5 32 (Moderat)
NO2 0 (Bagus)
O3 0 (Bagus)
SO2 0 (Bagus)
PM10 25 (Moderat)
CO 100 (Bagus)
Data tentang polusi udara dari beberapa hari terakhir di Regional District of Bulkley-Nechako
index
2022-05-27
pm25
11
Good
no2
8
Good
o3
9
Good
so2
8
Good
pm10
30
Moderate
co
11
Good
data source »
Polusi udara di Regional District of Bulkley-Nechako dari Januari 2019 ke Mei 2018
index
2018-05
2018-04
2018-03
2018-02
2018-01
2017-12
2017-11
2017-10
2017-09
2017-08
2017-07
2017-06
2017-05
2017-04
2017-03
2017-02
2017-01
2016-12
2016-11
2016-10
2016-09
2016-08
2016-07
2016-06
2016-05
2016-04
2016-03
2020-05
2020-04
2020-03
2020-02
2020-01
2019-12
2019-11
2019-10
2019-09
2019-08
2019-07
2019-06
2019-05
2019-04
2019-03
2019-02
2018-12
2018-11
2018-10
2018-09
2018-08
2018-07
2018-06
2019-01
pm10
53 (Unhealthy for Sensitive Groups)
45 (Moderate)
18 (Good)
9.8 (Good)
10 (Good)
11 (Good)
12 (Good)
15 (Good)
14 (Good)
19 (Good)
15 (Good)
13 (Good)
13 (Good)
19 (Good)
19 (Good)
16 (Good)
11 (Good)
11 (Good)
11 (Good)
13 (Good)
11 (Good)
12 (Good)
12 (Good)
12 (Good)
11 (Good)
12 (Good)
21 (Moderate)
- (Good)
- (Good)
- (Good)
- (Good)
- (Good)
- (Good)
- (Good)
- (Good)
- (Good)
- (Good)
- (Good)
- (Good)
- (Good)
- (Good)
- (Good)
- (Good)
- (Good)
- (Good)
- (Good)
- (Good)
- (Good)
- (Good)
- (Good)
- (Good)
no2:ppm
0 (Good)
0 (Good)
0.01 (Good)
0.02 (Good)
0.01 (Good)
0.01 (Good)
0.01 (Good)
0 (Good)
0 (Good)
0 (Good)
0 (Good)
0 (Good)
0 (Good)
0.01 (Good)
0.01 (Good)
0.01 (Good)
0.01 (Good)
0.01 (Good)
0.01 (Good)
0 (Good)
0 (Good)
0 (Good)
0 (Good)
0 (Good)
0 (Good)
0 (Good)
0.01 (Good)
0 (Good)
0 (Good)
0.01 (Good)
0.01 (Good)
0.01 (Good)
0.01 (Good)
0.01 (Good)
0 (Good)
0 (Good)
0 (Good)
0 (Good)
0 (Good)
0 (Good)
0 (Good)
0.01 (Good)
0.01 (Good)
0 (Good)
0.01 (Good)
0.01 (Good)
0 (Good)
0 (Good)
0 (Good)
0 (Good)
- (Good)
o3:ppm
0.03 (Good)
0.03 (Good)
0.03 (Good)
0.01 (Good)
0.01 (Good)
0.01 (Good)
0.01 (Good)
0.01 (Good)
0.01 (Good)
0.02 (Good)
0.02 (Good)
0.02 (Good)
0.03 (Good)
0.03 (Good)
0.03 (Good)
0.02 (Good)
0.01 (Good)
0.01 (Good)
0.01 (Good)
0.01 (Good)
0.01 (Good)
0.01 (Good)
0.01 (Good)
0.02 (Good)
0.02 (Good)
0.02 (Good)
0.02 (Good)
0.02 (Good)
0.02 (Good)
0.02 (Good)
0.01 (Good)
0.02 (Good)
0.01 (Good)
0.01 (Good)
0.01 (Good)
0.01 (Good)
0.01 (Good)
0.01 (Good)
0.02 (Good)
0.02 (Good)
0.03 (Good)
0.02 (Good)
0.01 (Good)
0.01 (Good)
0.01 (Good)
0.01 (Good)
0.01 (Good)
0.02 (Good)
0.02 (Good)
0.02 (Good)
- (Good)
pm25
3.9 (Good)
6.2 (Good)
8.8 (Good)
17 (Moderate)
9.7 (Good)
15 (Moderate)
14 (Moderate)
8.5 (Good)
5.4 (Good)
7.4 (Good)
2.9 (Good)
2.6 (Good)
3.5 (Good)
5.5 (Good)
6.9 (Good)
11 (Good)
16 (Moderate)
12 (Good)
11 (Good)
12 (Good)
4.8 (Good)
3.8 (Good)
3.4 (Good)
3.1 (Good)
4.3 (Good)
4.7 (Good)
8.7 (Good)
3.7 (Good)
6.7 (Good)
8.2 (Good)
11 (Good)
10 (Good)
11 (Good)
11 (Good)
10 (Good)
5.8 (Good)
5.8 (Good)
5.3 (Good)
2.4 (Good)
5.9 (Good)
5.7 (Good)
14 (Moderate)
16 (Moderate)
9.9 (Good)
14 (Moderate)
11 (Good)
7.7 (Good)
8.7 (Good)
5.8 (Good)
2.7 (Good)
7.6 (Good)
data source »
Kualitas hidup di Regional District of Bulkley-Nechako
Hijau dan taman di kota
Regional District of Bulkley-Nechako
61%
Amerika Serikat: 70%
Venezuela: 41%
Islandia: 72%
partikulat Matter PM 2.5
Regional District of Bulkley-Nechako
12 (Good)
Kenikmatan menghabiskan waktu di kota
Regional District of Bulkley-Nechako
59%
Amerika Serikat: 75%
Bahama: 53%
Venezuela: 41%
Islandia: 89%
partikulat Matter PM10
Regional District of Bulkley-Nechako
25 (Moderate)
Polusi udara
Regional District of Bulkley-Nechako
55%
Amerika Serikat: 29%
Bahama: 52%
Venezuela: 59%
Islandia: 13%
Pembuangan sampah
Regional District of Bulkley-Nechako
71%
Amerika Serikat: 71%
Bahama: 29%
Venezuela: 18%
Islandia: 79%
Ketersediaan dan kualitas air minum
Regional District of Bulkley-Nechako
63%
Amerika Serikat: 71%
Bahama: 55%
Venezuela: 28%
Islandia: 96%
Kebersihan dan kerasnya
Regional District of Bulkley-Nechako
53%
Amerika Serikat: 60%
Bahama: 35%
Venezuela: 22%
Islandia: 75%
Kebisingan dan polusi cahaya
Regional District of Bulkley-Nechako
56%
Amerika Serikat: 47%
Bahama: 39%
Venezuela: 47%
Islandia: 23%
Polusi air
Regional District of Bulkley-Nechako
57%
Amerika Serikat: 44%
Bahama: 58%
Venezuela: 76%
Islandia: 8,4%
Source: Numbeo
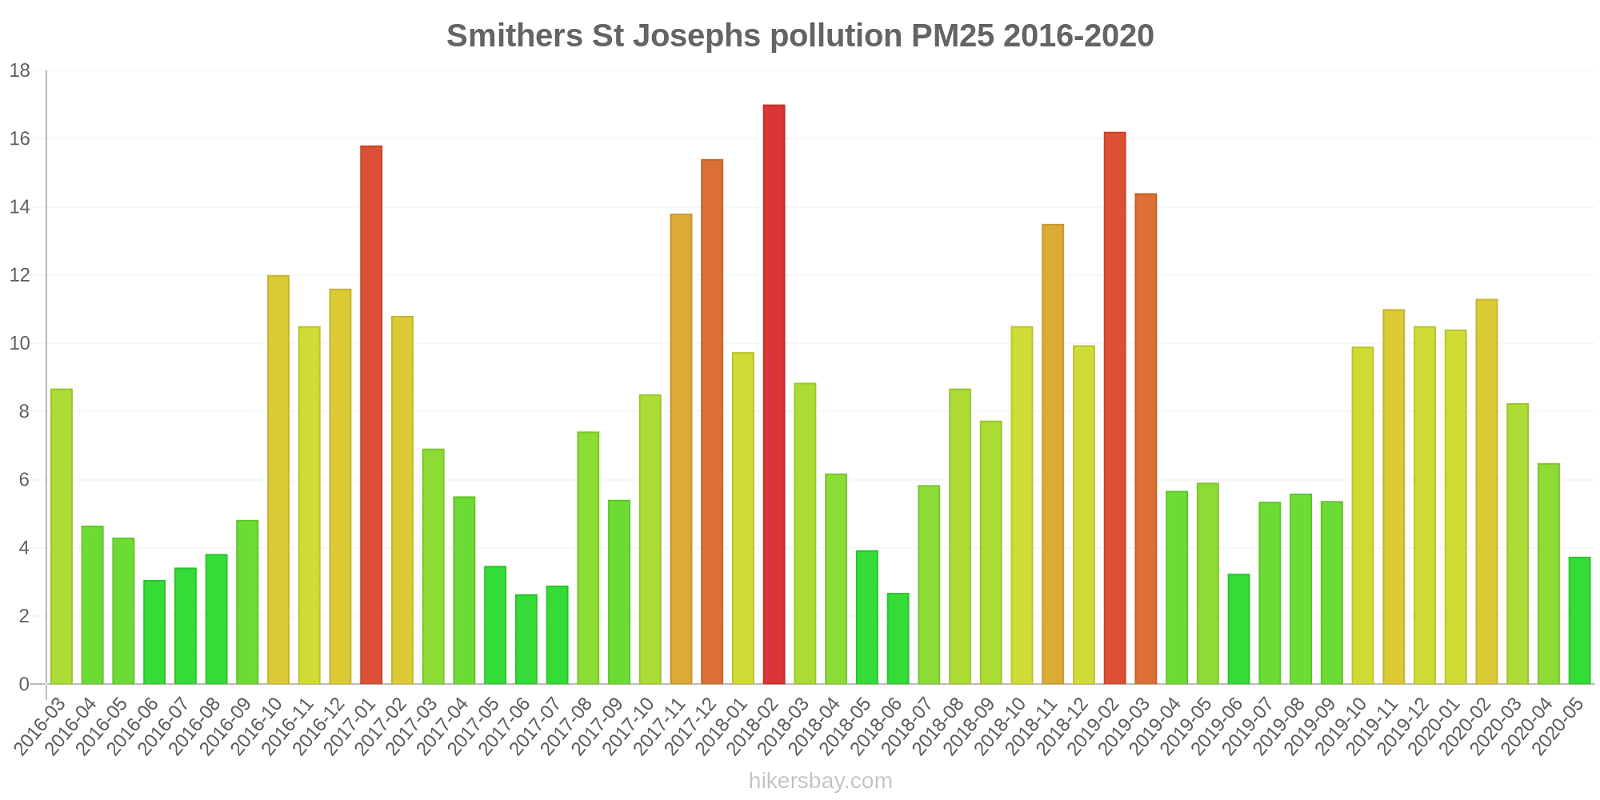
Smithers St Josephs
Jumat, 27 Mei 2022 15.00
PM2,5 32 (Moderat)
partikulat Matter (PM 2.5) debu
NO2 0.02 (Bagus)
nitrogen dioksida (NO2)
O3 0.03 (Bagus)
ozon (O3)
SO2 0 (Bagus)
sulfur dioksida (SO2)
PM10 25 (Moderat)
partikulat Matter (PM10) debu tersuspensi
CO 100 (Bagus)
karbon monoksida (CO)
Smithers St Josephs
index
2022-05-27
pm25
11
no2
8.2
o3
9.3
so2
8.4
pm10
30
co
11
Houston Firehall
index
2018-05
2018-04
2018-03
2018-02
2018-01
2017-12
2017-11
2017-10
2017-09
2017-08
2017-07
2017-06
2017-05
2017-04
2017-03
2017-02
2017-01
2016-12
2016-11
2016-10
2016-09
2016-08
2016-07
2016-06
2016-05
2016-04
2016-03
pm10
53
45
18
9.8
10
11
12
15
14
19
15
13
13
19
19
16
11
11
11
13
11
12
12
12
11
12
21
Smithers St Josephs
2016-03 2020-05
index
2020-05
2020-04
2020-03
2020-02
2020-01
2019-12
2019-11
2019-10
2019-09
2019-08
2019-07
2019-06
2019-05
2019-04
2019-03
2019-02
2018-12
2018-11
2018-10
2018-09
2018-08
2018-07
2018-06
2018-05
2018-04
2018-03
2018-02
2018-01
2017-12
2017-11
2017-10
2017-09
2017-08
2017-07
2017-06
2017-05
2017-04
2017-03
2017-02
2017-01
2016-12
2016-11
2016-10
2016-09
2016-08
2016-07
2016-06
2016-05
2016-04
2016-03
no2:ppm
0
0
0.01
0.01
0.01
0.01
0.01
0
0
0
0
0
0
0
0.01
0.01
0
0.01
0.01
0
0
0
0
0
0
0.01
0.02
0.01
0.01
0.01
0
0
0
0
0
0
0.01
0.01
0.01
0.01
0.01
0.01
0
0
0
0
0
0
0
0.01
o3:ppm
0.02
0.02
0.02
0.01
0.02
0.01
0.01
0.01
0.01
0.01
0.01
0.02
0.02
0.03
0.02
0.01
0.01
0.01
0.01
0.01
0.02
0.02
0.02
0.03
0.03
0.03
0.01
0.01
0.01
0.01
0.01
0.01
0.02
0.02
0.02
0.03
0.03
0.03
0.02
0.01
0.01
0.01
0.01
0.01
0.01
0.01
0.02
0.02
0.02
0.02
pm25
3.7
6.5
8.2
11
10
11
11
9.9
5.4
5.6
5.3
3.2
5.9
5.7
14
16
9.9
14
11
7.7
8.7
5.8
2.7
3.9
6.2
8.8
17
9.7
15
14
8.5
5.4
7.4
2.9
2.6
3.5
5.5
6.9
11
16
12
11
12
4.8
3.8
3.4
3.1
4.3
4.7
8.7
Vanderhoof BAM
index
2020-04
2019-10
2019-09
2019-08
2019-06
2019-01
pm25
6.9
10
6.3
6
1.6
7.6
* Pollution data source:
https://openaq.org
(AirNow)
The data is licensed under CC-By 4.0
PM2,5 32 (Moderat)
NO2 0 (Bagus)
O3 0 (Bagus)
SO2 0 (Bagus)
PM10 25 (Moderat)
CO 100 (Bagus)
Data tentang polusi udara dari beberapa hari terakhir di Regional District of Bulkley-Nechako
| index | 2022-05-27 |
|---|---|
| pm25 | 11 Good |
| no2 | 8 Good |
| o3 | 9 Good |
| so2 | 8 Good |
| pm10 | 30 Moderate |
| co | 11 Good |
| index | 2018-05 | 2018-04 | 2018-03 | 2018-02 | 2018-01 | 2017-12 | 2017-11 | 2017-10 | 2017-09 | 2017-08 | 2017-07 | 2017-06 | 2017-05 | 2017-04 | 2017-03 | 2017-02 | 2017-01 | 2016-12 | 2016-11 | 2016-10 | 2016-09 | 2016-08 | 2016-07 | 2016-06 | 2016-05 | 2016-04 | 2016-03 | 2020-05 | 2020-04 | 2020-03 | 2020-02 | 2020-01 | 2019-12 | 2019-11 | 2019-10 | 2019-09 | 2019-08 | 2019-07 | 2019-06 | 2019-05 | 2019-04 | 2019-03 | 2019-02 | 2018-12 | 2018-11 | 2018-10 | 2018-09 | 2018-08 | 2018-07 | 2018-06 | 2019-01 |
|---|---|---|---|---|---|---|---|---|---|---|---|---|---|---|---|---|---|---|---|---|---|---|---|---|---|---|---|---|---|---|---|---|---|---|---|---|---|---|---|---|---|---|---|---|---|---|---|---|---|---|---|
| pm10 | 53 (Unhealthy for Sensitive Groups) | 45 (Moderate) | 18 (Good) | 9.8 (Good) | 10 (Good) | 11 (Good) | 12 (Good) | 15 (Good) | 14 (Good) | 19 (Good) | 15 (Good) | 13 (Good) | 13 (Good) | 19 (Good) | 19 (Good) | 16 (Good) | 11 (Good) | 11 (Good) | 11 (Good) | 13 (Good) | 11 (Good) | 12 (Good) | 12 (Good) | 12 (Good) | 11 (Good) | 12 (Good) | 21 (Moderate) | - (Good) | - (Good) | - (Good) | - (Good) | - (Good) | - (Good) | - (Good) | - (Good) | - (Good) | - (Good) | - (Good) | - (Good) | - (Good) | - (Good) | - (Good) | - (Good) | - (Good) | - (Good) | - (Good) | - (Good) | - (Good) | - (Good) | - (Good) | - (Good) |
| no2:ppm | 0 (Good) | 0 (Good) | 0.01 (Good) | 0.02 (Good) | 0.01 (Good) | 0.01 (Good) | 0.01 (Good) | 0 (Good) | 0 (Good) | 0 (Good) | 0 (Good) | 0 (Good) | 0 (Good) | 0.01 (Good) | 0.01 (Good) | 0.01 (Good) | 0.01 (Good) | 0.01 (Good) | 0.01 (Good) | 0 (Good) | 0 (Good) | 0 (Good) | 0 (Good) | 0 (Good) | 0 (Good) | 0 (Good) | 0.01 (Good) | 0 (Good) | 0 (Good) | 0.01 (Good) | 0.01 (Good) | 0.01 (Good) | 0.01 (Good) | 0.01 (Good) | 0 (Good) | 0 (Good) | 0 (Good) | 0 (Good) | 0 (Good) | 0 (Good) | 0 (Good) | 0.01 (Good) | 0.01 (Good) | 0 (Good) | 0.01 (Good) | 0.01 (Good) | 0 (Good) | 0 (Good) | 0 (Good) | 0 (Good) | - (Good) |
| o3:ppm | 0.03 (Good) | 0.03 (Good) | 0.03 (Good) | 0.01 (Good) | 0.01 (Good) | 0.01 (Good) | 0.01 (Good) | 0.01 (Good) | 0.01 (Good) | 0.02 (Good) | 0.02 (Good) | 0.02 (Good) | 0.03 (Good) | 0.03 (Good) | 0.03 (Good) | 0.02 (Good) | 0.01 (Good) | 0.01 (Good) | 0.01 (Good) | 0.01 (Good) | 0.01 (Good) | 0.01 (Good) | 0.01 (Good) | 0.02 (Good) | 0.02 (Good) | 0.02 (Good) | 0.02 (Good) | 0.02 (Good) | 0.02 (Good) | 0.02 (Good) | 0.01 (Good) | 0.02 (Good) | 0.01 (Good) | 0.01 (Good) | 0.01 (Good) | 0.01 (Good) | 0.01 (Good) | 0.01 (Good) | 0.02 (Good) | 0.02 (Good) | 0.03 (Good) | 0.02 (Good) | 0.01 (Good) | 0.01 (Good) | 0.01 (Good) | 0.01 (Good) | 0.01 (Good) | 0.02 (Good) | 0.02 (Good) | 0.02 (Good) | - (Good) |
| pm25 | 3.9 (Good) | 6.2 (Good) | 8.8 (Good) | 17 (Moderate) | 9.7 (Good) | 15 (Moderate) | 14 (Moderate) | 8.5 (Good) | 5.4 (Good) | 7.4 (Good) | 2.9 (Good) | 2.6 (Good) | 3.5 (Good) | 5.5 (Good) | 6.9 (Good) | 11 (Good) | 16 (Moderate) | 12 (Good) | 11 (Good) | 12 (Good) | 4.8 (Good) | 3.8 (Good) | 3.4 (Good) | 3.1 (Good) | 4.3 (Good) | 4.7 (Good) | 8.7 (Good) | 3.7 (Good) | 6.7 (Good) | 8.2 (Good) | 11 (Good) | 10 (Good) | 11 (Good) | 11 (Good) | 10 (Good) | 5.8 (Good) | 5.8 (Good) | 5.3 (Good) | 2.4 (Good) | 5.9 (Good) | 5.7 (Good) | 14 (Moderate) | 16 (Moderate) | 9.9 (Good) | 14 (Moderate) | 11 (Good) | 7.7 (Good) | 8.7 (Good) | 5.8 (Good) | 2.7 (Good) | 7.6 (Good) |
Hijau dan taman di kota
Regional District of Bulkley-Nechako 61%
Amerika Serikat: 70% Venezuela: 41% Islandia: 72%partikulat Matter PM 2.5
Regional District of Bulkley-Nechako 12 (Good)
Kenikmatan menghabiskan waktu di kota
Regional District of Bulkley-Nechako 59%
Amerika Serikat: 75% Bahama: 53% Venezuela: 41% Islandia: 89%partikulat Matter PM10
Regional District of Bulkley-Nechako 25 (Moderate)
Polusi udara
Regional District of Bulkley-Nechako 55%
Amerika Serikat: 29% Bahama: 52% Venezuela: 59% Islandia: 13%Pembuangan sampah
Regional District of Bulkley-Nechako 71%
Amerika Serikat: 71% Bahama: 29% Venezuela: 18% Islandia: 79%Ketersediaan dan kualitas air minum
Regional District of Bulkley-Nechako 63%
Amerika Serikat: 71% Bahama: 55% Venezuela: 28% Islandia: 96%Kebersihan dan kerasnya
Regional District of Bulkley-Nechako 53%
Amerika Serikat: 60% Bahama: 35% Venezuela: 22% Islandia: 75%Kebisingan dan polusi cahaya
Regional District of Bulkley-Nechako 56%
Amerika Serikat: 47% Bahama: 39% Venezuela: 47% Islandia: 23%Polusi air
Regional District of Bulkley-Nechako 57%
Amerika Serikat: 44% Bahama: 58% Venezuela: 76% Islandia: 8,4%PM2,5 32 (Moderat)
partikulat Matter (PM 2.5) debuNO2 0.02 (Bagus)
nitrogen dioksida (NO2)O3 0.03 (Bagus)
ozon (O3)SO2 0 (Bagus)
sulfur dioksida (SO2)PM10 25 (Moderat)
partikulat Matter (PM10) debu tersuspensiCO 100 (Bagus)
karbon monoksida (CO)Smithers St Josephs
| index | 2022-05-27 |
|---|---|
| pm25 | 11 |
| no2 | 8.2 |
| o3 | 9.3 |
| so2 | 8.4 |
| pm10 | 30 |
| co | 11 |
Houston Firehall
| index | 2018-05 | 2018-04 | 2018-03 | 2018-02 | 2018-01 | 2017-12 | 2017-11 | 2017-10 | 2017-09 | 2017-08 | 2017-07 | 2017-06 | 2017-05 | 2017-04 | 2017-03 | 2017-02 | 2017-01 | 2016-12 | 2016-11 | 2016-10 | 2016-09 | 2016-08 | 2016-07 | 2016-06 | 2016-05 | 2016-04 | 2016-03 |
|---|---|---|---|---|---|---|---|---|---|---|---|---|---|---|---|---|---|---|---|---|---|---|---|---|---|---|---|
| pm10 | 53 | 45 | 18 | 9.8 | 10 | 11 | 12 | 15 | 14 | 19 | 15 | 13 | 13 | 19 | 19 | 16 | 11 | 11 | 11 | 13 | 11 | 12 | 12 | 12 | 11 | 12 | 21 |
Smithers St Josephs

| index | 2020-05 | 2020-04 | 2020-03 | 2020-02 | 2020-01 | 2019-12 | 2019-11 | 2019-10 | 2019-09 | 2019-08 | 2019-07 | 2019-06 | 2019-05 | 2019-04 | 2019-03 | 2019-02 | 2018-12 | 2018-11 | 2018-10 | 2018-09 | 2018-08 | 2018-07 | 2018-06 | 2018-05 | 2018-04 | 2018-03 | 2018-02 | 2018-01 | 2017-12 | 2017-11 | 2017-10 | 2017-09 | 2017-08 | 2017-07 | 2017-06 | 2017-05 | 2017-04 | 2017-03 | 2017-02 | 2017-01 | 2016-12 | 2016-11 | 2016-10 | 2016-09 | 2016-08 | 2016-07 | 2016-06 | 2016-05 | 2016-04 | 2016-03 |
|---|---|---|---|---|---|---|---|---|---|---|---|---|---|---|---|---|---|---|---|---|---|---|---|---|---|---|---|---|---|---|---|---|---|---|---|---|---|---|---|---|---|---|---|---|---|---|---|---|---|---|
| no2:ppm | 0 | 0 | 0.01 | 0.01 | 0.01 | 0.01 | 0.01 | 0 | 0 | 0 | 0 | 0 | 0 | 0 | 0.01 | 0.01 | 0 | 0.01 | 0.01 | 0 | 0 | 0 | 0 | 0 | 0 | 0.01 | 0.02 | 0.01 | 0.01 | 0.01 | 0 | 0 | 0 | 0 | 0 | 0 | 0.01 | 0.01 | 0.01 | 0.01 | 0.01 | 0.01 | 0 | 0 | 0 | 0 | 0 | 0 | 0 | 0.01 |
| o3:ppm | 0.02 | 0.02 | 0.02 | 0.01 | 0.02 | 0.01 | 0.01 | 0.01 | 0.01 | 0.01 | 0.01 | 0.02 | 0.02 | 0.03 | 0.02 | 0.01 | 0.01 | 0.01 | 0.01 | 0.01 | 0.02 | 0.02 | 0.02 | 0.03 | 0.03 | 0.03 | 0.01 | 0.01 | 0.01 | 0.01 | 0.01 | 0.01 | 0.02 | 0.02 | 0.02 | 0.03 | 0.03 | 0.03 | 0.02 | 0.01 | 0.01 | 0.01 | 0.01 | 0.01 | 0.01 | 0.01 | 0.02 | 0.02 | 0.02 | 0.02 |
| pm25 | 3.7 | 6.5 | 8.2 | 11 | 10 | 11 | 11 | 9.9 | 5.4 | 5.6 | 5.3 | 3.2 | 5.9 | 5.7 | 14 | 16 | 9.9 | 14 | 11 | 7.7 | 8.7 | 5.8 | 2.7 | 3.9 | 6.2 | 8.8 | 17 | 9.7 | 15 | 14 | 8.5 | 5.4 | 7.4 | 2.9 | 2.6 | 3.5 | 5.5 | 6.9 | 11 | 16 | 12 | 11 | 12 | 4.8 | 3.8 | 3.4 | 3.1 | 4.3 | 4.7 | 8.7 |
Vanderhoof BAM
| index | 2020-04 | 2019-10 | 2019-09 | 2019-08 | 2019-06 | 2019-01 |
|---|---|---|---|---|---|---|
| pm25 | 6.9 | 10 | 6.3 | 6 | 1.6 | 7.6 |