Polusi udara di Plage-Chartrand: indeks kualitas udara real-time dan siaga asap.
Perkiraan kualitas polusi dan udara untuk Plage-Chartrand. Hari ini Selasa, 16 Juni 2026. Nilai polusi udara berikut telah tercatat untuk Plage-Chartrand:- ozon (O3) - 0 (Bagus)
- karbon monoksida (CO) - 1 (Bagus)
- nitrogen dioksida (NO2) - 0 (Bagus)
- partikulat Matter (PM 2.5) debu - 39 (Tidak sehat untuk kelompok sensitif)

Apa kualitas udara di Plage-Chartrand hari ini? Apakah udara tercemar di Plage-Chartrand?. Apakah ada Smog?
Bagaimana tingkat O3 hari ini di Plage-Chartrand? (ozon (O3))
0 (Bagus)
Seberapa tinggi tingkat CO? (karbon monoksida (CO))
1 (Bagus)
Seberapa tinggi tingkat NO2? (nitrogen dioksida (NO2))
0 (Bagus)
Apa tingkat saat PM 2,5 in Plage-Chartrand? (partikulat Matter (PM 2.5) debu)
Hari ini PM 2.5 tingkat:
39 (Tidak sehat untuk kelompok sensitif)
Sebagai perbandingan, tingkat tertinggi PM 2,5 in Plage-Chartrand dalam 7 hari terakhir adalah: 40 (Sabtu, 1 Juli 2023) dan Terendah: 5 (Sabtu, 8 Juli 2023).
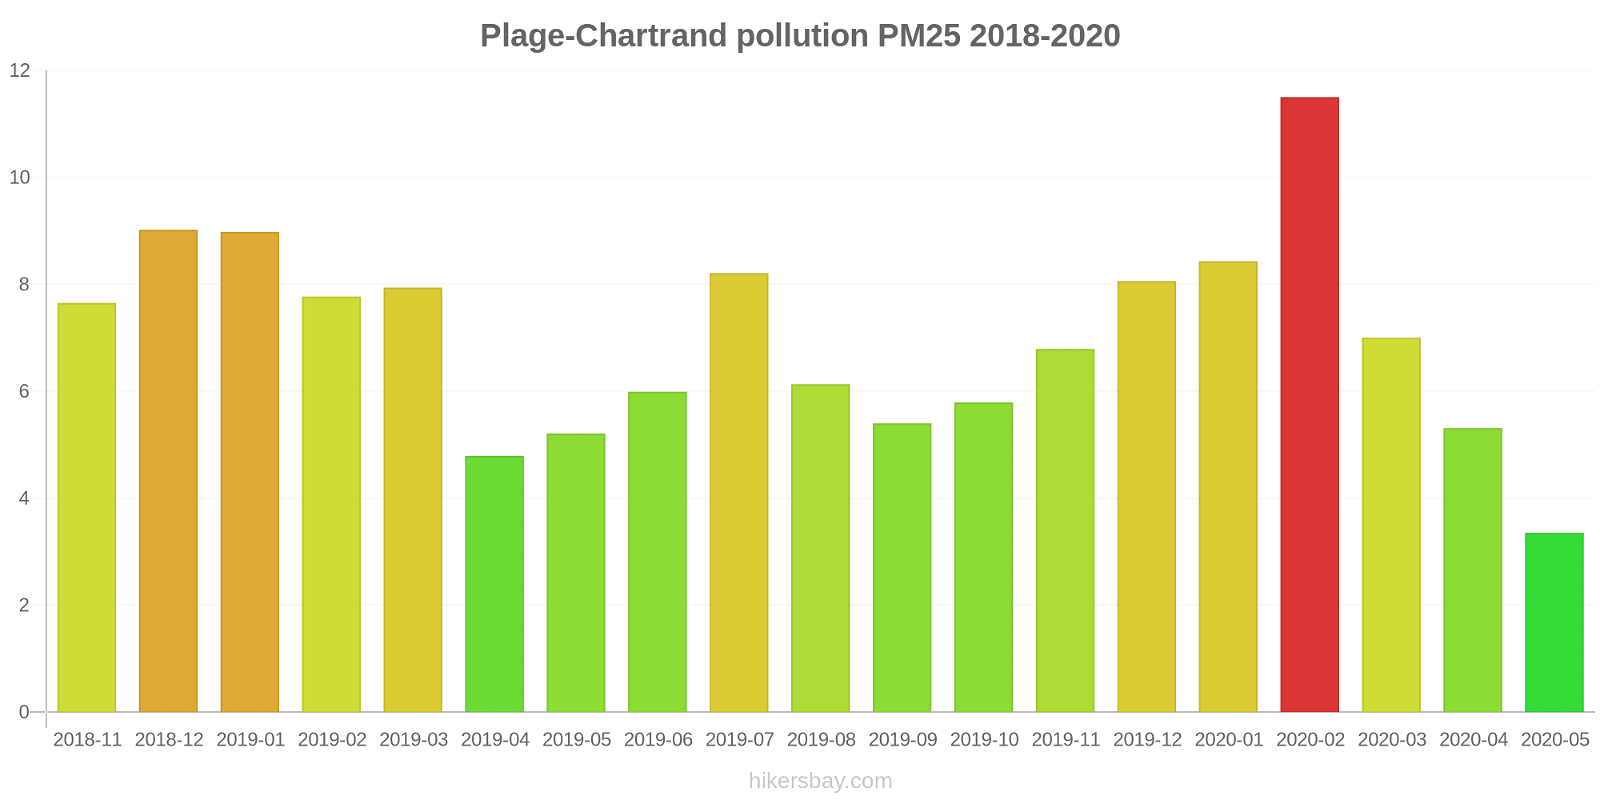
Nilai tertinggi PM 2.5 direkam: 12 (Februari 2020).
Tingkat terendah dari partikulat Matter PM 2.5 polusi terjadi di bulan: Mei (3.4).
Data saat ini Sabtu, 1 Juli 2023 22.00
O3 0 (Bagus)
CO 1 (Bagus)
NO2 0 (Bagus)
PM2,5 39 (Tidak sehat untuk kelompok sensitif)
Data tentang polusi udara dari beberapa hari terakhir di Plage-Chartrand
index
2023-07-05
2023-07-07
2023-07-03
2023-07-04
2023-07-08
2023-07-02
2023-07-06
2023-07-01
o3
0
Good
0
Good
0
Good
0
Good
0
Good
0
Good
0
Good
0
Good
co
0
Good
0
Good
0
Good
0
Good
0
Good
0
Good
0
Good
1
Good
no2
0
Good
0
Good
0
Good
0
Good
0
Good
0
Good
0
Good
0
Good
pm25
11
Good
8
Good
12
Good
16
Moderate
5
Good
21
Moderate
12
Good
40
Unhealthy for Sensitive Groups
data source »
Polusi udara di Plage-Chartrand dari November 2018 ke Mei 2020
index
2020-05
2020-04
2020-03
2020-02
2020-01
2019-12
2019-11
2019-10
2019-09
2019-08
2019-07
2019-06
2019-05
2019-04
2019-03
2019-02
2019-01
2018-12
2018-11
co:ppm
0.15 (Good)
0.17 (Good)
0.2 (Good)
0.24 (Good)
0.23 (Good)
0.2 (Good)
0.18 (Good)
0.18 (Good)
0.17 (Good)
0.16 (Good)
0.17 (Good)
0.16 (Good)
0.16 (Good)
0.18 (Good)
0.22 (Good)
0.22 (Good)
0.23 (Good)
0.22 (Good)
0.28 (Good)
no2:ppm
0 (Good)
0 (Good)
0.01 (Good)
0.01 (Good)
0.01 (Good)
0.01 (Good)
0.01 (Good)
0.01 (Good)
0.01 (Good)
0 (Good)
0 (Good)
0 (Good)
0 (Good)
0 (Good)
0.01 (Good)
0.01 (Good)
0.01 (Good)
0.01 (Good)
0.01 (Good)
o3:ppm
0.03 (Good)
0.03 (Good)
0.03 (Good)
0.03 (Good)
0.02 (Good)
0.02 (Good)
0.02 (Good)
0.02 (Good)
0.02 (Good)
0.02 (Good)
0.03 (Good)
0.03 (Good)
0.03 (Good)
0.03 (Good)
0.04 (Good)
0.03 (Good)
0.03 (Good)
0.02 (Good)
0.02 (Good)
pm25
3.4 (Good)
5.3 (Good)
7 (Good)
12 (Good)
8.4 (Good)
8.1 (Good)
6.8 (Good)
5.8 (Good)
5.4 (Good)
6.1 (Good)
8.2 (Good)
6 (Good)
5.2 (Good)
4.8 (Good)
7.9 (Good)
7.8 (Good)
9 (Good)
9 (Good)
7.7 (Good)
data source »
Rivi��re-des-Prairies
Sabtu, 1 Juli 2023 22.00
O3 0.04 (Bagus)
ozon (O3)
CO 0.6 (Bagus)
karbon monoksida (CO)
NO2 0.01 (Bagus)
nitrogen dioksida (NO2)
PM2,5 39 (Tidak sehat untuk kelompok sensitif)
partikulat Matter (PM 2.5) debu
Rivi��re-des-Prairies
index
2023-07-01
2023-07-06
2023-07-02
2023-07-08
2023-07-04
2023-07-03
2023-07-07
2023-07-05
o3
0.03
0.04
0.04
0.02
0.03
0.03
0.04
0.03
co
0.56
0.25
0.49
0.19
0.4
0.47
0.19
0.38
no2
0.01
0
0
0.01
0.01
0
0.01
0.01
pm25
40
12
21
4.6
16
12
7.9
11
Rivière-des-Prairies
2018-11 2020-05

index
2020-05
2020-04
2020-03
2020-02
2020-01
2019-12
2019-11
2019-10
2019-09
2019-08
2019-07
2019-06
2019-05
2019-04
2019-03
2019-02
2019-01
2018-12
2018-11
co:ppm
0.15
0.17
0.2
0.24
0.23
0.2
0.18
0.18
0.17
0.16
0.17
0.16
0.16
0.18
0.22
0.22
0.23
0.22
0.28
no2:ppm
0
0
0.01
0.01
0.01
0.01
0.01
0.01
0.01
0
0
0
0
0
0.01
0.01
0.01
0.01
0.01
o3:ppm
0.03
0.03
0.03
0.03
0.02
0.02
0.02
0.02
0.02
0.02
0.03
0.03
0.03
0.03
0.04
0.03
0.03
0.02
0.02
pm25
3.4
5.3
7
12
8.4
8.1
6.8
5.8
5.4
6.1
8.2
6
5.2
4.8
7.9
7.8
9
9
7.7
* Pollution data source:
https://openaq.org
(AirNow)
The data is licensed under CC-By 4.0
O3 0 (Bagus)
CO 1 (Bagus)
NO2 0 (Bagus)
PM2,5 39 (Tidak sehat untuk kelompok sensitif)
Data tentang polusi udara dari beberapa hari terakhir di Plage-Chartrand
| index | 2023-07-05 | 2023-07-07 | 2023-07-03 | 2023-07-04 | 2023-07-08 | 2023-07-02 | 2023-07-06 | 2023-07-01 |
|---|---|---|---|---|---|---|---|---|
| o3 | 0 Good |
0 Good |
0 Good |
0 Good |
0 Good |
0 Good |
0 Good |
0 Good |
| co | 0 Good |
0 Good |
0 Good |
0 Good |
0 Good |
0 Good |
0 Good |
1 Good |
| no2 | 0 Good |
0 Good |
0 Good |
0 Good |
0 Good |
0 Good |
0 Good |
0 Good |
| pm25 | 11 Good |
8 Good |
12 Good |
16 Moderate |
5 Good |
21 Moderate |
12 Good |
40 Unhealthy for Sensitive Groups |

| index | 2020-05 | 2020-04 | 2020-03 | 2020-02 | 2020-01 | 2019-12 | 2019-11 | 2019-10 | 2019-09 | 2019-08 | 2019-07 | 2019-06 | 2019-05 | 2019-04 | 2019-03 | 2019-02 | 2019-01 | 2018-12 | 2018-11 |
|---|---|---|---|---|---|---|---|---|---|---|---|---|---|---|---|---|---|---|---|
| co:ppm | 0.15 (Good) | 0.17 (Good) | 0.2 (Good) | 0.24 (Good) | 0.23 (Good) | 0.2 (Good) | 0.18 (Good) | 0.18 (Good) | 0.17 (Good) | 0.16 (Good) | 0.17 (Good) | 0.16 (Good) | 0.16 (Good) | 0.18 (Good) | 0.22 (Good) | 0.22 (Good) | 0.23 (Good) | 0.22 (Good) | 0.28 (Good) |
| no2:ppm | 0 (Good) | 0 (Good) | 0.01 (Good) | 0.01 (Good) | 0.01 (Good) | 0.01 (Good) | 0.01 (Good) | 0.01 (Good) | 0.01 (Good) | 0 (Good) | 0 (Good) | 0 (Good) | 0 (Good) | 0 (Good) | 0.01 (Good) | 0.01 (Good) | 0.01 (Good) | 0.01 (Good) | 0.01 (Good) |
| o3:ppm | 0.03 (Good) | 0.03 (Good) | 0.03 (Good) | 0.03 (Good) | 0.02 (Good) | 0.02 (Good) | 0.02 (Good) | 0.02 (Good) | 0.02 (Good) | 0.02 (Good) | 0.03 (Good) | 0.03 (Good) | 0.03 (Good) | 0.03 (Good) | 0.04 (Good) | 0.03 (Good) | 0.03 (Good) | 0.02 (Good) | 0.02 (Good) |
| pm25 | 3.4 (Good) | 5.3 (Good) | 7 (Good) | 12 (Good) | 8.4 (Good) | 8.1 (Good) | 6.8 (Good) | 5.8 (Good) | 5.4 (Good) | 6.1 (Good) | 8.2 (Good) | 6 (Good) | 5.2 (Good) | 4.8 (Good) | 7.9 (Good) | 7.8 (Good) | 9 (Good) | 9 (Good) | 7.7 (Good) |
O3 0.04 (Bagus)
ozon (O3)CO 0.6 (Bagus)
karbon monoksida (CO)NO2 0.01 (Bagus)
nitrogen dioksida (NO2)PM2,5 39 (Tidak sehat untuk kelompok sensitif)
partikulat Matter (PM 2.5) debuRivi��re-des-Prairies
| index | 2023-07-01 | 2023-07-06 | 2023-07-02 | 2023-07-08 | 2023-07-04 | 2023-07-03 | 2023-07-07 | 2023-07-05 |
|---|---|---|---|---|---|---|---|---|
| o3 | 0.03 | 0.04 | 0.04 | 0.02 | 0.03 | 0.03 | 0.04 | 0.03 |
| co | 0.56 | 0.25 | 0.49 | 0.19 | 0.4 | 0.47 | 0.19 | 0.38 |
| no2 | 0.01 | 0 | 0 | 0.01 | 0.01 | 0 | 0.01 | 0.01 |
| pm25 | 40 | 12 | 21 | 4.6 | 16 | 12 | 7.9 | 11 |
Rivière-des-Prairies
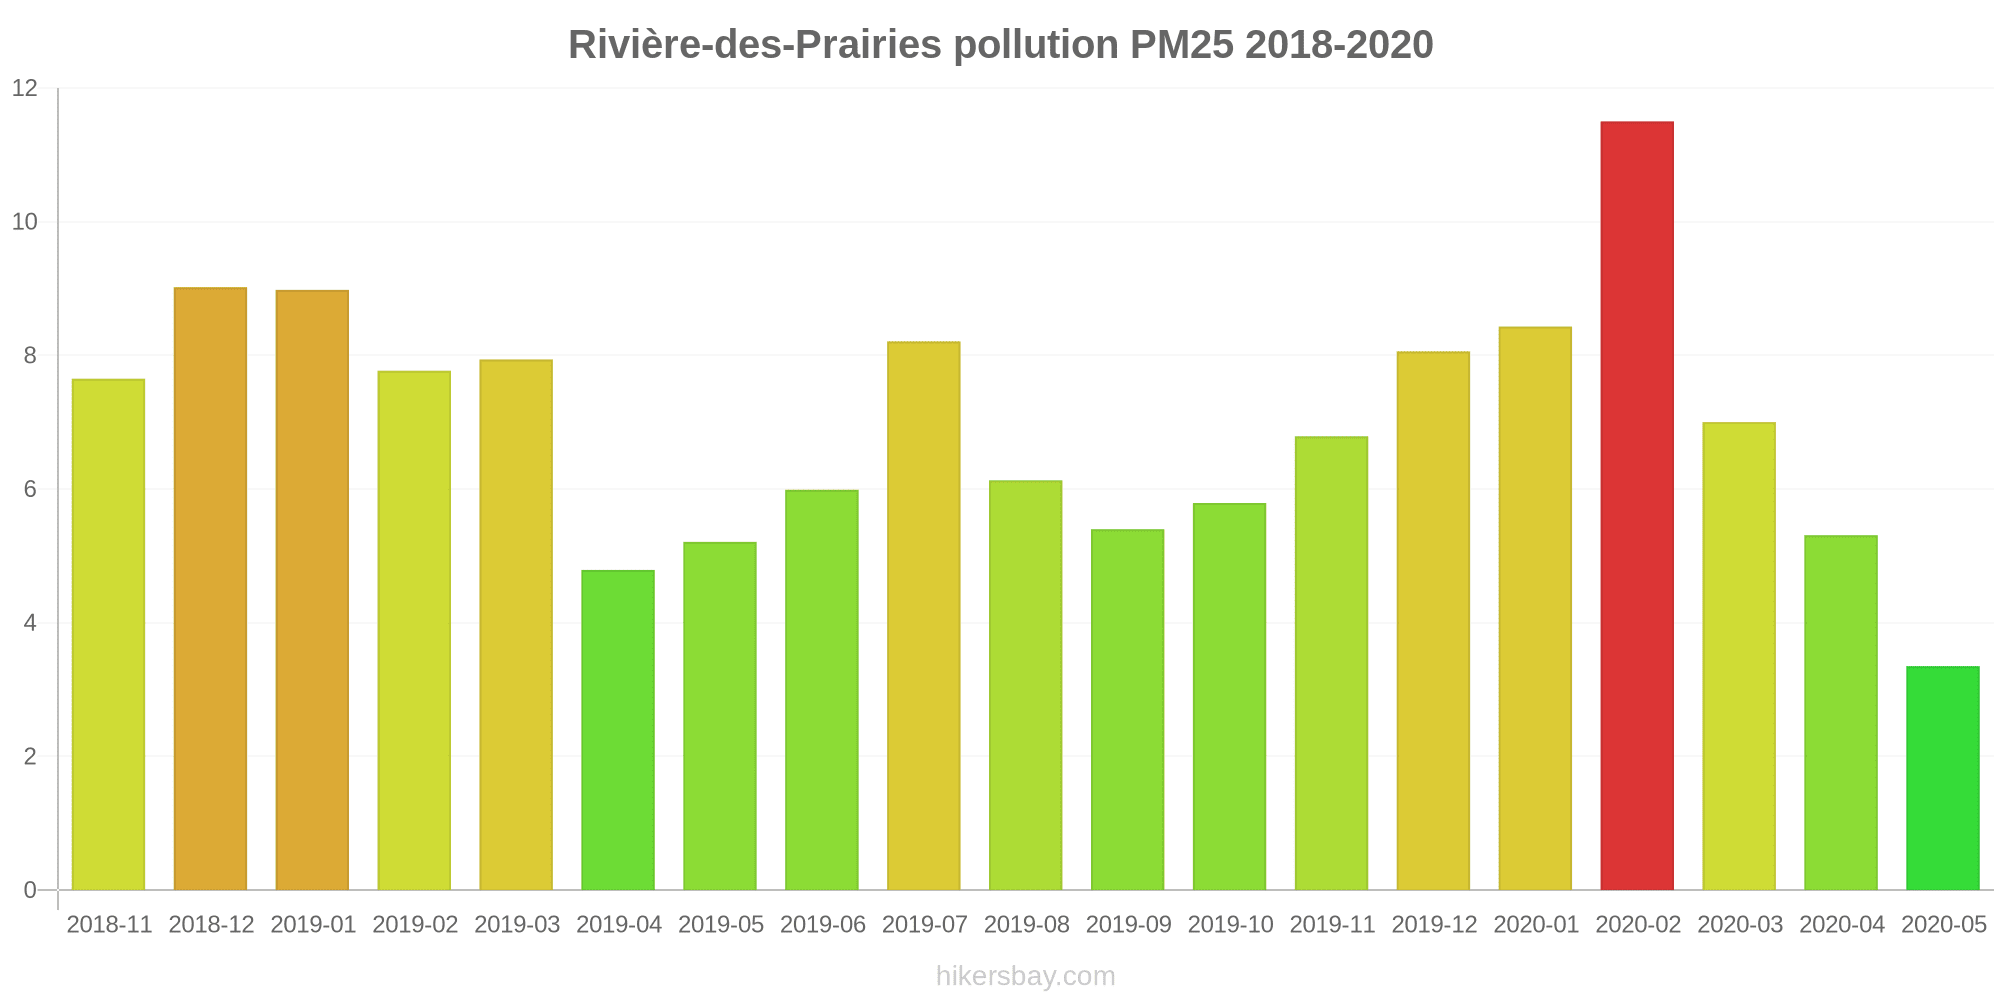
| index | 2020-05 | 2020-04 | 2020-03 | 2020-02 | 2020-01 | 2019-12 | 2019-11 | 2019-10 | 2019-09 | 2019-08 | 2019-07 | 2019-06 | 2019-05 | 2019-04 | 2019-03 | 2019-02 | 2019-01 | 2018-12 | 2018-11 |
|---|---|---|---|---|---|---|---|---|---|---|---|---|---|---|---|---|---|---|---|
| co:ppm | 0.15 | 0.17 | 0.2 | 0.24 | 0.23 | 0.2 | 0.18 | 0.18 | 0.17 | 0.16 | 0.17 | 0.16 | 0.16 | 0.18 | 0.22 | 0.22 | 0.23 | 0.22 | 0.28 |
| no2:ppm | 0 | 0 | 0.01 | 0.01 | 0.01 | 0.01 | 0.01 | 0.01 | 0.01 | 0 | 0 | 0 | 0 | 0 | 0.01 | 0.01 | 0.01 | 0.01 | 0.01 |
| o3:ppm | 0.03 | 0.03 | 0.03 | 0.03 | 0.02 | 0.02 | 0.02 | 0.02 | 0.02 | 0.02 | 0.03 | 0.03 | 0.03 | 0.03 | 0.04 | 0.03 | 0.03 | 0.02 | 0.02 |
| pm25 | 3.4 | 5.3 | 7 | 12 | 8.4 | 8.1 | 6.8 | 5.8 | 5.4 | 6.1 | 8.2 | 6 | 5.2 | 4.8 | 7.9 | 7.8 | 9 | 9 | 7.7 |