Polusi udara di North Red Deer: indeks kualitas udara real-time dan siaga asap.
Perkiraan kualitas polusi dan udara untuk North Red Deer. Hari ini Rabu, 17 Juni 2026. Nilai polusi udara berikut telah tercatat untuk North Red Deer:- partikulat Matter (PM 2.5) debu - 4 (Bagus)
- ozon (O3) - 0 (Bagus)

Apa kualitas udara di North Red Deer hari ini? Apakah udara tercemar di North Red Deer?. Apakah ada Smog?
Apa tingkat saat PM 2,5 in North Red Deer? (partikulat Matter (PM 2.5) debu)
Hari ini PM 2.5 tingkat:
4 (Bagus)
Sebagai perbandingan, tingkat tertinggi PM 2,5 in North Red Deer dalam 7 hari terakhir adalah: 7 (Senin, 15 April 2024) dan Terendah: 2 (Rabu, 10 April 2024).
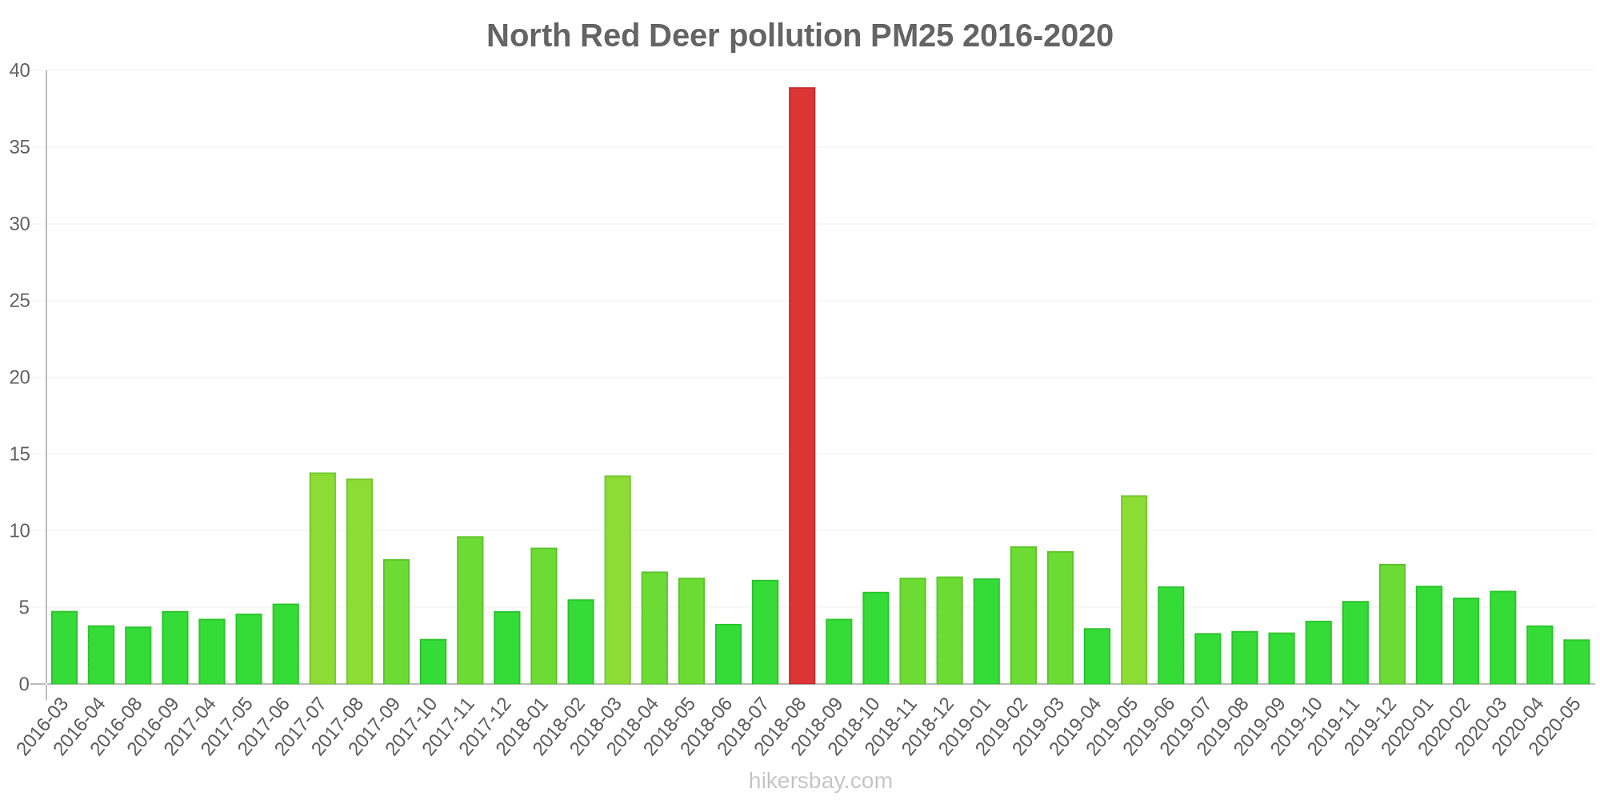
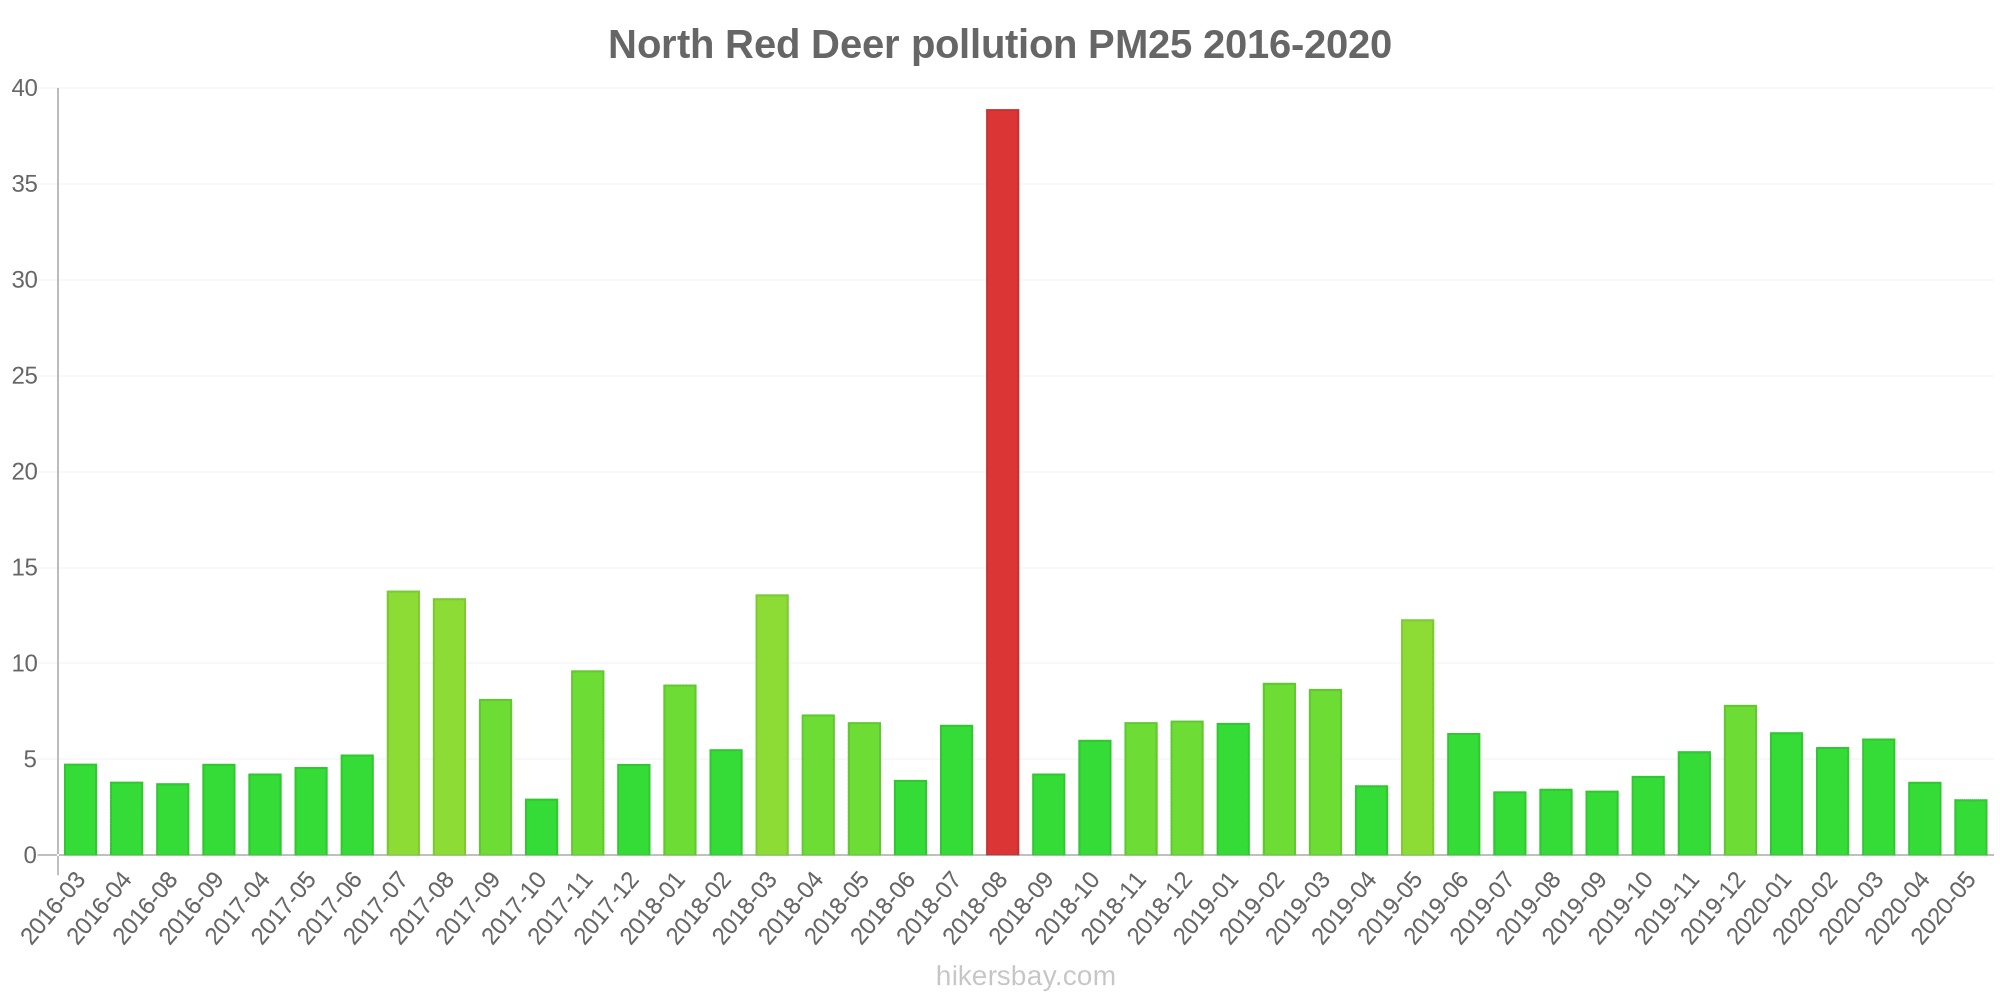
Nilai tertinggi PM 2.5 direkam: 39 (Agustus 2018).
Tingkat terendah dari partikulat Matter PM 2.5 polusi terjadi di bulan: Mei (2.9).
Bagaimana tingkat O3 hari ini di North Red Deer? (ozon (O3))
0 (Bagus)
Data saat ini Selasa, 16 April 2024 10.00
PM2,5 4 (Bagus)
O3 0 (Bagus)
Data tentang polusi udara dari beberapa hari terakhir di North Red Deer
index
2024-04-09
2024-04-10
2024-04-11
2024-04-12
2024-04-13
2024-04-14
2024-04-15
2024-04-16
pm25
6
Good
2
Good
5
Good
4
Good
5
Good
5
Good
7
Good
5
Good
o3
0
Good
0
Good
0
Good
0
Good
0
Good
0
Good
0
Good
0
Good
data source »
Polusi udara di North Red Deer dari Maret 2016 ke Mei 2020
index
2020-05
2020-04
2020-03
2020-02
2020-01
2019-12
2019-11
2019-10
2019-09
2019-08
2019-07
2019-06
2019-05
2019-04
2019-03
2019-02
2019-01
2018-12
2018-11
2018-10
2018-09
2018-08
2018-07
2018-06
2018-05
2018-04
2018-03
2018-02
2018-01
2017-12
2017-11
2017-10
2017-09
2017-08
2017-07
2017-06
2017-05
2017-04
2016-09
2016-08
2016-04
2016-03
o3:ppm
0.04 (Good)
0.04 (Good)
0.03 (Good)
0.02 (Good)
0.02 (Good)
0.01 (Good)
0.02 (Good)
0.02 (Good)
0.02 (Good)
0.02 (Good)
0.02 (Good)
0.03 (Good)
0.04 (Good)
0.04 (Good)
0.03 (Good)
0.02 (Good)
0.02 (Good)
0.02 (Good)
0.01 (Good)
0.02 (Good)
0.02 (Good)
0.03 (Good)
0.03 (Good)
0.04 (Good)
0.04 (Good)
0.04 (Good)
0.04 (Good)
0.02 (Good)
0.02 (Good)
0.02 (Good)
0.02 (Good)
0.02 (Good)
0.02 (Good)
0.03 (Good)
0.03 (Good)
0.03 (Good)
0.03 (Good)
0.03 (Good)
- (Good)
0.01 (Good)
0.02 (Good)
0.02 (Good)
pm25
2.9 (Good)
3.8 (Good)
6.1 (Good)
5.6 (Good)
6.4 (Good)
7.8 (Good)
5.4 (Good)
4.1 (Good)
3.4 (Good)
3.5 (Good)
3.3 (Good)
6.4 (Good)
12 (Good)
3.6 (Good)
8.7 (Good)
9 (Good)
6.9 (Good)
7 (Good)
6.9 (Good)
6 (Good)
4.3 (Good)
39 (Unhealthy for Sensitive Groups)
6.8 (Good)
3.9 (Good)
6.9 (Good)
7.3 (Good)
14 (Moderate)
5.5 (Good)
8.9 (Good)
4.8 (Good)
9.6 (Good)
3 (Good)
8.2 (Good)
13 (Moderate)
14 (Moderate)
5.3 (Good)
4.6 (Good)
4.3 (Good)
4.8 (Good)
3.8 (Good)
3.8 (Good)
4.8 (Good)
data source »
RED DEER RIVERSIDE D
Selasa, 16 April 2024 10.00
PM2,5 3.7 (Bagus)
partikulat Matter (PM 2.5) debu
O3 0.03 (Bagus)
ozon (O3)
RED DEER RIVERSIDE D
index
2024-04-16
2024-04-15
2024-04-14
2024-04-13
2024-04-12
2024-04-11
2024-04-10
2024-04-09
pm25
5
7.3
5.2
5.3
4.5
4.9
2.2
5.7
o3
0.04
0.04
0.04
0.04
0.04
0.03
0.04
0.03
RED DEER RIVERSIDE D
2018-07 2020-05
index
2020-05
2020-04
2020-03
2020-02
2020-01
2019-12
2019-11
2019-10
2019-09
2019-08
2019-07
2019-06
2019-05
2019-04
2019-03
2019-02
2019-01
2018-12
2018-11
2018-10
2018-09
2018-08
2018-07
o3:ppm
0.04
0.04
0.03
0.02
0.02
0.01
0.02
0.02
0.02
0.02
0.02
0.03
0.04
0.04
0.03
0.02
0.02
0.02
0.01
0.02
0.02
0.03
0.03
pm25
2.9
3.8
6.1
5.6
6.4
7.8
5.4
4.1
3.4
3.5
3.3
6.4
12
3.6
8.7
9
6.9
7
6.9
6
4.3
39
9.6
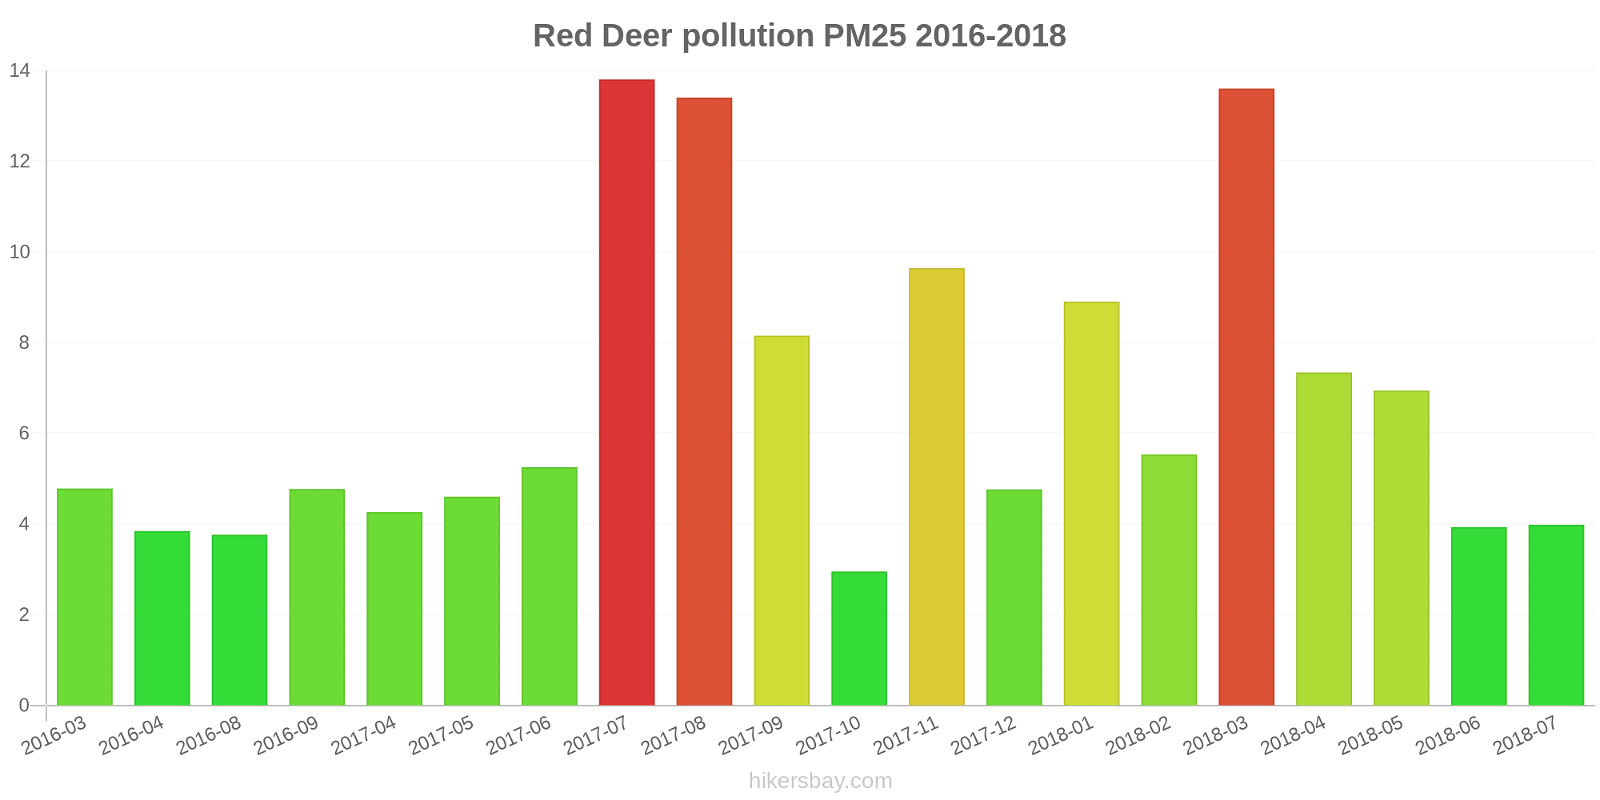
Red Deer
2016-03 2018-07
index
2018-07
2018-06
2018-05
2018-04
2018-03
2018-02
2018-01
2017-12
2017-11
2017-10
2017-09
2017-08
2017-07
2017-06
2017-05
2017-04
2016-09
2016-08
2016-04
2016-03
pm25
4
3.9
6.9
7.3
14
5.5
8.9
4.8
9.6
3
8.2
13
14
5.3
4.6
4.3
4.8
3.8
3.8
4.8
o3:ppm
0.04
0.04
0.04
0.04
0.04
0.02
0.02
0.02
0.02
0.02
0.02
0.03
0.03
0.03
0.03
0.03
-
0.01
0.02
0.02
* Pollution data source:
https://openaq.org
(AirNow)
The data is licensed under CC-By 4.0
PM2,5 4 (Bagus)
O3 0 (Bagus)
Data tentang polusi udara dari beberapa hari terakhir di North Red Deer
| index | 2024-04-09 | 2024-04-10 | 2024-04-11 | 2024-04-12 | 2024-04-13 | 2024-04-14 | 2024-04-15 | 2024-04-16 |
|---|---|---|---|---|---|---|---|---|
| pm25 | 6 Good |
2 Good |
5 Good |
4 Good |
5 Good |
5 Good |
7 Good |
5 Good |
| o3 | 0 Good |
0 Good |
0 Good |
0 Good |
0 Good |
0 Good |
0 Good |
0 Good |
| index | 2020-05 | 2020-04 | 2020-03 | 2020-02 | 2020-01 | 2019-12 | 2019-11 | 2019-10 | 2019-09 | 2019-08 | 2019-07 | 2019-06 | 2019-05 | 2019-04 | 2019-03 | 2019-02 | 2019-01 | 2018-12 | 2018-11 | 2018-10 | 2018-09 | 2018-08 | 2018-07 | 2018-06 | 2018-05 | 2018-04 | 2018-03 | 2018-02 | 2018-01 | 2017-12 | 2017-11 | 2017-10 | 2017-09 | 2017-08 | 2017-07 | 2017-06 | 2017-05 | 2017-04 | 2016-09 | 2016-08 | 2016-04 | 2016-03 |
|---|---|---|---|---|---|---|---|---|---|---|---|---|---|---|---|---|---|---|---|---|---|---|---|---|---|---|---|---|---|---|---|---|---|---|---|---|---|---|---|---|---|---|
| o3:ppm | 0.04 (Good) | 0.04 (Good) | 0.03 (Good) | 0.02 (Good) | 0.02 (Good) | 0.01 (Good) | 0.02 (Good) | 0.02 (Good) | 0.02 (Good) | 0.02 (Good) | 0.02 (Good) | 0.03 (Good) | 0.04 (Good) | 0.04 (Good) | 0.03 (Good) | 0.02 (Good) | 0.02 (Good) | 0.02 (Good) | 0.01 (Good) | 0.02 (Good) | 0.02 (Good) | 0.03 (Good) | 0.03 (Good) | 0.04 (Good) | 0.04 (Good) | 0.04 (Good) | 0.04 (Good) | 0.02 (Good) | 0.02 (Good) | 0.02 (Good) | 0.02 (Good) | 0.02 (Good) | 0.02 (Good) | 0.03 (Good) | 0.03 (Good) | 0.03 (Good) | 0.03 (Good) | 0.03 (Good) | - (Good) | 0.01 (Good) | 0.02 (Good) | 0.02 (Good) |
| pm25 | 2.9 (Good) | 3.8 (Good) | 6.1 (Good) | 5.6 (Good) | 6.4 (Good) | 7.8 (Good) | 5.4 (Good) | 4.1 (Good) | 3.4 (Good) | 3.5 (Good) | 3.3 (Good) | 6.4 (Good) | 12 (Good) | 3.6 (Good) | 8.7 (Good) | 9 (Good) | 6.9 (Good) | 7 (Good) | 6.9 (Good) | 6 (Good) | 4.3 (Good) | 39 (Unhealthy for Sensitive Groups) | 6.8 (Good) | 3.9 (Good) | 6.9 (Good) | 7.3 (Good) | 14 (Moderate) | 5.5 (Good) | 8.9 (Good) | 4.8 (Good) | 9.6 (Good) | 3 (Good) | 8.2 (Good) | 13 (Moderate) | 14 (Moderate) | 5.3 (Good) | 4.6 (Good) | 4.3 (Good) | 4.8 (Good) | 3.8 (Good) | 3.8 (Good) | 4.8 (Good) |
PM2,5 3.7 (Bagus)
partikulat Matter (PM 2.5) debuO3 0.03 (Bagus)
ozon (O3)RED DEER RIVERSIDE D
| index | 2024-04-16 | 2024-04-15 | 2024-04-14 | 2024-04-13 | 2024-04-12 | 2024-04-11 | 2024-04-10 | 2024-04-09 |
|---|---|---|---|---|---|---|---|---|
| pm25 | 5 | 7.3 | 5.2 | 5.3 | 4.5 | 4.9 | 2.2 | 5.7 |
| o3 | 0.04 | 0.04 | 0.04 | 0.04 | 0.04 | 0.03 | 0.04 | 0.03 |
RED DEER RIVERSIDE D

| index | 2020-05 | 2020-04 | 2020-03 | 2020-02 | 2020-01 | 2019-12 | 2019-11 | 2019-10 | 2019-09 | 2019-08 | 2019-07 | 2019-06 | 2019-05 | 2019-04 | 2019-03 | 2019-02 | 2019-01 | 2018-12 | 2018-11 | 2018-10 | 2018-09 | 2018-08 | 2018-07 |
|---|---|---|---|---|---|---|---|---|---|---|---|---|---|---|---|---|---|---|---|---|---|---|---|
| o3:ppm | 0.04 | 0.04 | 0.03 | 0.02 | 0.02 | 0.01 | 0.02 | 0.02 | 0.02 | 0.02 | 0.02 | 0.03 | 0.04 | 0.04 | 0.03 | 0.02 | 0.02 | 0.02 | 0.01 | 0.02 | 0.02 | 0.03 | 0.03 |
| pm25 | 2.9 | 3.8 | 6.1 | 5.6 | 6.4 | 7.8 | 5.4 | 4.1 | 3.4 | 3.5 | 3.3 | 6.4 | 12 | 3.6 | 8.7 | 9 | 6.9 | 7 | 6.9 | 6 | 4.3 | 39 | 9.6 |
Red Deer
| index | 2018-07 | 2018-06 | 2018-05 | 2018-04 | 2018-03 | 2018-02 | 2018-01 | 2017-12 | 2017-11 | 2017-10 | 2017-09 | 2017-08 | 2017-07 | 2017-06 | 2017-05 | 2017-04 | 2016-09 | 2016-08 | 2016-04 | 2016-03 |
|---|---|---|---|---|---|---|---|---|---|---|---|---|---|---|---|---|---|---|---|---|
| pm25 | 4 | 3.9 | 6.9 | 7.3 | 14 | 5.5 | 8.9 | 4.8 | 9.6 | 3 | 8.2 | 13 | 14 | 5.3 | 4.6 | 4.3 | 4.8 | 3.8 | 3.8 | 4.8 |
| o3:ppm | 0.04 | 0.04 | 0.04 | 0.04 | 0.04 | 0.02 | 0.02 | 0.02 | 0.02 | 0.02 | 0.02 | 0.03 | 0.03 | 0.03 | 0.03 | 0.03 | - | 0.01 | 0.02 | 0.02 |