Polusi udara di Laurentides: indeks kualitas udara real-time dan siaga asap.
Perkiraan kualitas polusi dan udara untuk Laurentides. Hari ini Selasa, 16 Juni 2026. Nilai polusi udara berikut telah tercatat untuk Laurentides:- partikulat Matter (PM 2.5) debu - 0 (Bagus)
- ozon (O3) - 0 (Bagus)

Apa kualitas udara di Laurentides hari ini? Apakah udara tercemar di Laurentides?. Apakah ada Smog?
Apa tingkat saat PM 2,5 in Laurentides? (partikulat Matter (PM 2.5) debu)
Hari ini PM 2.5 tingkat:
0 (Bagus)
Sebagai perbandingan, tingkat tertinggi PM 2,5 in Laurentides dalam 7 hari terakhir adalah: 3 (Selasa, 9 April 2024) dan Terendah: 1 (Sabtu, 13 April 2024).
Nilai tertinggi PM 2.5 direkam: 10 (Februari 2018).
Tingkat terendah dari partikulat Matter PM 2.5 polusi terjadi di bulan: September (1.9).
Bagaimana tingkat O3 hari ini di Laurentides? (ozon (O3))
0 (Bagus)
Data saat ini Selasa, 16 April 2024 11.00
PM2,5 0 (Bagus)
O3 0 (Bagus)
Data tentang polusi udara dari beberapa hari terakhir di Laurentides
index
2024-04-09
2024-04-10
2024-04-11
2024-04-12
2024-04-13
2024-04-14
2024-04-15
2024-04-16
pm25
3
Good
3
Good
3
Good
2
Good
1
Good
2
Good
2
Good
1
Good
o3
0
Good
0
Good
0
Good
0
Good
0
Good
0
Good
0
Good
0
Good
data source »
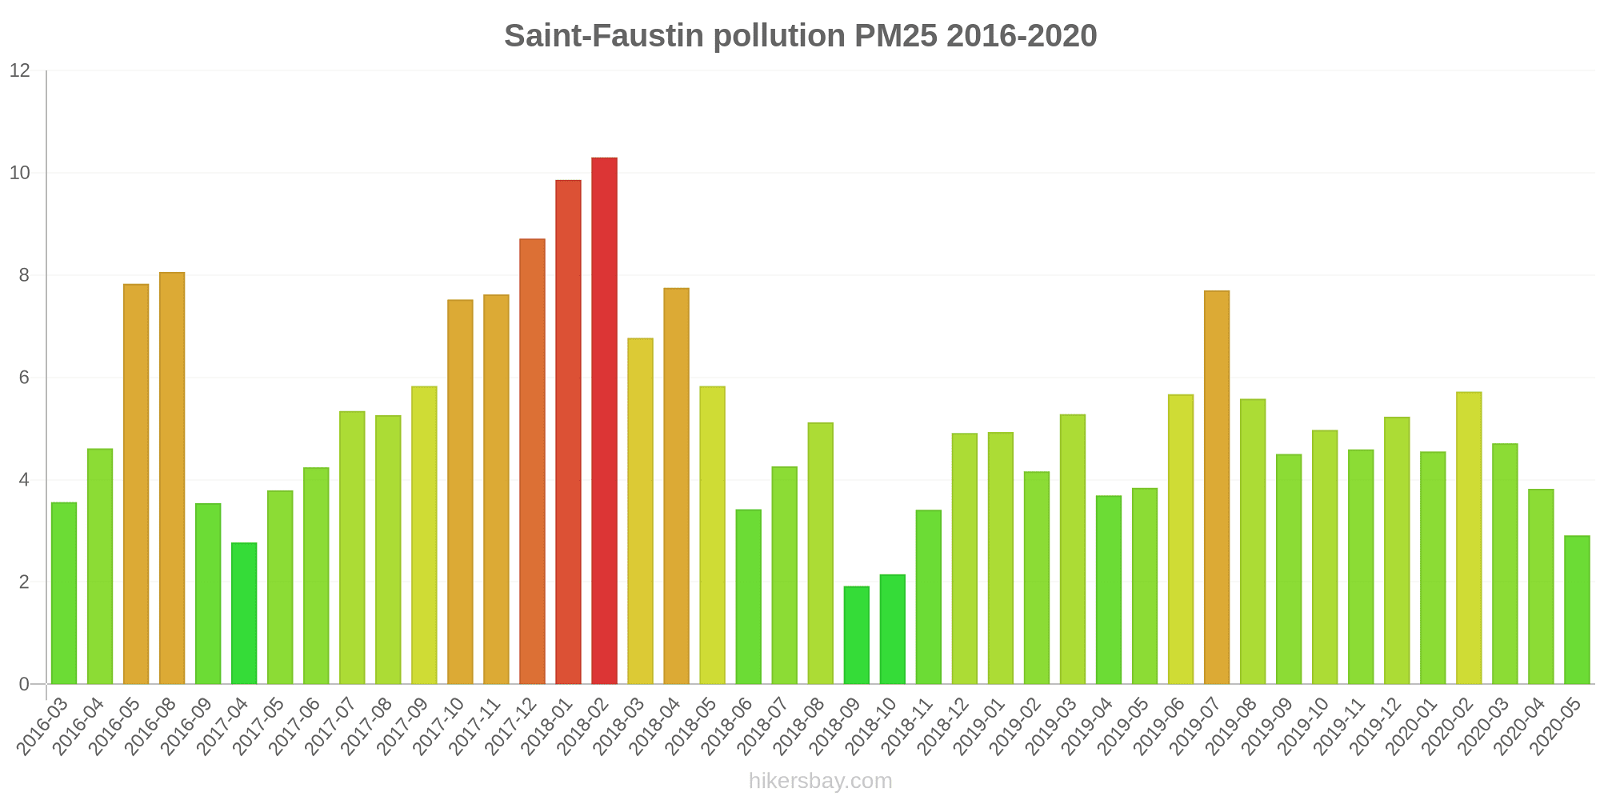
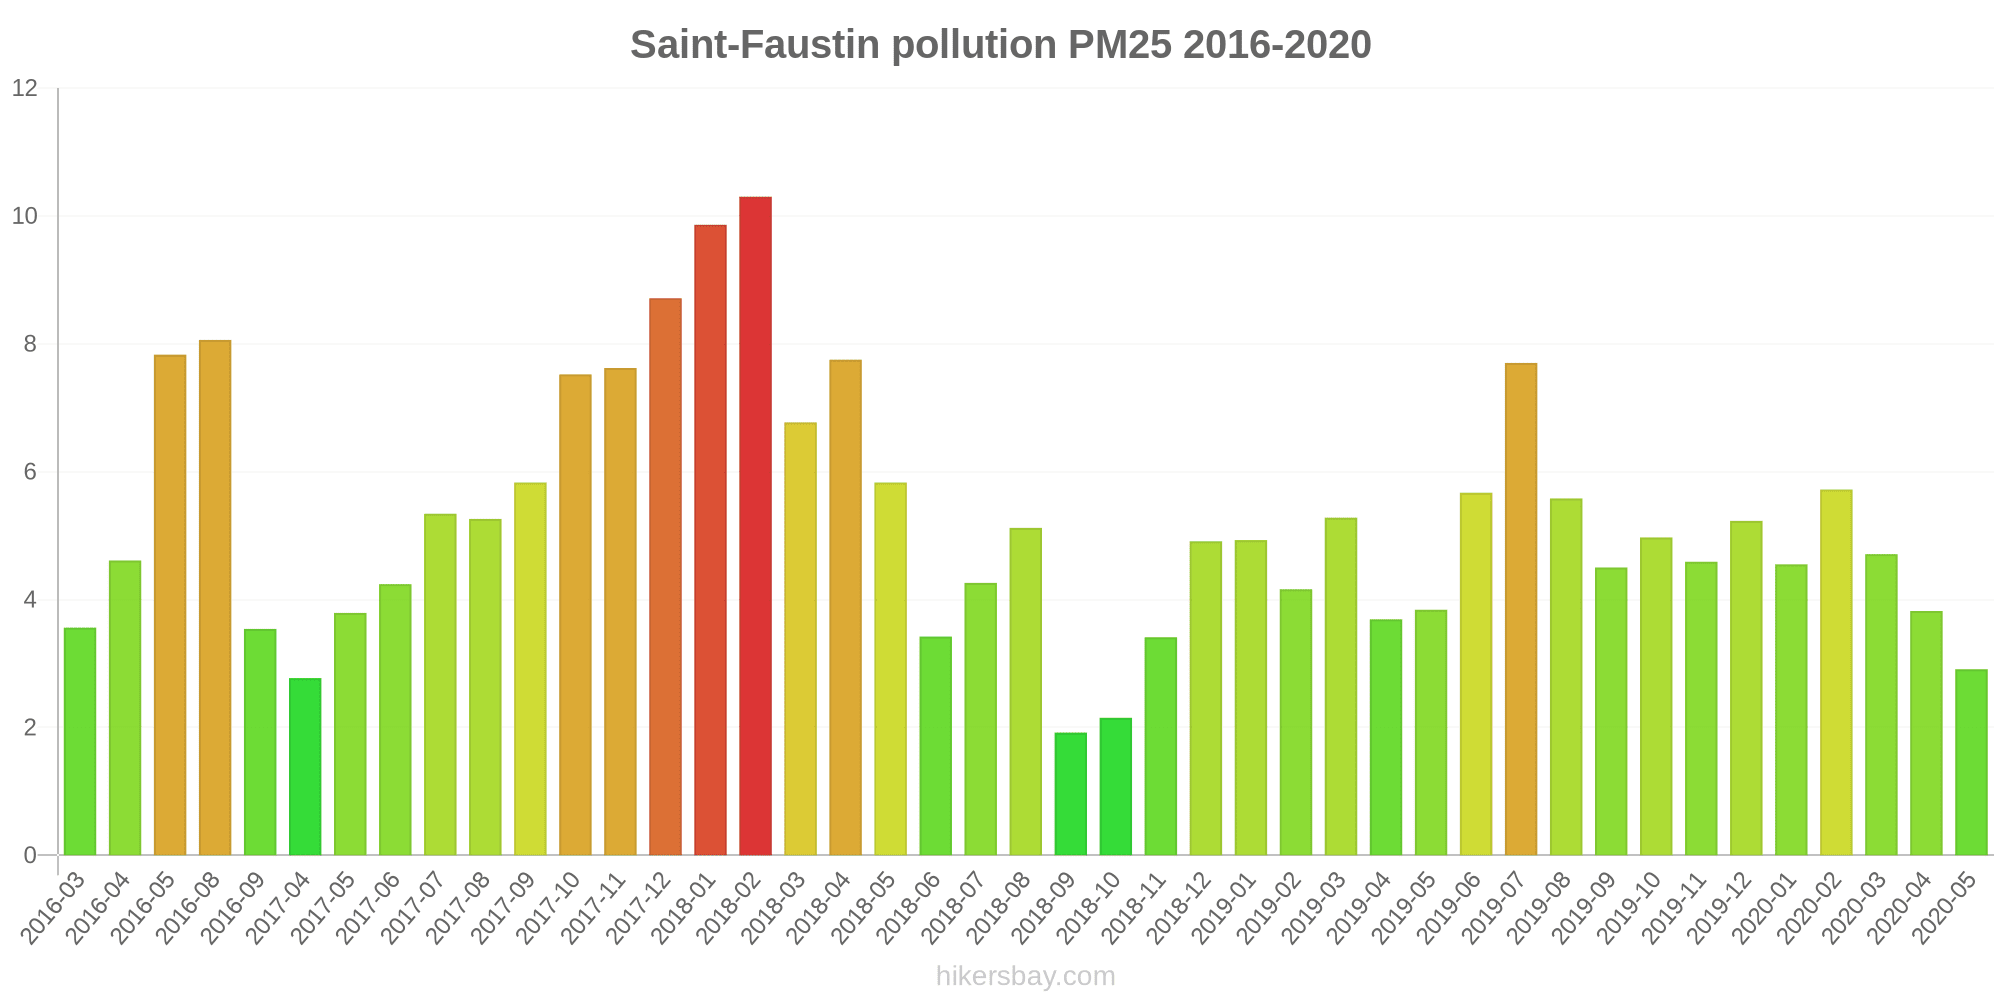
Polusi udara di Laurentides dari Maret 2016 ke Mei 2020

index
2020-05
2020-04
2020-03
2020-02
2020-01
2019-12
2019-11
2019-10
2019-09
2019-08
2019-07
2019-06
2019-05
2019-04
2019-03
2019-02
2019-01
2018-12
2018-11
2018-10
2018-09
2018-08
2018-07
2018-06
2018-05
2018-04
2018-03
2018-02
2018-01
2017-12
2017-11
2017-10
2017-09
2017-08
2017-07
2017-06
2017-05
2017-04
2016-09
2016-08
2016-05
2016-04
2016-03
o3:ppm
0.03 (Good)
0.04 (Good)
0.04 (Good)
0.03 (Good)
0.03 (Good)
0.03 (Good)
0.03 (Good)
0.02 (Good)
0.02 (Good)
0.02 (Good)
0.02 (Good)
0.02 (Good)
0.03 (Good)
0.04 (Good)
0.04 (Good)
0.04 (Good)
0.03 (Good)
0.03 (Good)
0.03 (Good)
0.02 (Good)
0.02 (Good)
0.02 (Good)
0.02 (Good)
0.02 (Good)
0.04 (Good)
0.04 (Good)
0.04 (Good)
0.04 (Good)
0.03 (Good)
0.03 (Good)
0.03 (Good)
0.02 (Good)
0.02 (Good)
0.02 (Good)
0.02 (Good)
0.02 (Good)
0.03 (Good)
0.03 (Good)
0.02 (Good)
0.02 (Good)
0.03 (Good)
0.04 (Good)
0.04 (Good)
pm25
2.9 (Good)
3.8 (Good)
4.7 (Good)
5.7 (Good)
4.5 (Good)
5.2 (Good)
4.6 (Good)
5 (Good)
4.5 (Good)
5.6 (Good)
7.7 (Good)
5.7 (Good)
3.8 (Good)
3.7 (Good)
5.3 (Good)
4.2 (Good)
4.9 (Good)
4.9 (Good)
3.4 (Good)
2.1 (Good)
1.9 (Good)
5.1 (Good)
4.3 (Good)
3.4 (Good)
5.8 (Good)
7.8 (Good)
6.8 (Good)
10 (Good)
9.9 (Good)
8.7 (Good)
7.6 (Good)
7.5 (Good)
5.8 (Good)
5.3 (Good)
5.3 (Good)
4.2 (Good)
3.8 (Good)
2.8 (Good)
3.5 (Good)
8.1 (Good)
7.8 (Good)
4.6 (Good)
3.6 (Good)
data source »
Kualitas hidup di Laurentides
Hijau dan taman di kota
Laurentides
50%
Amerika Serikat: 70%
Venezuela: 41%
Islandia: 72%
partikulat Matter PM 2.5
Laurentides
5 (Good)
Kenikmatan menghabiskan waktu di kota
Laurentides
67%
Amerika Serikat: 75%
Bahama: 53%
Venezuela: 41%
Islandia: 89%
partikulat Matter PM10
Laurentides
9 (Good)
Polusi udara
Laurentides
10%
Amerika Serikat: 29%
Bahama: 52%
Venezuela: 59%
Islandia: 13%
Pembuangan sampah
Laurentides
50%
Amerika Serikat: 71%
Bahama: 29%
Venezuela: 18%
Islandia: 79%
Ketersediaan dan kualitas air minum
Laurentides
0%
Amerika Serikat: 71%
Bahama: 55%
Venezuela: 28%
Islandia: 96%
Kebersihan dan kerasnya
Laurentides
25%
Amerika Serikat: 60%
Bahama: 35%
Venezuela: 22%
Islandia: 75%
Kebisingan dan polusi cahaya
Laurentides
100%
Amerika Serikat: 47%
Bahama: 39%
Venezuela: 47%
Islandia: 23%
Polusi air
Laurentides
100%
Amerika Serikat: 44%
Bahama: 58%
Venezuela: 76%
Islandia: 8,4%
Source: Numbeo
Mont-Saint-Michel
Selasa, 16 April 2024 11.00
PM2,5 0.4 (Bagus)
partikulat Matter (PM 2.5) debu
O3 0.03 (Bagus)
ozon (O3)
Mont-Saint-Michel
index
2024-04-16
2024-04-15
2024-04-14
2024-04-13
2024-04-12
2024-04-11
2024-04-10
2024-04-09
pm25
1.3
2.1
1.9
0.7
1.8
3.3
3.3
2.5
o3
0.03
0.03
0.03
0.03
0.03
0.03
0.04
0.03
Mont-Saint-Michel
index
2020-05
2020-04
2020-03
2020-02
2020-01
2019-12
2019-11
2019-10
2019-09
2019-08
2019-07
2019-06
2019-05
2019-04
2019-03
2019-02
2019-01
2018-12
2018-11
2018-10
2018-09
2018-08
2018-07
2018-06
2018-05
2018-04
2018-03
2018-02
2018-01
2017-12
2017-11
2017-10
2017-09
2017-08
2017-07
2017-06
2017-05
2017-04
2016-09
2016-08
2016-05
2016-04
2016-03
o3:ppm
0.03
0.03
0.03
0.03
0.03
0.03
0.02
0.02
0.01
0.01
0.02
0.02
0.03
0.04
0.04
0.04
0.03
0.03
0.03
0.02
0.01
0.01
0.02
0.02
0.03
0.04
0.04
0.03
0.03
0.03
0.02
0.02
0.02
0.01
0.02
0.02
0.03
0.03
0.02
0.02
0.02
0.04
0.03
Saint-Faustin
2016-03 2020-05
index
2020-05
2020-04
2020-03
2020-02
2020-01
2019-12
2019-11
2019-10
2019-09
2019-08
2019-07
2019-06
2019-05
2019-04
2019-03
2019-02
2019-01
2018-12
2018-11
2018-10
2018-09
2018-08
2018-07
2018-06
2018-05
2018-04
2018-03
2018-02
2018-01
2017-12
2017-11
2017-10
2017-09
2017-08
2017-07
2017-06
2017-05
2017-04
2016-09
2016-08
2016-05
2016-04
2016-03
o3:ppm
0.03
0.04
0.04
0.04
0.03
0.03
0.03
0.02
0.02
0.02
0.03
0.03
0.03
0.04
0.04
0.04
0.03
0.03
0.03
0.02
0.02
0.03
0.03
0.03
0.04
0.04
0.04
0.04
0.03
0.03
0.03
0.03
0.02
0.02
0.02
0.03
0.03
0.04
0.02
0.03
0.04
0.04
0.04
pm25
2.9
3.8
4.7
5.7
4.5
5.2
4.6
5
4.5
5.6
7.7
5.7
3.8
3.7
5.3
4.2
4.9
4.9
3.4
2.1
1.9
5.1
4.3
3.4
5.8
7.8
6.8
10
9.9
8.7
7.6
7.5
5.8
5.3
5.3
4.2
3.8
2.8
3.5
8.1
7.8
4.6
3.6
* Pollution data source:
https://openaq.org
(AirNow)
The data is licensed under CC-By 4.0
PM2,5 0 (Bagus)
O3 0 (Bagus)
Data tentang polusi udara dari beberapa hari terakhir di Laurentides
| index | 2024-04-09 | 2024-04-10 | 2024-04-11 | 2024-04-12 | 2024-04-13 | 2024-04-14 | 2024-04-15 | 2024-04-16 |
|---|---|---|---|---|---|---|---|---|
| pm25 | 3 Good |
3 Good |
3 Good |
2 Good |
1 Good |
2 Good |
2 Good |
1 Good |
| o3 | 0 Good |
0 Good |
0 Good |
0 Good |
0 Good |
0 Good |
0 Good |
0 Good |

| index | 2020-05 | 2020-04 | 2020-03 | 2020-02 | 2020-01 | 2019-12 | 2019-11 | 2019-10 | 2019-09 | 2019-08 | 2019-07 | 2019-06 | 2019-05 | 2019-04 | 2019-03 | 2019-02 | 2019-01 | 2018-12 | 2018-11 | 2018-10 | 2018-09 | 2018-08 | 2018-07 | 2018-06 | 2018-05 | 2018-04 | 2018-03 | 2018-02 | 2018-01 | 2017-12 | 2017-11 | 2017-10 | 2017-09 | 2017-08 | 2017-07 | 2017-06 | 2017-05 | 2017-04 | 2016-09 | 2016-08 | 2016-05 | 2016-04 | 2016-03 |
|---|---|---|---|---|---|---|---|---|---|---|---|---|---|---|---|---|---|---|---|---|---|---|---|---|---|---|---|---|---|---|---|---|---|---|---|---|---|---|---|---|---|---|---|
| o3:ppm | 0.03 (Good) | 0.04 (Good) | 0.04 (Good) | 0.03 (Good) | 0.03 (Good) | 0.03 (Good) | 0.03 (Good) | 0.02 (Good) | 0.02 (Good) | 0.02 (Good) | 0.02 (Good) | 0.02 (Good) | 0.03 (Good) | 0.04 (Good) | 0.04 (Good) | 0.04 (Good) | 0.03 (Good) | 0.03 (Good) | 0.03 (Good) | 0.02 (Good) | 0.02 (Good) | 0.02 (Good) | 0.02 (Good) | 0.02 (Good) | 0.04 (Good) | 0.04 (Good) | 0.04 (Good) | 0.04 (Good) | 0.03 (Good) | 0.03 (Good) | 0.03 (Good) | 0.02 (Good) | 0.02 (Good) | 0.02 (Good) | 0.02 (Good) | 0.02 (Good) | 0.03 (Good) | 0.03 (Good) | 0.02 (Good) | 0.02 (Good) | 0.03 (Good) | 0.04 (Good) | 0.04 (Good) |
| pm25 | 2.9 (Good) | 3.8 (Good) | 4.7 (Good) | 5.7 (Good) | 4.5 (Good) | 5.2 (Good) | 4.6 (Good) | 5 (Good) | 4.5 (Good) | 5.6 (Good) | 7.7 (Good) | 5.7 (Good) | 3.8 (Good) | 3.7 (Good) | 5.3 (Good) | 4.2 (Good) | 4.9 (Good) | 4.9 (Good) | 3.4 (Good) | 2.1 (Good) | 1.9 (Good) | 5.1 (Good) | 4.3 (Good) | 3.4 (Good) | 5.8 (Good) | 7.8 (Good) | 6.8 (Good) | 10 (Good) | 9.9 (Good) | 8.7 (Good) | 7.6 (Good) | 7.5 (Good) | 5.8 (Good) | 5.3 (Good) | 5.3 (Good) | 4.2 (Good) | 3.8 (Good) | 2.8 (Good) | 3.5 (Good) | 8.1 (Good) | 7.8 (Good) | 4.6 (Good) | 3.6 (Good) |
Hijau dan taman di kota
Laurentides 50%
Amerika Serikat: 70% Venezuela: 41% Islandia: 72%partikulat Matter PM 2.5
Laurentides 5 (Good)
Kenikmatan menghabiskan waktu di kota
Laurentides 67%
Amerika Serikat: 75% Bahama: 53% Venezuela: 41% Islandia: 89%partikulat Matter PM10
Laurentides 9 (Good)
Polusi udara
Laurentides 10%
Amerika Serikat: 29% Bahama: 52% Venezuela: 59% Islandia: 13%Pembuangan sampah
Laurentides 50%
Amerika Serikat: 71% Bahama: 29% Venezuela: 18% Islandia: 79%Ketersediaan dan kualitas air minum
Laurentides 0%
Amerika Serikat: 71% Bahama: 55% Venezuela: 28% Islandia: 96%Kebersihan dan kerasnya
Laurentides 25%
Amerika Serikat: 60% Bahama: 35% Venezuela: 22% Islandia: 75%Kebisingan dan polusi cahaya
Laurentides 100%
Amerika Serikat: 47% Bahama: 39% Venezuela: 47% Islandia: 23%Polusi air
Laurentides 100%
Amerika Serikat: 44% Bahama: 58% Venezuela: 76% Islandia: 8,4%PM2,5 0.4 (Bagus)
partikulat Matter (PM 2.5) debuO3 0.03 (Bagus)
ozon (O3)Mont-Saint-Michel
| index | 2024-04-16 | 2024-04-15 | 2024-04-14 | 2024-04-13 | 2024-04-12 | 2024-04-11 | 2024-04-10 | 2024-04-09 |
|---|---|---|---|---|---|---|---|---|
| pm25 | 1.3 | 2.1 | 1.9 | 0.7 | 1.8 | 3.3 | 3.3 | 2.5 |
| o3 | 0.03 | 0.03 | 0.03 | 0.03 | 0.03 | 0.03 | 0.04 | 0.03 |
Mont-Saint-Michel
| index | 2020-05 | 2020-04 | 2020-03 | 2020-02 | 2020-01 | 2019-12 | 2019-11 | 2019-10 | 2019-09 | 2019-08 | 2019-07 | 2019-06 | 2019-05 | 2019-04 | 2019-03 | 2019-02 | 2019-01 | 2018-12 | 2018-11 | 2018-10 | 2018-09 | 2018-08 | 2018-07 | 2018-06 | 2018-05 | 2018-04 | 2018-03 | 2018-02 | 2018-01 | 2017-12 | 2017-11 | 2017-10 | 2017-09 | 2017-08 | 2017-07 | 2017-06 | 2017-05 | 2017-04 | 2016-09 | 2016-08 | 2016-05 | 2016-04 | 2016-03 |
|---|---|---|---|---|---|---|---|---|---|---|---|---|---|---|---|---|---|---|---|---|---|---|---|---|---|---|---|---|---|---|---|---|---|---|---|---|---|---|---|---|---|---|---|
| o3:ppm | 0.03 | 0.03 | 0.03 | 0.03 | 0.03 | 0.03 | 0.02 | 0.02 | 0.01 | 0.01 | 0.02 | 0.02 | 0.03 | 0.04 | 0.04 | 0.04 | 0.03 | 0.03 | 0.03 | 0.02 | 0.01 | 0.01 | 0.02 | 0.02 | 0.03 | 0.04 | 0.04 | 0.03 | 0.03 | 0.03 | 0.02 | 0.02 | 0.02 | 0.01 | 0.02 | 0.02 | 0.03 | 0.03 | 0.02 | 0.02 | 0.02 | 0.04 | 0.03 |
Saint-Faustin
| index | 2020-05 | 2020-04 | 2020-03 | 2020-02 | 2020-01 | 2019-12 | 2019-11 | 2019-10 | 2019-09 | 2019-08 | 2019-07 | 2019-06 | 2019-05 | 2019-04 | 2019-03 | 2019-02 | 2019-01 | 2018-12 | 2018-11 | 2018-10 | 2018-09 | 2018-08 | 2018-07 | 2018-06 | 2018-05 | 2018-04 | 2018-03 | 2018-02 | 2018-01 | 2017-12 | 2017-11 | 2017-10 | 2017-09 | 2017-08 | 2017-07 | 2017-06 | 2017-05 | 2017-04 | 2016-09 | 2016-08 | 2016-05 | 2016-04 | 2016-03 |
|---|---|---|---|---|---|---|---|---|---|---|---|---|---|---|---|---|---|---|---|---|---|---|---|---|---|---|---|---|---|---|---|---|---|---|---|---|---|---|---|---|---|---|---|
| o3:ppm | 0.03 | 0.04 | 0.04 | 0.04 | 0.03 | 0.03 | 0.03 | 0.02 | 0.02 | 0.02 | 0.03 | 0.03 | 0.03 | 0.04 | 0.04 | 0.04 | 0.03 | 0.03 | 0.03 | 0.02 | 0.02 | 0.03 | 0.03 | 0.03 | 0.04 | 0.04 | 0.04 | 0.04 | 0.03 | 0.03 | 0.03 | 0.03 | 0.02 | 0.02 | 0.02 | 0.03 | 0.03 | 0.04 | 0.02 | 0.03 | 0.04 | 0.04 | 0.04 |
| pm25 | 2.9 | 3.8 | 4.7 | 5.7 | 4.5 | 5.2 | 4.6 | 5 | 4.5 | 5.6 | 7.7 | 5.7 | 3.8 | 3.7 | 5.3 | 4.2 | 4.9 | 4.9 | 3.4 | 2.1 | 1.9 | 5.1 | 4.3 | 3.4 | 5.8 | 7.8 | 6.8 | 10 | 9.9 | 8.7 | 7.6 | 7.5 | 5.8 | 5.3 | 5.3 | 4.2 | 3.8 | 2.8 | 3.5 | 8.1 | 7.8 | 4.6 | 3.6 |