Polusi udara di Burnaby: indeks kualitas udara real-time dan siaga asap.
Perkiraan kualitas polusi dan udara untuk Burnaby. Hari ini Kamis, 18 Juni 2026. Nilai polusi udara berikut telah tercatat untuk Burnaby:- partikulat Matter (PM 2.5) debu - 2 (Bagus)
- karbon monoksida (CO) - 0 (Bagus)
- sulfur dioksida (SO2) - 0 (Bagus)
- ozon (O3) - 0 (Bagus)
- nitrogen dioksida (NO2) - 0 (Bagus)
- partikulat Matter (PM10) debu tersuspensi - 6 (Bagus)

Apa kualitas udara di Burnaby hari ini? Apakah udara tercemar di Burnaby?. Apakah ada Smog?
Apa tingkat saat PM 2,5 in Burnaby? (partikulat Matter (PM 2.5) debu)
Hari ini PM 2.5 tingkat:
2 (Bagus)
Sebagai perbandingan, tingkat tertinggi PM 2,5 in Burnaby dalam 7 hari terakhir adalah: 5 (Kamis, 11 April 2024) dan Terendah: 2 (Selasa, 9 April 2024).
Nilai tertinggi PM 2.5 direkam: 29 (Agustus 2018).
Tingkat terendah dari partikulat Matter PM 2.5 polusi terjadi di bulan: November (2.3).
Seberapa tinggi tingkat CO? (karbon monoksida (CO))
0 (Bagus)
Apa tingkat polusi SO2? (sulfur dioksida (SO2))
0 (Bagus)
Bagaimana tingkat O3 hari ini di Burnaby? (ozon (O3))
0 (Bagus)
Seberapa tinggi tingkat NO2? (nitrogen dioksida (NO2))
0 (Bagus)
Apa tingkat PM10 hari ini di Burnaby? (partikulat Matter (PM10) debu tersuspensi)
Level saat ini dari partikulat Matter PM10 di Burnaby adalah:
6 (Bagus)
Data saat ini Selasa, 16 April 2024 10.00
PM2,5 2 (Bagus)
CO 0 (Bagus)
SO2 0 (Bagus)
O3 0 (Bagus)
NO2 0 (Bagus)
0 (Bagus)
PM10 6 (Bagus)
Data tentang polusi udara dari beberapa hari terakhir di Burnaby
index
2024-04-09
2024-04-10
2024-04-11
2024-04-12
2024-04-13
2024-04-14
2024-04-15
2024-04-16
so2
0
Good
0
Good
0
Good
0
Good
0
Good
0
Good
0
Good
0
Good
o3
0
Good
0
Good
0
Good
0
Good
0
Good
0
Good
0
Good
0
Good
co
0
Good
0
Good
0
Good
0
Good
0
Good
0
Good
0
Good
0
Good
no
0
Good
0
Good
0
Good
0
Good
0
Good
0
Good
0
Good
0
Good
no2
0
Good
0
Good
0
Good
0
Good
0
Good
0
Good
0
Good
0
Good
pm25
2
Good
3
Good
5
Good
4
Good
4
Good
4
Good
3
Good
2
Good
pm10
5
Good
6
Good
7
Good
5
Good
7
Good
9
Good
8
Good
7
Good
data source »
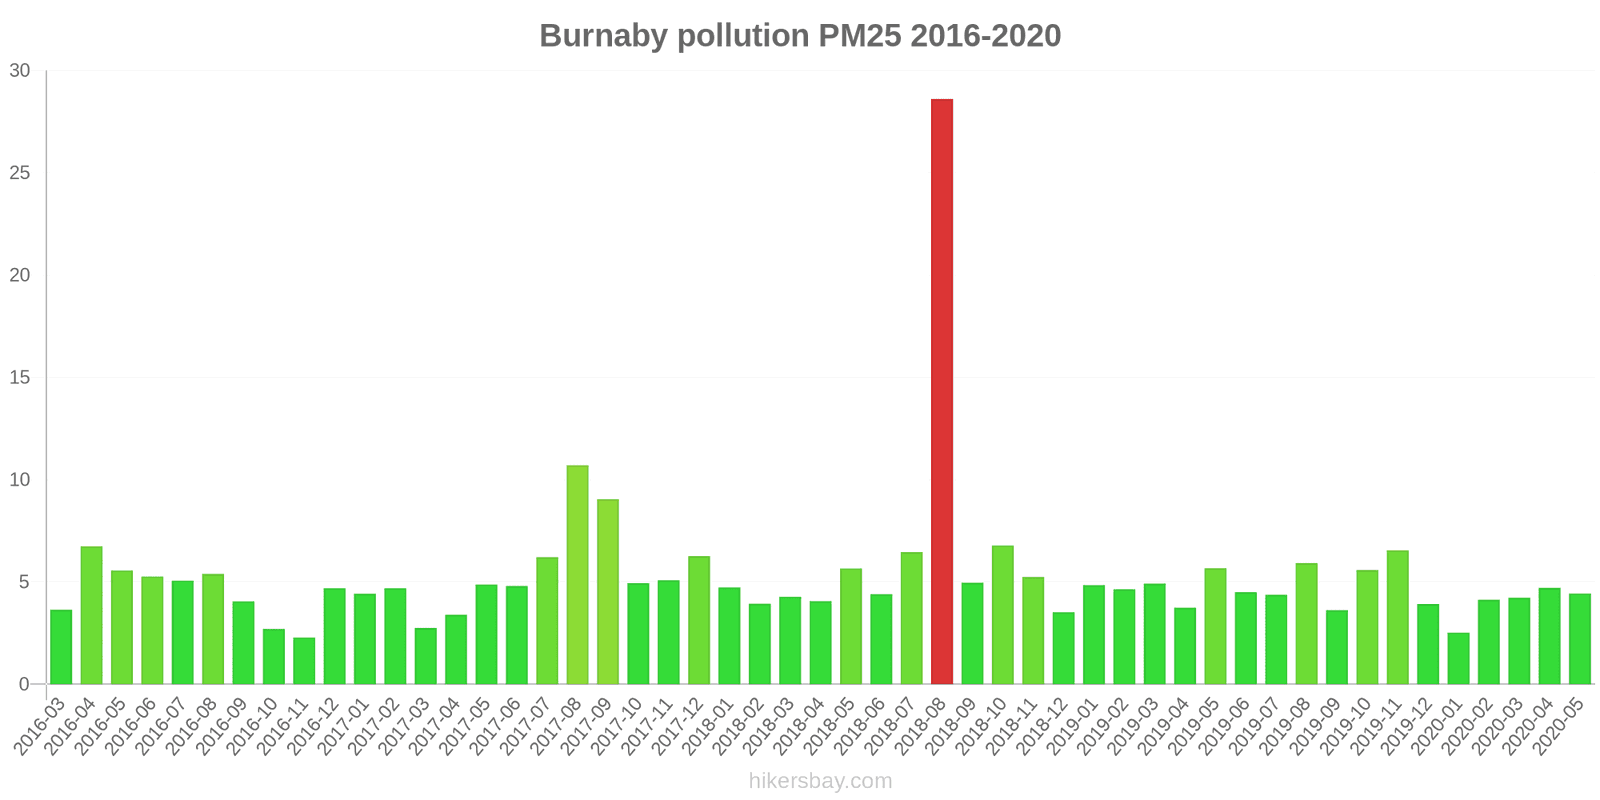
Polusi udara di Burnaby dari Maret 2016 ke Mei 2020
index
2020-05
2020-04
2020-03
2020-02
2020-01
2019-12
2019-11
2019-10
2019-09
2019-08
2019-07
2019-06
2019-05
2019-04
2019-03
2019-02
2019-01
2018-12
2018-11
2018-10
2018-09
2018-08
2018-07
2018-06
2018-05
2018-04
2018-03
2018-02
2018-01
2017-12
2017-11
2017-10
2017-09
2017-08
2017-07
2017-06
2017-05
2017-04
2017-03
2017-02
2017-01
2016-12
2016-11
2016-10
2016-09
2016-08
2016-07
2016-06
2016-05
2016-04
2016-03
o3:ppm
0.03 (Good)
0.03 (Good)
0.02 (Good)
0.01 (Good)
0.02 (Good)
0.01 (Good)
0.01 (Good)
0.01 (Good)
0.01 (Good)
0.02 (Good)
0.02 (Good)
0.02 (Good)
0.02 (Good)
0.03 (Good)
0.02 (Good)
0.02 (Good)
0.01 (Good)
0.02 (Good)
0.02 (Good)
0.01 (Good)
0.01 (Good)
0.02 (Good)
0.02 (Good)
0.02 (Good)
0.03 (Good)
0.03 (Good)
0.02 (Good)
0.02 (Good)
0.02 (Good)
0.01 (Good)
0.02 (Good)
0.01 (Good)
0.02 (Good)
0.02 (Good)
0.02 (Good)
0.02 (Good)
0.03 (Good)
0.03 (Good)
0.03 (Good)
0.02 (Good)
0.02 (Good)
0.01 (Good)
0.02 (Good)
0.02 (Good)
0.01 (Good)
0.02 (Good)
0.02 (Good)
0.02 (Good)
0.03 (Good)
0.02 (Good)
0.02 (Good)
pm25
4.4 (Good)
4.7 (Good)
4.2 (Good)
4.1 (Good)
2.5 (Good)
3.9 (Good)
6.5 (Good)
5.6 (Good)
3.6 (Good)
5.9 (Good)
4.4 (Good)
4.5 (Good)
5.7 (Good)
3.7 (Good)
4.9 (Good)
4.6 (Good)
4.8 (Good)
3.5 (Good)
5.2 (Good)
6.8 (Good)
5 (Good)
29 (Moderate)
6.5 (Good)
4.4 (Good)
5.7 (Good)
4.1 (Good)
4.3 (Good)
3.9 (Good)
4.7 (Good)
6.3 (Good)
5.1 (Good)
4.9 (Good)
9 (Good)
11 (Good)
6.2 (Good)
4.8 (Good)
4.9 (Good)
3.4 (Good)
2.8 (Good)
4.7 (Good)
4.4 (Good)
4.7 (Good)
2.3 (Good)
2.7 (Good)
4 (Good)
5.4 (Good)
5.1 (Good)
5.3 (Good)
5.6 (Good)
6.7 (Good)
3.6 (Good)
data source »
Kualitas hidup di Burnaby
Hijau dan taman di kota
Burnaby
73%
Amerika Serikat: 70%
Venezuela: 41%
Islandia: 72%
partikulat Matter PM 2.5
Burnaby
7 (Good)
Kenikmatan menghabiskan waktu di kota
Burnaby
76%
Amerika Serikat: 75%
Bahama: 53%
Venezuela: 41%
Islandia: 89%
partikulat Matter PM10
Burnaby
9 (Good)
Polusi udara
Burnaby
25%
Amerika Serikat: 29%
Bahama: 52%
Venezuela: 59%
Islandia: 13%
Pembuangan sampah
Burnaby
86%
Amerika Serikat: 71%
Bahama: 29%
Venezuela: 18%
Islandia: 79%
Ketersediaan dan kualitas air minum
Burnaby
84%
Amerika Serikat: 71%
Bahama: 55%
Venezuela: 28%
Islandia: 96%
Kebersihan dan kerasnya
Burnaby
72%
Amerika Serikat: 60%
Bahama: 35%
Venezuela: 22%
Islandia: 75%
Kebisingan dan polusi cahaya
Burnaby
57%
Amerika Serikat: 47%
Bahama: 39%
Venezuela: 47%
Islandia: 23%
Polusi air
Burnaby
44%
Amerika Serikat: 44%
Bahama: 58%
Venezuela: 76%
Islandia: 8,4%
Source: Numbeo
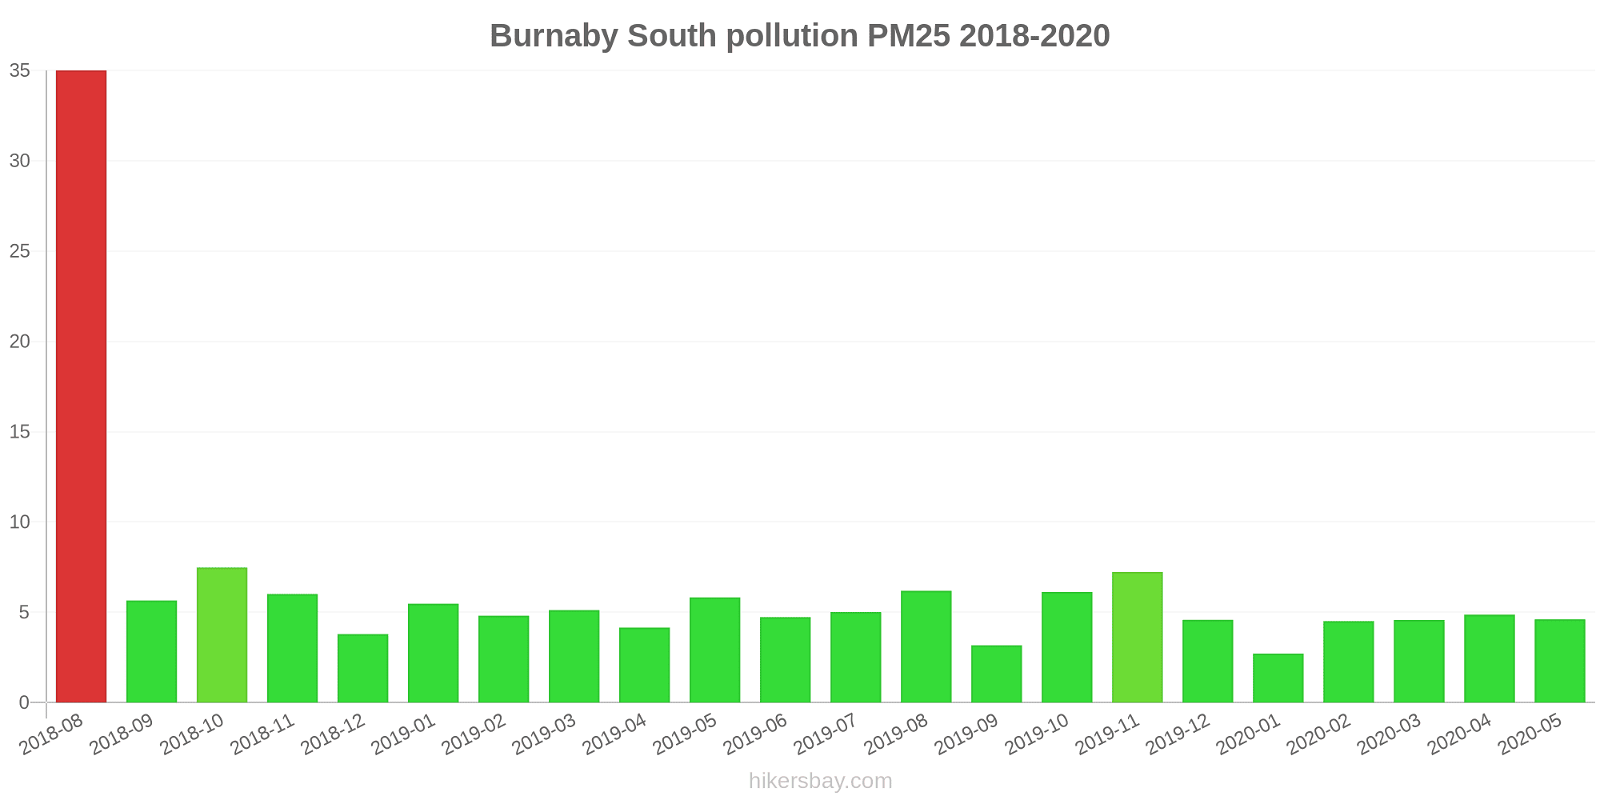
Burnaby South
Selasa, 16 April 2024 10.00
PM2,5 2.1 (Bagus)
partikulat Matter (PM 2.5) debu
CO 0.2 (Bagus)
karbon monoksida (CO)
SO2 0 (Bagus)
sulfur dioksida (SO2)
O3 0.04 (Bagus)
ozon (O3)
NO2 0 (Bagus)
nitrogen dioksida (NO2)
0 (Bagus)
index_name_no
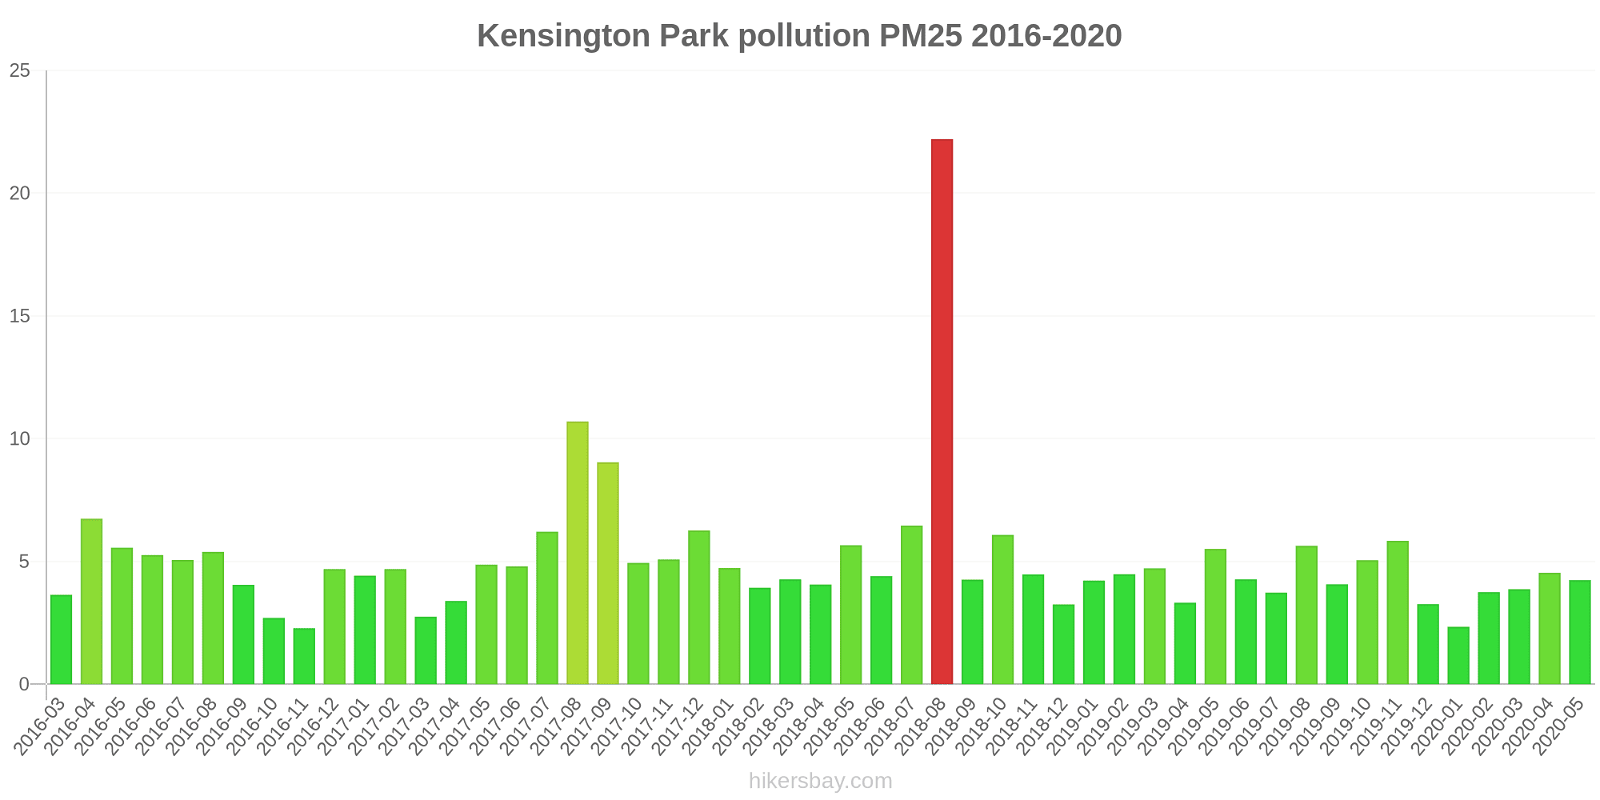
Kensington Park
Selasa, 16 April 2024 10.00
SO2 0 (Bagus)
sulfur dioksida (SO2)
PM10 6 (Bagus)
partikulat Matter (PM10) debu tersuspensi
NO2 0.01 (Bagus)
nitrogen dioksida (NO2)
O3 0.03 (Bagus)
ozon (O3)
PM2,5 1.6 (Bagus)
partikulat Matter (PM 2.5) debu
0 (Bagus)
index_name_no
Burnaby South
index
2024-04-16
2024-04-15
2024-04-14
2024-04-13
2024-04-12
2024-04-11
2024-04-10
2024-04-09
so2
0
0
0
0
0
0
0
0
o3
0.04
0.04
0.02
0.02
0.03
0.03
0.03
0.03
co
0.2
0.2
0.24
0.23
0.2
0.2
0.2
0.21
no
0
0
0
0
0
0
0
0
no2
0
0.01
0.01
0.01
0.01
0.01
0.01
0.01
pm25
1.7
3.7
4.3
2.6
4
4.7
2.9
1.6
Kensington Park
index
2024-04-16
2024-04-15
2024-04-14
2024-04-13
2024-04-12
2024-04-11
2024-04-10
2024-04-09
so2
0
0
0
0
0
0
0
0
pm10
6.5
8
9.3
7.2
5.3
6.6
6.3
5.4
o3
0.04
0.03
0.02
0.02
0.03
0.02
0.02
0.03
no2
0.01
0.01
0.01
0.01
0.01
0.01
0.01
0.01
no
0
0
0
0
0
0
0
0
pm25
1.9
2.4
4.5
5.4
3.7
4.6
3.5
2.1
Burnaby South
2016-03 2020-05
index
2020-05
2020-04
2020-03
2020-02
2020-01
2019-12
2019-11
2019-10
2019-09
2019-08
2019-07
2019-06
2019-05
2019-04
2019-03
2019-02
2019-01
2018-12
2018-11
2018-10
2018-09
2018-08
2018-07
2018-06
2018-05
2018-04
2018-03
2018-02
2018-01
2017-12
2017-11
2017-10
2017-09
2017-08
2017-07
2017-06
2017-05
2017-04
2017-03
2017-02
2017-01
2016-12
2016-11
2016-10
2016-09
2016-08
2016-07
2016-06
2016-05
2016-04
2016-03
o3:ppm
0.03
0.03
0.02
0.01
0.02
0.01
0.01
0.01
0.02
0.02
0.02
0.02
0.02
0.03
0.02
0.02
0.01
0.02
0.02
0.01
0.01
0.02
0.02
0.02
0.03
0.03
0.02
0.02
0.01
0.01
0.02
0.02
0.02
0.02
0.03
0.03
0.03
0.03
0.03
0.02
0.01
0.01
0.02
0.02
0.01
0.02
0.02
0.02
0.03
0.02
0.02
pm25
4.6
4.9
4.6
4.5
2.7
4.6
7.2
6.1
3.2
6.2
5
4.7
5.8
4.2
5.1
4.8
5.5
3.8
6
7.5
5.7
35
-
-
-
-
-
-
-
-
-
-
-
-
-
-
-
-
-
-
-
-
-
-
-
-
-
-
-
-
-
Kensington Park
2016-03 2020-05
index
2020-05
2020-04
2020-03
2020-02
2020-01
2019-12
2019-11
2019-10
2019-09
2019-08
2019-07
2019-06
2019-05
2019-04
2019-03
2019-02
2019-01
2018-12
2018-11
2018-10
2018-09
2018-08
2018-07
2018-06
2018-05
2018-04
2018-03
2018-02
2018-01
2017-12
2017-11
2017-10
2017-09
2017-08
2017-07
2017-06
2017-05
2017-04
2017-03
2017-02
2017-01
2016-12
2016-11
2016-10
2016-09
2016-08
2016-07
2016-06
2016-05
2016-04
2016-03
pm25
4.2
4.5
3.9
3.8
2.3
3.3
5.8
5
4.1
5.6
3.7
4.3
5.5
3.3
4.7
4.5
4.2
3.3
4.5
6.1
4.3
22
6.5
4.4
5.7
4.1
4.3
3.9
4.7
6.3
5.1
4.9
9
11
6.2
4.8
4.9
3.4
2.8
4.7
4.4
4.7
2.3
2.7
4
5.4
5.1
5.3
5.6
6.7
3.6
o3:ppm
0.03
0.03
0.02
0.01
0.02
0.01
0.01
0.01
0.01
0.02
0.02
0.02
0.02
0.03
0.03
0.02
0.01
0.02
0.02
0.01
0.01
0.02
0.02
0.02
0.03
0.03
0.02
0.02
0.02
0.01
0.02
0.01
0.02
0.02
0.02
0.02
0.02
0.03
0.03
0.02
0.02
0.01
0.02
0.02
0.01
0.02
0.02
0.02
0.03
0.03
0.02
* Pollution data source:
https://openaq.org
(AirNow)
The data is licensed under CC-By 4.0
PM2,5 2 (Bagus)
CO 0 (Bagus)
SO2 0 (Bagus)
O3 0 (Bagus)
NO2 0 (Bagus)
0 (Bagus)
PM10 6 (Bagus)
Data tentang polusi udara dari beberapa hari terakhir di Burnaby
| index | 2024-04-09 | 2024-04-10 | 2024-04-11 | 2024-04-12 | 2024-04-13 | 2024-04-14 | 2024-04-15 | 2024-04-16 |
|---|---|---|---|---|---|---|---|---|
| so2 | 0 Good |
0 Good |
0 Good |
0 Good |
0 Good |
0 Good |
0 Good |
0 Good |
| o3 | 0 Good |
0 Good |
0 Good |
0 Good |
0 Good |
0 Good |
0 Good |
0 Good |
| co | 0 Good |
0 Good |
0 Good |
0 Good |
0 Good |
0 Good |
0 Good |
0 Good |
| no | 0 Good |
0 Good |
0 Good |
0 Good |
0 Good |
0 Good |
0 Good |
0 Good |
| no2 | 0 Good |
0 Good |
0 Good |
0 Good |
0 Good |
0 Good |
0 Good |
0 Good |
| pm25 | 2 Good |
3 Good |
5 Good |
4 Good |
4 Good |
4 Good |
3 Good |
2 Good |
| pm10 | 5 Good |
6 Good |
7 Good |
5 Good |
7 Good |
9 Good |
8 Good |
7 Good |

| index | 2020-05 | 2020-04 | 2020-03 | 2020-02 | 2020-01 | 2019-12 | 2019-11 | 2019-10 | 2019-09 | 2019-08 | 2019-07 | 2019-06 | 2019-05 | 2019-04 | 2019-03 | 2019-02 | 2019-01 | 2018-12 | 2018-11 | 2018-10 | 2018-09 | 2018-08 | 2018-07 | 2018-06 | 2018-05 | 2018-04 | 2018-03 | 2018-02 | 2018-01 | 2017-12 | 2017-11 | 2017-10 | 2017-09 | 2017-08 | 2017-07 | 2017-06 | 2017-05 | 2017-04 | 2017-03 | 2017-02 | 2017-01 | 2016-12 | 2016-11 | 2016-10 | 2016-09 | 2016-08 | 2016-07 | 2016-06 | 2016-05 | 2016-04 | 2016-03 |
|---|---|---|---|---|---|---|---|---|---|---|---|---|---|---|---|---|---|---|---|---|---|---|---|---|---|---|---|---|---|---|---|---|---|---|---|---|---|---|---|---|---|---|---|---|---|---|---|---|---|---|---|
| o3:ppm | 0.03 (Good) | 0.03 (Good) | 0.02 (Good) | 0.01 (Good) | 0.02 (Good) | 0.01 (Good) | 0.01 (Good) | 0.01 (Good) | 0.01 (Good) | 0.02 (Good) | 0.02 (Good) | 0.02 (Good) | 0.02 (Good) | 0.03 (Good) | 0.02 (Good) | 0.02 (Good) | 0.01 (Good) | 0.02 (Good) | 0.02 (Good) | 0.01 (Good) | 0.01 (Good) | 0.02 (Good) | 0.02 (Good) | 0.02 (Good) | 0.03 (Good) | 0.03 (Good) | 0.02 (Good) | 0.02 (Good) | 0.02 (Good) | 0.01 (Good) | 0.02 (Good) | 0.01 (Good) | 0.02 (Good) | 0.02 (Good) | 0.02 (Good) | 0.02 (Good) | 0.03 (Good) | 0.03 (Good) | 0.03 (Good) | 0.02 (Good) | 0.02 (Good) | 0.01 (Good) | 0.02 (Good) | 0.02 (Good) | 0.01 (Good) | 0.02 (Good) | 0.02 (Good) | 0.02 (Good) | 0.03 (Good) | 0.02 (Good) | 0.02 (Good) |
| pm25 | 4.4 (Good) | 4.7 (Good) | 4.2 (Good) | 4.1 (Good) | 2.5 (Good) | 3.9 (Good) | 6.5 (Good) | 5.6 (Good) | 3.6 (Good) | 5.9 (Good) | 4.4 (Good) | 4.5 (Good) | 5.7 (Good) | 3.7 (Good) | 4.9 (Good) | 4.6 (Good) | 4.8 (Good) | 3.5 (Good) | 5.2 (Good) | 6.8 (Good) | 5 (Good) | 29 (Moderate) | 6.5 (Good) | 4.4 (Good) | 5.7 (Good) | 4.1 (Good) | 4.3 (Good) | 3.9 (Good) | 4.7 (Good) | 6.3 (Good) | 5.1 (Good) | 4.9 (Good) | 9 (Good) | 11 (Good) | 6.2 (Good) | 4.8 (Good) | 4.9 (Good) | 3.4 (Good) | 2.8 (Good) | 4.7 (Good) | 4.4 (Good) | 4.7 (Good) | 2.3 (Good) | 2.7 (Good) | 4 (Good) | 5.4 (Good) | 5.1 (Good) | 5.3 (Good) | 5.6 (Good) | 6.7 (Good) | 3.6 (Good) |
Hijau dan taman di kota
Burnaby 73%
Amerika Serikat: 70% Venezuela: 41% Islandia: 72%partikulat Matter PM 2.5
Burnaby 7 (Good)
Kenikmatan menghabiskan waktu di kota
Burnaby 76%
Amerika Serikat: 75% Bahama: 53% Venezuela: 41% Islandia: 89%partikulat Matter PM10
Burnaby 9 (Good)
Polusi udara
Burnaby 25%
Amerika Serikat: 29% Bahama: 52% Venezuela: 59% Islandia: 13%Pembuangan sampah
Burnaby 86%
Amerika Serikat: 71% Bahama: 29% Venezuela: 18% Islandia: 79%Ketersediaan dan kualitas air minum
Burnaby 84%
Amerika Serikat: 71% Bahama: 55% Venezuela: 28% Islandia: 96%Kebersihan dan kerasnya
Burnaby 72%
Amerika Serikat: 60% Bahama: 35% Venezuela: 22% Islandia: 75%Kebisingan dan polusi cahaya
Burnaby 57%
Amerika Serikat: 47% Bahama: 39% Venezuela: 47% Islandia: 23%Polusi air
Burnaby 44%
Amerika Serikat: 44% Bahama: 58% Venezuela: 76% Islandia: 8,4%PM2,5 2.1 (Bagus)
partikulat Matter (PM 2.5) debuCO 0.2 (Bagus)
karbon monoksida (CO)SO2 0 (Bagus)
sulfur dioksida (SO2)O3 0.04 (Bagus)
ozon (O3)NO2 0 (Bagus)
nitrogen dioksida (NO2)0 (Bagus)
index_name_noSO2 0 (Bagus)
sulfur dioksida (SO2)PM10 6 (Bagus)
partikulat Matter (PM10) debu tersuspensiNO2 0.01 (Bagus)
nitrogen dioksida (NO2)O3 0.03 (Bagus)
ozon (O3)PM2,5 1.6 (Bagus)
partikulat Matter (PM 2.5) debu0 (Bagus)
index_name_noBurnaby South
| index | 2024-04-16 | 2024-04-15 | 2024-04-14 | 2024-04-13 | 2024-04-12 | 2024-04-11 | 2024-04-10 | 2024-04-09 |
|---|---|---|---|---|---|---|---|---|
| so2 | 0 | 0 | 0 | 0 | 0 | 0 | 0 | 0 |
| o3 | 0.04 | 0.04 | 0.02 | 0.02 | 0.03 | 0.03 | 0.03 | 0.03 |
| co | 0.2 | 0.2 | 0.24 | 0.23 | 0.2 | 0.2 | 0.2 | 0.21 |
| no | 0 | 0 | 0 | 0 | 0 | 0 | 0 | 0 |
| no2 | 0 | 0.01 | 0.01 | 0.01 | 0.01 | 0.01 | 0.01 | 0.01 |
| pm25 | 1.7 | 3.7 | 4.3 | 2.6 | 4 | 4.7 | 2.9 | 1.6 |
Kensington Park
| index | 2024-04-16 | 2024-04-15 | 2024-04-14 | 2024-04-13 | 2024-04-12 | 2024-04-11 | 2024-04-10 | 2024-04-09 |
|---|---|---|---|---|---|---|---|---|
| so2 | 0 | 0 | 0 | 0 | 0 | 0 | 0 | 0 |
| pm10 | 6.5 | 8 | 9.3 | 7.2 | 5.3 | 6.6 | 6.3 | 5.4 |
| o3 | 0.04 | 0.03 | 0.02 | 0.02 | 0.03 | 0.02 | 0.02 | 0.03 |
| no2 | 0.01 | 0.01 | 0.01 | 0.01 | 0.01 | 0.01 | 0.01 | 0.01 |
| no | 0 | 0 | 0 | 0 | 0 | 0 | 0 | 0 |
| pm25 | 1.9 | 2.4 | 4.5 | 5.4 | 3.7 | 4.6 | 3.5 | 2.1 |
Burnaby South

| index | 2020-05 | 2020-04 | 2020-03 | 2020-02 | 2020-01 | 2019-12 | 2019-11 | 2019-10 | 2019-09 | 2019-08 | 2019-07 | 2019-06 | 2019-05 | 2019-04 | 2019-03 | 2019-02 | 2019-01 | 2018-12 | 2018-11 | 2018-10 | 2018-09 | 2018-08 | 2018-07 | 2018-06 | 2018-05 | 2018-04 | 2018-03 | 2018-02 | 2018-01 | 2017-12 | 2017-11 | 2017-10 | 2017-09 | 2017-08 | 2017-07 | 2017-06 | 2017-05 | 2017-04 | 2017-03 | 2017-02 | 2017-01 | 2016-12 | 2016-11 | 2016-10 | 2016-09 | 2016-08 | 2016-07 | 2016-06 | 2016-05 | 2016-04 | 2016-03 |
|---|---|---|---|---|---|---|---|---|---|---|---|---|---|---|---|---|---|---|---|---|---|---|---|---|---|---|---|---|---|---|---|---|---|---|---|---|---|---|---|---|---|---|---|---|---|---|---|---|---|---|---|
| o3:ppm | 0.03 | 0.03 | 0.02 | 0.01 | 0.02 | 0.01 | 0.01 | 0.01 | 0.02 | 0.02 | 0.02 | 0.02 | 0.02 | 0.03 | 0.02 | 0.02 | 0.01 | 0.02 | 0.02 | 0.01 | 0.01 | 0.02 | 0.02 | 0.02 | 0.03 | 0.03 | 0.02 | 0.02 | 0.01 | 0.01 | 0.02 | 0.02 | 0.02 | 0.02 | 0.03 | 0.03 | 0.03 | 0.03 | 0.03 | 0.02 | 0.01 | 0.01 | 0.02 | 0.02 | 0.01 | 0.02 | 0.02 | 0.02 | 0.03 | 0.02 | 0.02 |
| pm25 | 4.6 | 4.9 | 4.6 | 4.5 | 2.7 | 4.6 | 7.2 | 6.1 | 3.2 | 6.2 | 5 | 4.7 | 5.8 | 4.2 | 5.1 | 4.8 | 5.5 | 3.8 | 6 | 7.5 | 5.7 | 35 | - | - | - | - | - | - | - | - | - | - | - | - | - | - | - | - | - | - | - | - | - | - | - | - | - | - | - | - | - |
Kensington Park

| index | 2020-05 | 2020-04 | 2020-03 | 2020-02 | 2020-01 | 2019-12 | 2019-11 | 2019-10 | 2019-09 | 2019-08 | 2019-07 | 2019-06 | 2019-05 | 2019-04 | 2019-03 | 2019-02 | 2019-01 | 2018-12 | 2018-11 | 2018-10 | 2018-09 | 2018-08 | 2018-07 | 2018-06 | 2018-05 | 2018-04 | 2018-03 | 2018-02 | 2018-01 | 2017-12 | 2017-11 | 2017-10 | 2017-09 | 2017-08 | 2017-07 | 2017-06 | 2017-05 | 2017-04 | 2017-03 | 2017-02 | 2017-01 | 2016-12 | 2016-11 | 2016-10 | 2016-09 | 2016-08 | 2016-07 | 2016-06 | 2016-05 | 2016-04 | 2016-03 |
|---|---|---|---|---|---|---|---|---|---|---|---|---|---|---|---|---|---|---|---|---|---|---|---|---|---|---|---|---|---|---|---|---|---|---|---|---|---|---|---|---|---|---|---|---|---|---|---|---|---|---|---|
| pm25 | 4.2 | 4.5 | 3.9 | 3.8 | 2.3 | 3.3 | 5.8 | 5 | 4.1 | 5.6 | 3.7 | 4.3 | 5.5 | 3.3 | 4.7 | 4.5 | 4.2 | 3.3 | 4.5 | 6.1 | 4.3 | 22 | 6.5 | 4.4 | 5.7 | 4.1 | 4.3 | 3.9 | 4.7 | 6.3 | 5.1 | 4.9 | 9 | 11 | 6.2 | 4.8 | 4.9 | 3.4 | 2.8 | 4.7 | 4.4 | 4.7 | 2.3 | 2.7 | 4 | 5.4 | 5.1 | 5.3 | 5.6 | 6.7 | 3.6 |
| o3:ppm | 0.03 | 0.03 | 0.02 | 0.01 | 0.02 | 0.01 | 0.01 | 0.01 | 0.01 | 0.02 | 0.02 | 0.02 | 0.02 | 0.03 | 0.03 | 0.02 | 0.01 | 0.02 | 0.02 | 0.01 | 0.01 | 0.02 | 0.02 | 0.02 | 0.03 | 0.03 | 0.02 | 0.02 | 0.02 | 0.01 | 0.02 | 0.01 | 0.02 | 0.02 | 0.02 | 0.02 | 0.02 | 0.03 | 0.03 | 0.02 | 0.02 | 0.01 | 0.02 | 0.02 | 0.01 | 0.02 | 0.02 | 0.02 | 0.03 | 0.03 | 0.02 |