Polusi udara di Walloon Brabant Province: indeks kualitas udara real-time dan siaga asap.
Perkiraan kualitas polusi dan udara untuk Walloon Brabant Province. Hari ini Sabtu, 20 Juni 2026. Nilai polusi udara berikut telah tercatat untuk Walloon Brabant Province:- ozon (O3) - -1 (Bagus)
- partikulat Matter (PM 2.5) debu - 31 (Moderat)
- partikulat Matter (PM10) debu tersuspensi - 141 (Sangat tidak sehat)
- sulfur dioksida (SO2) - 7 (Bagus)
- nitrogen dioksida (NO2) - 89 (Moderat)
- karbon monoksida (CO) - 1700 (Bagus)
- karbon hitam (BC) - 1 (Bagus)

Apa kualitas udara di Walloon Brabant Province hari ini? Apakah udara tercemar di Walloon Brabant Province?. Apakah ada Smog?
Bagaimana tingkat O3 hari ini di Walloon Brabant Province? (ozon (O3))
-1 (Bagus)
Apa tingkat saat PM 2,5 in Walloon Brabant Province? (partikulat Matter (PM 2.5) debu)
Hari ini PM 2.5 tingkat:
31 (Moderat)
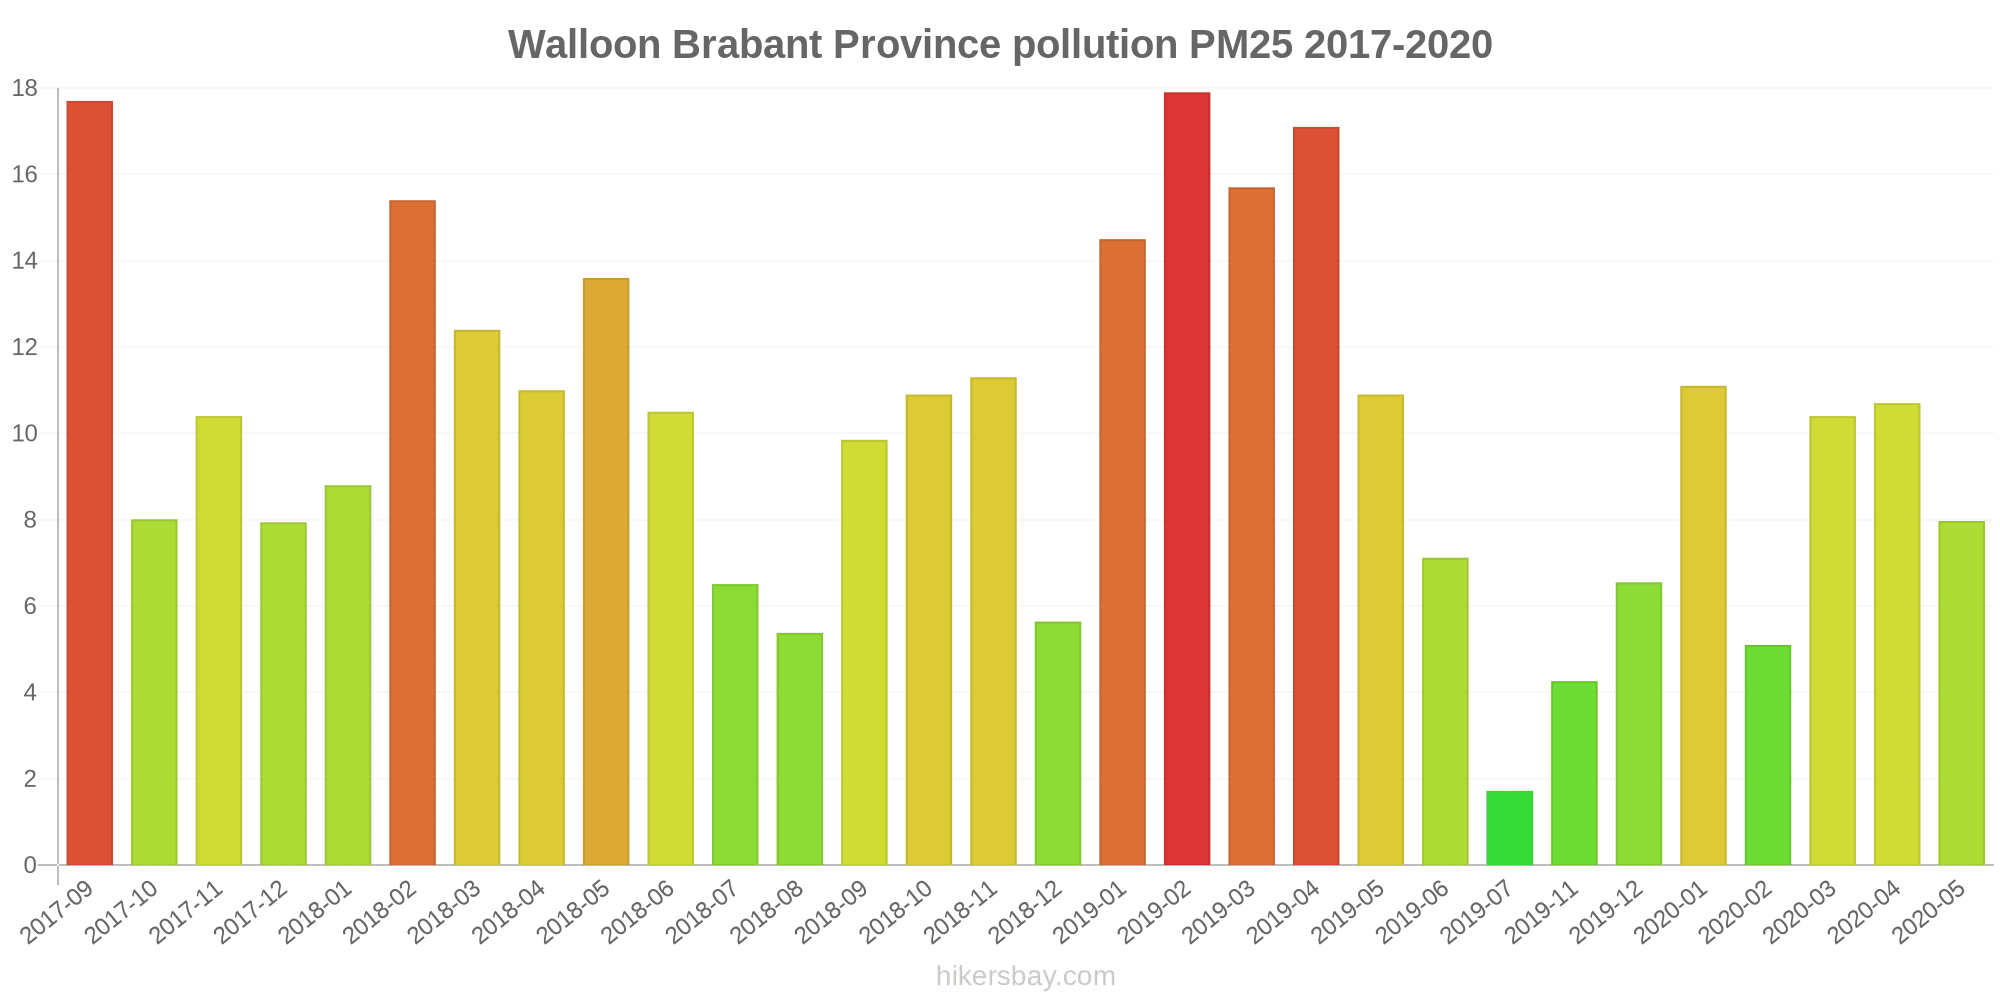
Nilai tertinggi PM 2.5 direkam: 18 (Februari 2019).
Tingkat terendah dari partikulat Matter PM 2.5 polusi terjadi di bulan: Juli (1.7).
Apa tingkat PM10 hari ini di Walloon Brabant Province? (partikulat Matter (PM10) debu tersuspensi)
Level saat ini dari partikulat Matter PM10 di Walloon Brabant Province adalah:
141 (Sangat tidak sehat)
Nilai PM10 tertinggi biasanya terjadi di bulan: 27 (Februari 2019).
Nilai terendah dari partikulat PM10 pencemaran Walloon Brabant Province biasanya dicatat di: Juli (3).
Apa tingkat polusi SO2? (sulfur dioksida (SO2))
7 (Bagus)
Seberapa tinggi tingkat NO2? (nitrogen dioksida (NO2))
89 (Moderat)
Seberapa tinggi tingkat CO? (karbon monoksida (CO))
1700 (Bagus)
Apa tingkat polusi karbon hitam? (karbon hitam (BC))
1 (Bagus)
Data saat ini Jumat, 27 Mei 2022 14.15
O3 -1 (Bagus)
PM2,5 31 (Moderat)
PM10 141 (Sangat tidak sehat)
SO2 7 (Bagus)
NO2 89 (Moderat)
CO 1700 (Bagus)
BC 1 (Bagus)
Data tentang polusi udara dari beberapa hari terakhir di Walloon Brabant Province
index
2022-05-27
o3
4
Good
pm25
-64
Good
pm10
-34
Good
so2
5
Good
no2
-121
Good
co
735
Good
bc
1
Good
data source »
Polusi udara di Walloon Brabant Province dari September 2017 ke Mei 2020

index
2020-05
2020-04
2020-03
2020-02
2020-01
2019-12
2019-11
2019-10
2019-09
2019-07
2019-06
2019-05
2019-04
2019-03
2019-02
2019-01
2018-12
2018-11
2018-10
2018-09
2018-08
2018-07
2018-06
2018-05
2018-04
2018-03
2018-02
2018-01
2017-12
2017-11
2017-10
2017-09
so2
1 (Good)
0.98 (Good)
1 (Good)
1 (Good)
0.84 (Good)
0.83 (Good)
0.57 (Good)
0.41 (Good)
0.71 (Good)
1.4 (Good)
1.8 (Good)
0.99 (Good)
0.77 (Good)
0.93 (Good)
0.89 (Good)
1 (Good)
0.95 (Good)
0.51 (Good)
- (Good)
- (Good)
0.83 (Good)
0.89 (Good)
- (Good)
1 (Good)
1.7 (Good)
1.4 (Good)
1.5 (Good)
1.9 (Good)
1.3 (Good)
1.4 (Good)
1.1 (Good)
0.95 (Good)
co
0.19 (Good)
0.21 (Good)
0.24 (Good)
0.19 (Good)
0.24 (Good)
0.15 (Good)
0.13 (Good)
0.08 (Good)
0.13 (Good)
0.07 (Good)
0.15 (Good)
0.2 (Good)
0.24 (Good)
0.23 (Good)
0.28 (Good)
0.24 (Good)
0.2 (Good)
0.25 (Good)
0.2 (Good)
0.18 (Good)
0.15 (Good)
0.15 (Good)
0.14 (Good)
0.18 (Good)
0.2 (Good)
0.25 (Good)
0.29 (Good)
0.2 (Good)
0.22 (Good)
6.9 (Good)
20 (Good)
25 (Good)
o3
63 (Good)
60 (Good)
59 (Good)
62 (Good)
43 (Good)
25 (Good)
17 (Good)
19 (Good)
25 (Good)
24 (Good)
50 (Good)
47 (Good)
50 (Good)
55 (Good)
27 (Good)
39 (Good)
43 (Good)
32 (Good)
29 (Good)
35 (Good)
41 (Good)
50 (Good)
43 (Good)
47 (Good)
58 (Good)
54 (Good)
38 (Good)
48 (Good)
37 (Good)
31 (Good)
35 (Good)
21 (Good)
pm25
8 (Good)
11 (Good)
10 (Good)
5.1 (Good)
11 (Good)
6.5 (Good)
4.3 (Good)
- (Good)
- (Good)
1.7 (Good)
7.1 (Good)
11 (Good)
17 (Moderate)
16 (Moderate)
18 (Moderate)
15 (Moderate)
5.6 (Good)
11 (Good)
11 (Good)
9.8 (Good)
5.4 (Good)
6.5 (Good)
11 (Good)
14 (Moderate)
11 (Good)
12 (Good)
15 (Moderate)
8.8 (Good)
7.9 (Good)
10 (Good)
8 (Good)
18 (Moderate)
pm10
12 (Good)
19 (Good)
13 (Good)
5.7 (Good)
15 (Good)
7.6 (Good)
5.2 (Good)
8.3 (Good)
- (Good)
3 (Good)
11 (Good)
15 (Good)
23 (Moderate)
19 (Good)
27 (Moderate)
16 (Good)
8.4 (Good)
13 (Good)
17 (Good)
17 (Good)
11 (Good)
18 (Good)
19 (Good)
24 (Moderate)
17 (Good)
17 (Good)
20 (Moderate)
11 (Good)
11 (Good)
15 (Good)
13 (Good)
25 (Moderate)
no2
11 (Good)
14 (Good)
9.1 (Good)
7 (Good)
13 (Good)
7.7 (Good)
7.5 (Good)
4.6 (Good)
9.1 (Good)
5.8 (Good)
11 (Good)
14 (Good)
15 (Good)
12 (Good)
26 (Good)
20 (Good)
8.7 (Good)
16 (Good)
15 (Good)
16 (Good)
13 (Good)
18 (Good)
11 (Good)
15 (Good)
14 (Good)
14 (Good)
20 (Good)
11 (Good)
15 (Good)
19 (Good)
11 (Good)
17 (Good)
data source »
Kualitas hidup di Walloon Brabant Province
Hijau dan taman di kota
Walloon Brabant Province
50%
Luksemburg: 83%
Belanda: 82%
Jerman: 78%
Swiss: 76%
Prancis: 61%
partikulat Matter PM 2.5
Walloon Brabant Province
14 (Moderate)
Kenikmatan menghabiskan waktu di kota
Walloon Brabant Province
75%
Luksemburg: 85%
Belanda: 88%
Jerman: 80%
Swiss: 84%
Prancis: 68%
partikulat Matter PM10
Walloon Brabant Province
21 (Moderate)
Polusi udara
Walloon Brabant Province
28%
Luksemburg: 19%
Belanda: 21%
Jerman: 25%
Swiss: 20%
Prancis: 36%
Pembuangan sampah
Walloon Brabant Province
88%
Luksemburg: 84%
Belanda: 79%
Jerman: 74%
Swiss: 82%
Prancis: 59%
Ketersediaan dan kualitas air minum
Walloon Brabant Province
75%
Luksemburg: 83%
Belanda: 92%
Jerman: 82%
Swiss: 90%
Prancis: 73%
Kebersihan dan kerasnya
Walloon Brabant Province
50%
Luksemburg: 82%
Belanda: 77%
Jerman: 65%
Swiss: 82%
Prancis: 48%
Kebisingan dan polusi cahaya
Walloon Brabant Province
38%
Luksemburg: 29%
Belanda: 31%
Jerman: 42%
Swiss: 38%
Prancis: 54%
Polusi air
Walloon Brabant Province
75%
Luksemburg: 19%
Belanda: 17%
Jerman: 23%
Swiss: 19%
Prancis: 39%
Source: Numbeo
43N063 - CORROY L.G.
Jumat, 27 Mei 2022 14.15
O3 -1 (Bagus)
ozon (O3)
PM2,5 31 (Moderat)
partikulat Matter (PM 2.5) debu
PM10 141 (Sangat tidak sehat)
partikulat Matter (PM10) debu tersuspensi
SO2 6.5 (Bagus)
sulfur dioksida (SO2)
NO2 89 (Moderat)
nitrogen dioksida (NO2)
CO 1700 (Bagus)
karbon monoksida (CO)
BC 1.4 (Bagus)
karbon hitam (BC)
43N063 - CORROY L.G.
index
2022-05-27
o3
3.7
pm25
-64
pm10
-34.08
so2
5.1
no2
-121.45
co
735
bc
1.4
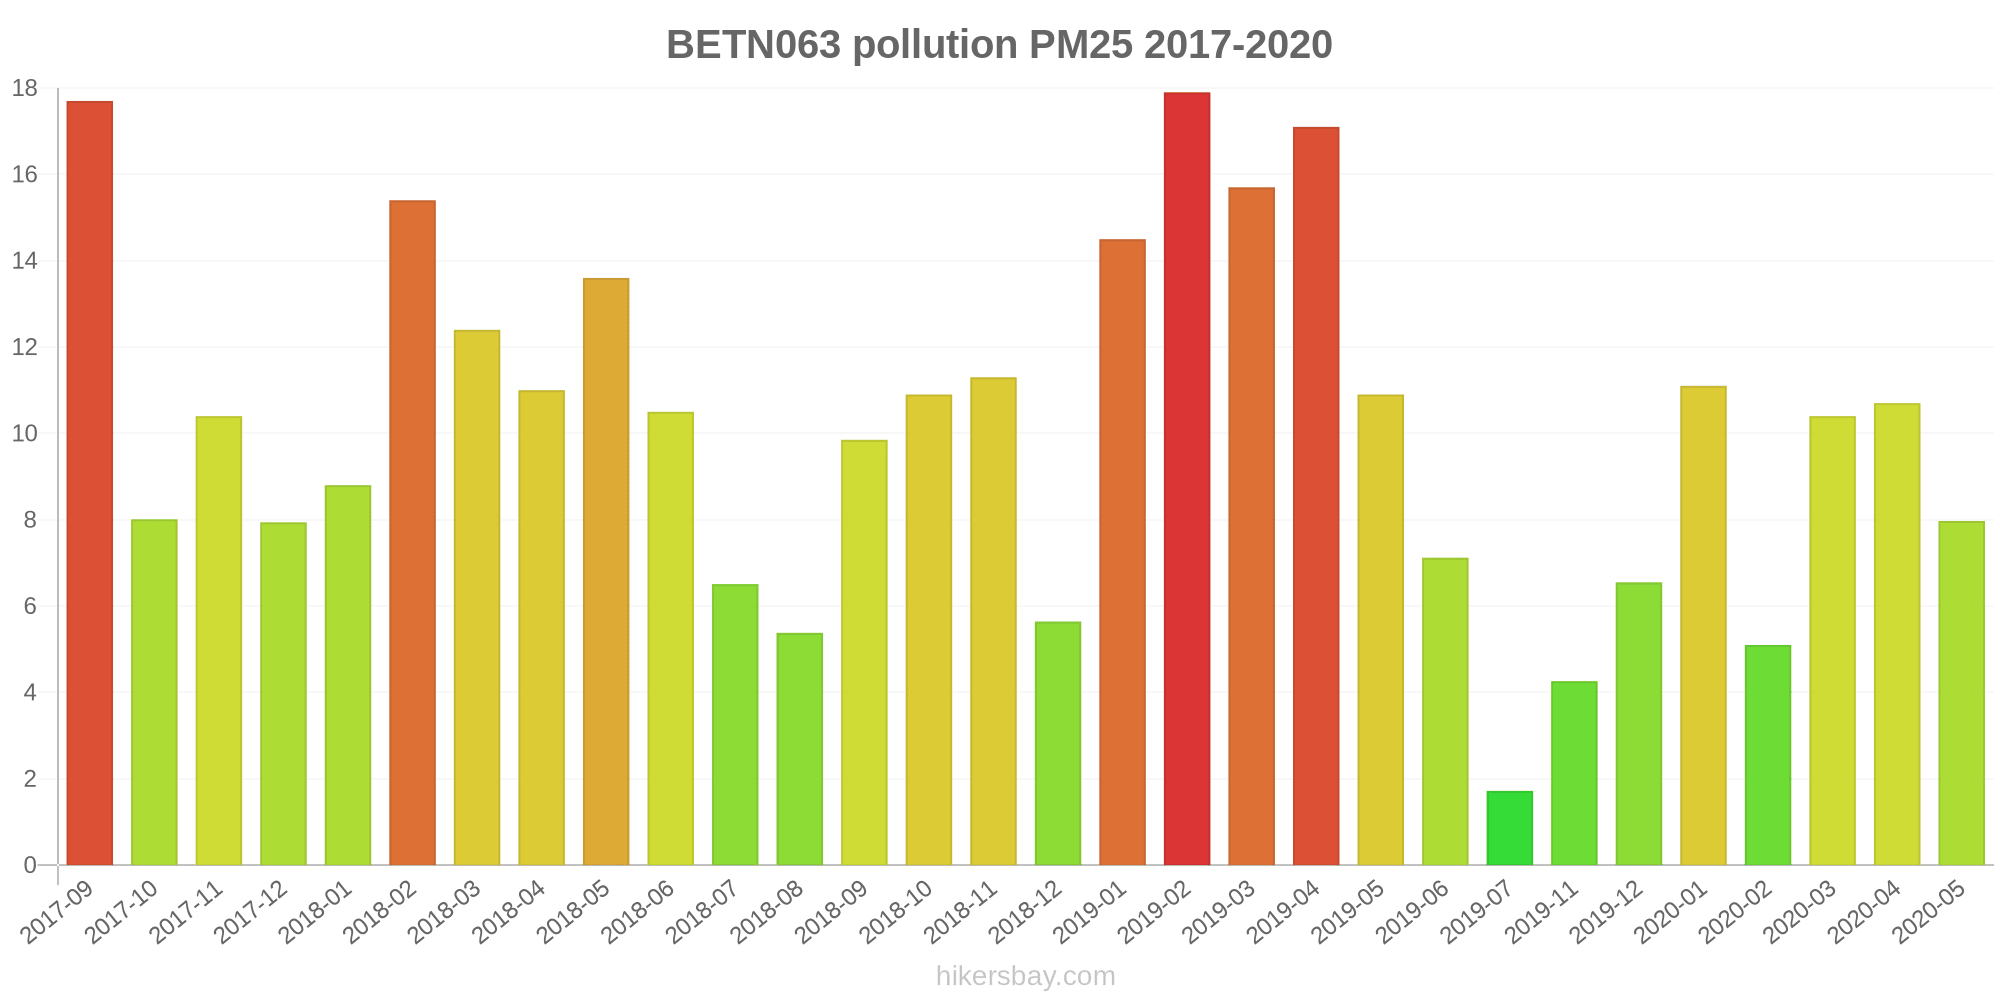
BETN063
2017-09 2020-05

index
2020-05
2020-04
2020-03
2020-02
2020-01
2019-12
2019-11
2019-10
2019-09
2019-07
2019-06
2019-05
2019-04
2019-03
2019-02
2019-01
2018-12
2018-11
2018-10
2018-09
2018-08
2018-07
2018-06
2018-05
2018-04
2018-03
2018-02
2018-01
2017-12
2017-11
2017-10
2017-09
pm25
8
11
10
5.1
11
6.5
4.3
-
-
1.7
7.1
11
17
16
18
15
5.6
11
11
9.8
5.4
6.5
11
14
11
12
15
8.8
7.9
10
8
18
pm10
12
19
13
5.7
15
7.6
5.2
8.3
-
3
11
15
23
19
27
16
8.4
13
17
17
11
18
19
24
17
17
20
11
11
15
13
25
co
0.19
0.21
0.24
0.19
0.24
0.15
0.13
0.08
0.13
0.07
0.15
0.2
0.24
0.23
0.28
0.24
0.2
0.25
0.2
0.18
0.15
0.15
0.14
0.18
0.2
0.25
0.29
0.2
0.22
6.9
20
25
so2
1
0.98
1
1
0.84
0.83
0.57
0.41
0.71
1.4
1.8
0.99
0.77
0.93
0.89
1
0.95
0.51
-
-
0.83
0.89
-
1
1.7
1.4
1.5
1.9
1.3
1.4
1.1
0.95
no2
11
14
9.1
7
13
7.7
7.5
4.6
9.1
5.8
11
14
15
12
26
20
8.7
16
15
16
13
18
11
15
14
14
20
11
15
19
11
17
o3
63
60
59
62
43
25
17
19
25
24
50
47
50
55
27
39
43
32
29
35
41
50
43
47
58
54
38
48
37
31
35
21
* Pollution data source:
https://openaq.org
(EEA Belgium)
The data is licensed under CC-By 4.0
O3 -1 (Bagus)
PM2,5 31 (Moderat)
PM10 141 (Sangat tidak sehat)
SO2 7 (Bagus)
NO2 89 (Moderat)
CO 1700 (Bagus)
BC 1 (Bagus)
Data tentang polusi udara dari beberapa hari terakhir di Walloon Brabant Province
| index | 2022-05-27 |
|---|---|
| o3 | 4 Good |
| pm25 | -64 Good |
| pm10 | -34 Good |
| so2 | 5 Good |
| no2 | -121 Good |
| co | 735 Good |
| bc | 1 Good |
| index | 2020-05 | 2020-04 | 2020-03 | 2020-02 | 2020-01 | 2019-12 | 2019-11 | 2019-10 | 2019-09 | 2019-07 | 2019-06 | 2019-05 | 2019-04 | 2019-03 | 2019-02 | 2019-01 | 2018-12 | 2018-11 | 2018-10 | 2018-09 | 2018-08 | 2018-07 | 2018-06 | 2018-05 | 2018-04 | 2018-03 | 2018-02 | 2018-01 | 2017-12 | 2017-11 | 2017-10 | 2017-09 |
|---|---|---|---|---|---|---|---|---|---|---|---|---|---|---|---|---|---|---|---|---|---|---|---|---|---|---|---|---|---|---|---|---|
| so2 | 1 (Good) | 0.98 (Good) | 1 (Good) | 1 (Good) | 0.84 (Good) | 0.83 (Good) | 0.57 (Good) | 0.41 (Good) | 0.71 (Good) | 1.4 (Good) | 1.8 (Good) | 0.99 (Good) | 0.77 (Good) | 0.93 (Good) | 0.89 (Good) | 1 (Good) | 0.95 (Good) | 0.51 (Good) | - (Good) | - (Good) | 0.83 (Good) | 0.89 (Good) | - (Good) | 1 (Good) | 1.7 (Good) | 1.4 (Good) | 1.5 (Good) | 1.9 (Good) | 1.3 (Good) | 1.4 (Good) | 1.1 (Good) | 0.95 (Good) |
| co | 0.19 (Good) | 0.21 (Good) | 0.24 (Good) | 0.19 (Good) | 0.24 (Good) | 0.15 (Good) | 0.13 (Good) | 0.08 (Good) | 0.13 (Good) | 0.07 (Good) | 0.15 (Good) | 0.2 (Good) | 0.24 (Good) | 0.23 (Good) | 0.28 (Good) | 0.24 (Good) | 0.2 (Good) | 0.25 (Good) | 0.2 (Good) | 0.18 (Good) | 0.15 (Good) | 0.15 (Good) | 0.14 (Good) | 0.18 (Good) | 0.2 (Good) | 0.25 (Good) | 0.29 (Good) | 0.2 (Good) | 0.22 (Good) | 6.9 (Good) | 20 (Good) | 25 (Good) |
| o3 | 63 (Good) | 60 (Good) | 59 (Good) | 62 (Good) | 43 (Good) | 25 (Good) | 17 (Good) | 19 (Good) | 25 (Good) | 24 (Good) | 50 (Good) | 47 (Good) | 50 (Good) | 55 (Good) | 27 (Good) | 39 (Good) | 43 (Good) | 32 (Good) | 29 (Good) | 35 (Good) | 41 (Good) | 50 (Good) | 43 (Good) | 47 (Good) | 58 (Good) | 54 (Good) | 38 (Good) | 48 (Good) | 37 (Good) | 31 (Good) | 35 (Good) | 21 (Good) |
| pm25 | 8 (Good) | 11 (Good) | 10 (Good) | 5.1 (Good) | 11 (Good) | 6.5 (Good) | 4.3 (Good) | - (Good) | - (Good) | 1.7 (Good) | 7.1 (Good) | 11 (Good) | 17 (Moderate) | 16 (Moderate) | 18 (Moderate) | 15 (Moderate) | 5.6 (Good) | 11 (Good) | 11 (Good) | 9.8 (Good) | 5.4 (Good) | 6.5 (Good) | 11 (Good) | 14 (Moderate) | 11 (Good) | 12 (Good) | 15 (Moderate) | 8.8 (Good) | 7.9 (Good) | 10 (Good) | 8 (Good) | 18 (Moderate) |
| pm10 | 12 (Good) | 19 (Good) | 13 (Good) | 5.7 (Good) | 15 (Good) | 7.6 (Good) | 5.2 (Good) | 8.3 (Good) | - (Good) | 3 (Good) | 11 (Good) | 15 (Good) | 23 (Moderate) | 19 (Good) | 27 (Moderate) | 16 (Good) | 8.4 (Good) | 13 (Good) | 17 (Good) | 17 (Good) | 11 (Good) | 18 (Good) | 19 (Good) | 24 (Moderate) | 17 (Good) | 17 (Good) | 20 (Moderate) | 11 (Good) | 11 (Good) | 15 (Good) | 13 (Good) | 25 (Moderate) |
| no2 | 11 (Good) | 14 (Good) | 9.1 (Good) | 7 (Good) | 13 (Good) | 7.7 (Good) | 7.5 (Good) | 4.6 (Good) | 9.1 (Good) | 5.8 (Good) | 11 (Good) | 14 (Good) | 15 (Good) | 12 (Good) | 26 (Good) | 20 (Good) | 8.7 (Good) | 16 (Good) | 15 (Good) | 16 (Good) | 13 (Good) | 18 (Good) | 11 (Good) | 15 (Good) | 14 (Good) | 14 (Good) | 20 (Good) | 11 (Good) | 15 (Good) | 19 (Good) | 11 (Good) | 17 (Good) |
Hijau dan taman di kota
Walloon Brabant Province 50%
Luksemburg: 83% Belanda: 82% Jerman: 78% Swiss: 76% Prancis: 61%partikulat Matter PM 2.5
Walloon Brabant Province 14 (Moderate)
Kenikmatan menghabiskan waktu di kota
Walloon Brabant Province 75%
Luksemburg: 85% Belanda: 88% Jerman: 80% Swiss: 84% Prancis: 68%partikulat Matter PM10
Walloon Brabant Province 21 (Moderate)
Polusi udara
Walloon Brabant Province 28%
Luksemburg: 19% Belanda: 21% Jerman: 25% Swiss: 20% Prancis: 36%Pembuangan sampah
Walloon Brabant Province 88%
Luksemburg: 84% Belanda: 79% Jerman: 74% Swiss: 82% Prancis: 59%Ketersediaan dan kualitas air minum
Walloon Brabant Province 75%
Luksemburg: 83% Belanda: 92% Jerman: 82% Swiss: 90% Prancis: 73%Kebersihan dan kerasnya
Walloon Brabant Province 50%
Luksemburg: 82% Belanda: 77% Jerman: 65% Swiss: 82% Prancis: 48%Kebisingan dan polusi cahaya
Walloon Brabant Province 38%
Luksemburg: 29% Belanda: 31% Jerman: 42% Swiss: 38% Prancis: 54%Polusi air
Walloon Brabant Province 75%
Luksemburg: 19% Belanda: 17% Jerman: 23% Swiss: 19% Prancis: 39%O3 -1 (Bagus)
ozon (O3)PM2,5 31 (Moderat)
partikulat Matter (PM 2.5) debuPM10 141 (Sangat tidak sehat)
partikulat Matter (PM10) debu tersuspensiSO2 6.5 (Bagus)
sulfur dioksida (SO2)NO2 89 (Moderat)
nitrogen dioksida (NO2)CO 1700 (Bagus)
karbon monoksida (CO)BC 1.4 (Bagus)
karbon hitam (BC)43N063 - CORROY L.G.
| index | 2022-05-27 |
|---|---|
| o3 | 3.7 |
| pm25 | -64 |
| pm10 | -34.08 |
| so2 | 5.1 |
| no2 | -121.45 |
| co | 735 |
| bc | 1.4 |
BETN063
| index | 2020-05 | 2020-04 | 2020-03 | 2020-02 | 2020-01 | 2019-12 | 2019-11 | 2019-10 | 2019-09 | 2019-07 | 2019-06 | 2019-05 | 2019-04 | 2019-03 | 2019-02 | 2019-01 | 2018-12 | 2018-11 | 2018-10 | 2018-09 | 2018-08 | 2018-07 | 2018-06 | 2018-05 | 2018-04 | 2018-03 | 2018-02 | 2018-01 | 2017-12 | 2017-11 | 2017-10 | 2017-09 |
|---|---|---|---|---|---|---|---|---|---|---|---|---|---|---|---|---|---|---|---|---|---|---|---|---|---|---|---|---|---|---|---|---|
| pm25 | 8 | 11 | 10 | 5.1 | 11 | 6.5 | 4.3 | - | - | 1.7 | 7.1 | 11 | 17 | 16 | 18 | 15 | 5.6 | 11 | 11 | 9.8 | 5.4 | 6.5 | 11 | 14 | 11 | 12 | 15 | 8.8 | 7.9 | 10 | 8 | 18 |
| pm10 | 12 | 19 | 13 | 5.7 | 15 | 7.6 | 5.2 | 8.3 | - | 3 | 11 | 15 | 23 | 19 | 27 | 16 | 8.4 | 13 | 17 | 17 | 11 | 18 | 19 | 24 | 17 | 17 | 20 | 11 | 11 | 15 | 13 | 25 |
| co | 0.19 | 0.21 | 0.24 | 0.19 | 0.24 | 0.15 | 0.13 | 0.08 | 0.13 | 0.07 | 0.15 | 0.2 | 0.24 | 0.23 | 0.28 | 0.24 | 0.2 | 0.25 | 0.2 | 0.18 | 0.15 | 0.15 | 0.14 | 0.18 | 0.2 | 0.25 | 0.29 | 0.2 | 0.22 | 6.9 | 20 | 25 |
| so2 | 1 | 0.98 | 1 | 1 | 0.84 | 0.83 | 0.57 | 0.41 | 0.71 | 1.4 | 1.8 | 0.99 | 0.77 | 0.93 | 0.89 | 1 | 0.95 | 0.51 | - | - | 0.83 | 0.89 | - | 1 | 1.7 | 1.4 | 1.5 | 1.9 | 1.3 | 1.4 | 1.1 | 0.95 |
| no2 | 11 | 14 | 9.1 | 7 | 13 | 7.7 | 7.5 | 4.6 | 9.1 | 5.8 | 11 | 14 | 15 | 12 | 26 | 20 | 8.7 | 16 | 15 | 16 | 13 | 18 | 11 | 15 | 14 | 14 | 20 | 11 | 15 | 19 | 11 | 17 |
| o3 | 63 | 60 | 59 | 62 | 43 | 25 | 17 | 19 | 25 | 24 | 50 | 47 | 50 | 55 | 27 | 39 | 43 | 32 | 29 | 35 | 41 | 50 | 43 | 47 | 58 | 54 | 38 | 48 | 37 | 31 | 35 | 21 |