Polusi udara di Luxembourg Province: indeks kualitas udara real-time dan siaga asap.
Perkiraan kualitas polusi dan udara untuk Luxembourg Province. Hari ini Sabtu, 20 Juni 2026. Nilai polusi udara berikut telah tercatat untuk Luxembourg Province:- sulfur dioksida (SO2) - 1 (Bagus)
- ozon (O3) - 39 (Bagus)
- partikulat Matter (PM10) debu tersuspensi - 11 (Bagus)
- nitrogen dioksida (NO2) - 10 (Bagus)
- karbon monoksida (CO) - 293 (Bagus)
- partikulat Matter (PM 2.5) debu - 9 (Bagus)

Apa kualitas udara di Luxembourg Province hari ini? Apakah udara tercemar di Luxembourg Province?. Apakah ada Smog?
Apa tingkat polusi SO2? (sulfur dioksida (SO2))
1 (Bagus)
Bagaimana tingkat O3 hari ini di Luxembourg Province? (ozon (O3))
39 (Bagus)
Apa tingkat PM10 hari ini di Luxembourg Province? (partikulat Matter (PM10) debu tersuspensi)
Level saat ini dari partikulat Matter PM10 di Luxembourg Province adalah:
11 (Bagus)
Nilai PM10 tertinggi biasanya terjadi di bulan: 17 (April 2020).
Nilai terendah dari partikulat PM10 pencemaran Luxembourg Province biasanya dicatat di: Oktober (1.2).
Seberapa tinggi tingkat NO2? (nitrogen dioksida (NO2))
10 (Bagus)
Seberapa tinggi tingkat CO? (karbon monoksida (CO))
293 (Bagus)
Apa tingkat saat PM 2,5 in Luxembourg Province? (partikulat Matter (PM 2.5) debu)
Hari ini PM 2.5 tingkat:
9 (Bagus)
Sebagai perbandingan, tingkat tertinggi PM 2,5 in Luxembourg Province dalam 7 hari terakhir adalah: 14 (Kamis, 11 Januari 2024) dan Terendah: 5 (Minggu, 14 Januari 2024).
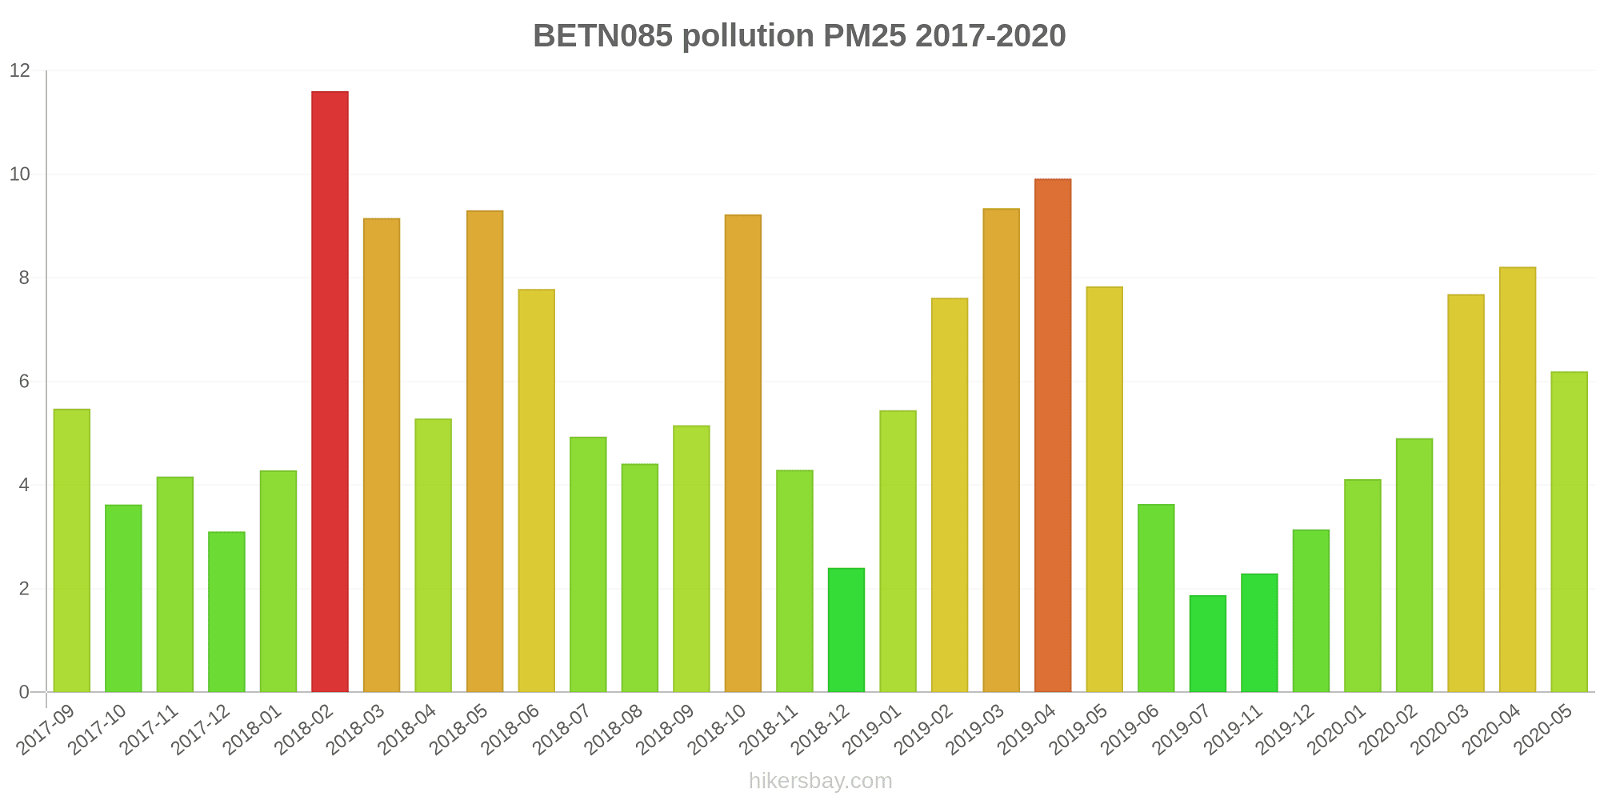
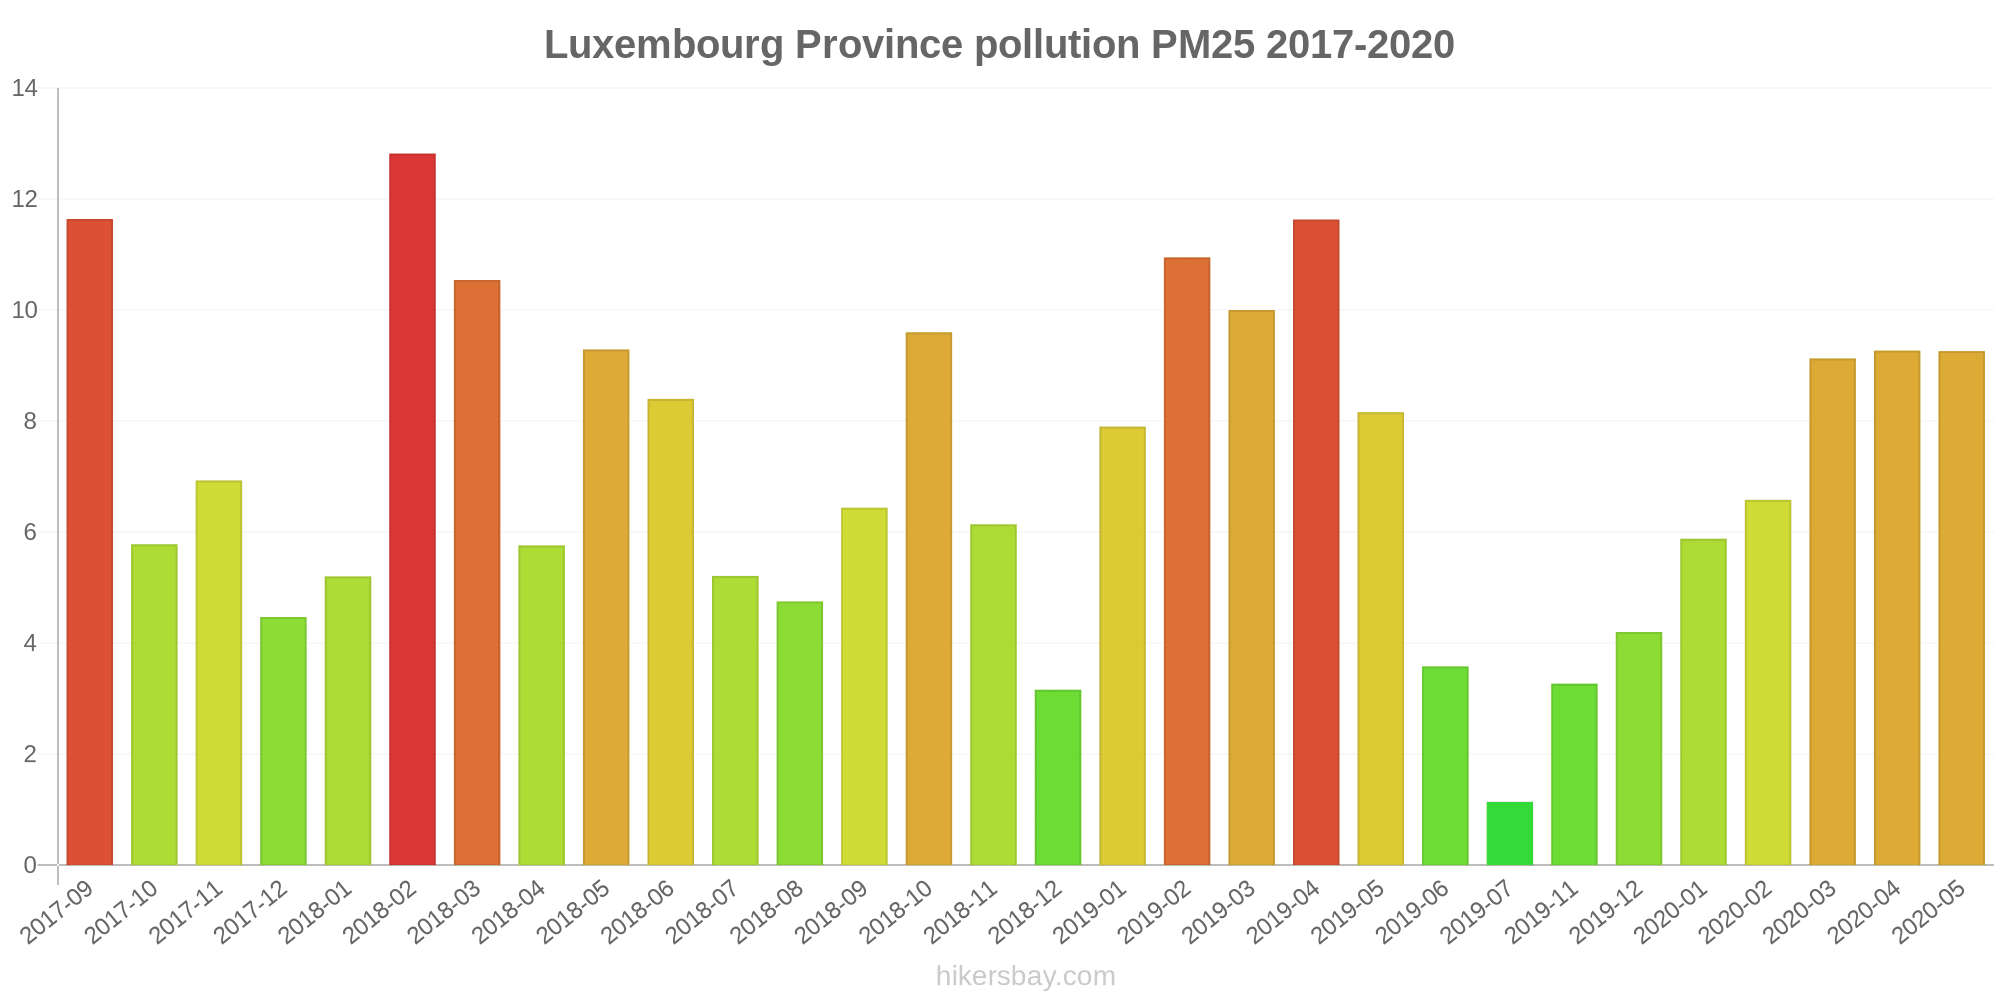
Nilai tertinggi PM 2.5 direkam: 13 (Februari 2018).
Tingkat terendah dari partikulat Matter PM 2.5 polusi terjadi di bulan: Juli (1.1).
Data saat ini Rabu, 17 Januari 2024 10.00
SO2 1 (Bagus)
O3 39 (Bagus)
PM10 11 (Bagus)
NO2 10 (Bagus)
CO 293 (Bagus)
PM2,5 9 (Bagus)
Data tentang polusi udara dari beberapa hari terakhir di Luxembourg Province
index
2024-01-10
2024-01-11
2024-01-12
2024-01-13
2024-01-14
2024-01-15
2024-01-16
2024-01-17
so2
1
Good
1
Good
1
Good
1
Good
1
Good
1
Good
1
Good
1
Good
pm10
14
Good
17
Good
9
Good
14
Good
7
Good
8
Good
9
Good
11
Good
no2
10
Good
18
Good
11
Good
3
Good
3
Good
7
Good
10
Good
13
Good
o3
40
Good
31
Good
39
Good
52
Good
39
Good
43
Good
43
Good
42
Good
pm25
11
Good
14
Moderate
6
Good
11
Good
5
Good
6
Good
6
Good
9
Good
co
251
Good
273
Good
191
Good
167
Good
195
Good
208
Good
228
Good
290
Good
data source »
Polusi udara di Luxembourg Province dari September 2017 ke Mei 2020

index
2020-05
2020-04
2020-03
2020-02
2020-01
2019-12
2019-11
2019-10
2019-09
2019-07
2019-06
2019-05
2019-04
2019-03
2019-02
2019-01
2018-12
2018-11
2018-10
2018-09
2018-08
2018-07
2018-06
2018-05
2018-04
2018-03
2018-02
2018-01
2017-12
2017-11
2017-10
2017-09
pm10
14 (Good)
17 (Good)
12 (Good)
6.7 (Good)
9.6 (Good)
4.9 (Good)
4.8 (Good)
1.2 (Good)
4 (Good)
2.8 (Good)
6.8 (Good)
10 (Good)
15 (Good)
10 (Good)
14 (Good)
10 (Good)
4.9 (Good)
8.8 (Good)
14 (Good)
9.1 (Good)
8 (Good)
11 (Good)
12 (Good)
14 (Good)
9.3 (Good)
14 (Good)
16 (Good)
6.8 (Good)
6.5 (Good)
9.5 (Good)
9.1 (Good)
15 (Good)
no2
5.2 (Good)
5.3 (Good)
4.1 (Good)
4.2 (Good)
5.5 (Good)
3.5 (Good)
3.5 (Good)
1.1 (Good)
3.4 (Good)
2.4 (Good)
4.4 (Good)
5 (Good)
5.8 (Good)
5 (Good)
6.9 (Good)
5.2 (Good)
6.5 (Good)
8.8 (Good)
7.9 (Good)
7.1 (Good)
6.7 (Good)
7.1 (Good)
5.9 (Good)
6.2 (Good)
6.2 (Good)
9.4 (Good)
12 (Good)
6.4 (Good)
8.2 (Good)
8.7 (Good)
4.9 (Good)
5.5 (Good)
co
0.17 (Good)
0.18 (Good)
0.19 (Good)
0.17 (Good)
0.19 (Good)
0.12 (Good)
0.1 (Good)
0.06 (Good)
0.12 (Good)
0.06 (Good)
0.13 (Good)
0.16 (Good)
0.2 (Good)
0.18 (Good)
0.21 (Good)
0.18 (Good)
0.19 (Good)
0.21 (Good)
0.17 (Good)
0.16 (Good)
0.14 (Good)
0.12 (Good)
0.13 (Good)
0.16 (Good)
0.17 (Good)
0.23 (Good)
0.24 (Good)
0.18 (Good)
0.19 (Good)
5 (Good)
16 (Good)
19 (Good)
o3
65 (Good)
72 (Moderate)
60 (Good)
60 (Good)
47 (Good)
29 (Good)
18 (Good)
23 (Good)
37 (Good)
32 (Good)
58 (Good)
58 (Good)
60 (Good)
58 (Good)
51 (Good)
49 (Good)
45 (Good)
35 (Good)
38 (Good)
45 (Good)
55 (Good)
77 (Moderate)
48 (Good)
66 (Good)
71 (Moderate)
58 (Good)
49 (Good)
51 (Good)
43 (Good)
35 (Good)
35 (Good)
39 (Good)
pm25
9.3 (Good)
9.3 (Good)
9.1 (Good)
6.6 (Good)
5.9 (Good)
4.2 (Good)
3.3 (Good)
- (Good)
- (Good)
1.1 (Good)
3.6 (Good)
8.2 (Good)
12 (Good)
10 (Good)
11 (Good)
7.9 (Good)
3.2 (Good)
6.1 (Good)
9.6 (Good)
6.4 (Good)
4.8 (Good)
5.2 (Good)
8.4 (Good)
9.3 (Good)
5.8 (Good)
11 (Good)
13 (Good)
5.2 (Good)
4.5 (Good)
6.9 (Good)
5.8 (Good)
12 (Good)
so2
0.96 (Good)
1.2 (Good)
1 (Good)
0.93 (Good)
0.87 (Good)
0.61 (Good)
0.4 (Good)
- (Good)
0.79 (Good)
0.81 (Good)
0.82 (Good)
0.74 (Good)
0.88 (Good)
1 (Good)
1 (Good)
0.99 (Good)
0.85 (Good)
0.61 (Good)
0.4 (Good)
1 (Good)
0.82 (Good)
0.76 (Good)
0.93 (Good)
1.1 (Good)
1.9 (Good)
2 (Good)
1.6 (Good)
1.3 (Good)
1 (Good)
1.3 (Good)
0.89 (Good)
0.95 (Good)
data source »
43N085 - VIELSALM
Rabu, 17 Januari 2024 10.00
SO2 1 (Bagus)
sulfur dioksida (SO2)
O3 50 (Bagus)
ozon (O3)
PM10 11 (Bagus)
partikulat Matter (PM10) debu tersuspensi
NO2 5.5 (Bagus)
nitrogen dioksida (NO2)
CO 215 (Bagus)
karbon monoksida (CO)
PM2,5 8.9 (Bagus)
partikulat Matter (PM 2.5) debu
43N113 - SAINT-ODE
Rabu, 17 Januari 2024 10.00
NO2 8.5 (Bagus)
nitrogen dioksida (NO2)
O3 42 (Bagus)
ozon (O3)
PM2,5 6 (Bagus)
partikulat Matter (PM 2.5) debu
PM10 7.8 (Bagus)
partikulat Matter (PM10) debu tersuspensi
43N121 - OFFAGNE
Rabu, 17 Januari 2024 10.00
PM2,5 4.1 (Bagus)
partikulat Matter (PM 2.5) debu
O3 37 (Bagus)
ozon (O3)
NO2 6.5 (Bagus)
nitrogen dioksida (NO2)
PM10 5.8 (Bagus)
partikulat Matter (PM10) debu tersuspensi
43N132 - HABAY-LA-N.
Rabu, 17 Januari 2024 10.00
SO2 0.5 (Bagus)
sulfur dioksida (SO2)
PM10 18 (Bagus)
partikulat Matter (PM10) debu tersuspensi
PM2,5 15 (Moderat)
partikulat Matter (PM 2.5) debu
CO 370 (Bagus)
karbon monoksida (CO)
NO2 19 (Bagus)
nitrogen dioksida (NO2)
O3 26 (Bagus)
ozon (O3)
43N085 - VIELSALM
index
2024-01-17
2024-01-16
2024-01-15
2024-01-14
2024-01-13
2024-01-12
2024-01-11
2024-01-10
so2
1
1
1
1
1
1
1
0.96
pm10
13
5.7
7.3
6.2
13
6.6
15
14
no2
6
4.5
6.5
3.7
3.5
8
14
6.5
o3
47
52
51
41
51
42
33
41
pm25
10
3.1
5.3
4.4
11
4.2
12
11
co
221
163
185
184
165
179
268
235
43N113 - SAINT-ODE
index
2024-01-17
2024-01-16
2024-01-15
2024-01-14
2024-01-13
2024-01-12
2024-01-11
2024-01-10
no2
7.7
5.9
7
3.9
2.7
11
22
11
pm10
8.9
5.7
5.9
5.1
7.3
10
21
13
pm25
7.1
3.8
4.5
2.7
5.4
6.1
17
10
o3
53
55
48
42
59
41
24
41
43N121 - OFFAGNE
index
2024-01-17
2024-01-16
2024-01-15
2024-01-14
2024-01-13
2024-01-12
2024-01-11
2024-01-10
pm10
7.2
8
7.2
5.4
21
5.9
16
11
pm25
5.5
5.8
5.6
3.6
18
4.2
13
8.1
no2
6.6
10
6.4
2.1
3.1
10
20
9.4
o3
44
34
36
36
48
41
27
40
43N132 - HABAY-LA-N.
index
2024-01-17
2024-01-16
2024-01-15
2024-01-14
2024-01-13
2024-01-12
2024-01-11
2024-01-10
no2
31
18
8.1
4.4
4.2
14
14
12
pm10
17
17
13
11
12
12
17
17
co
360
293
231
207
169
204
277
268
pm25
14
13
10
8.1
10
10
13
14
o3
24
33
38
37
52
33
39
39
so2
0.5
0.3
0.09
0.08
0.2
0.17
0.32
0.56
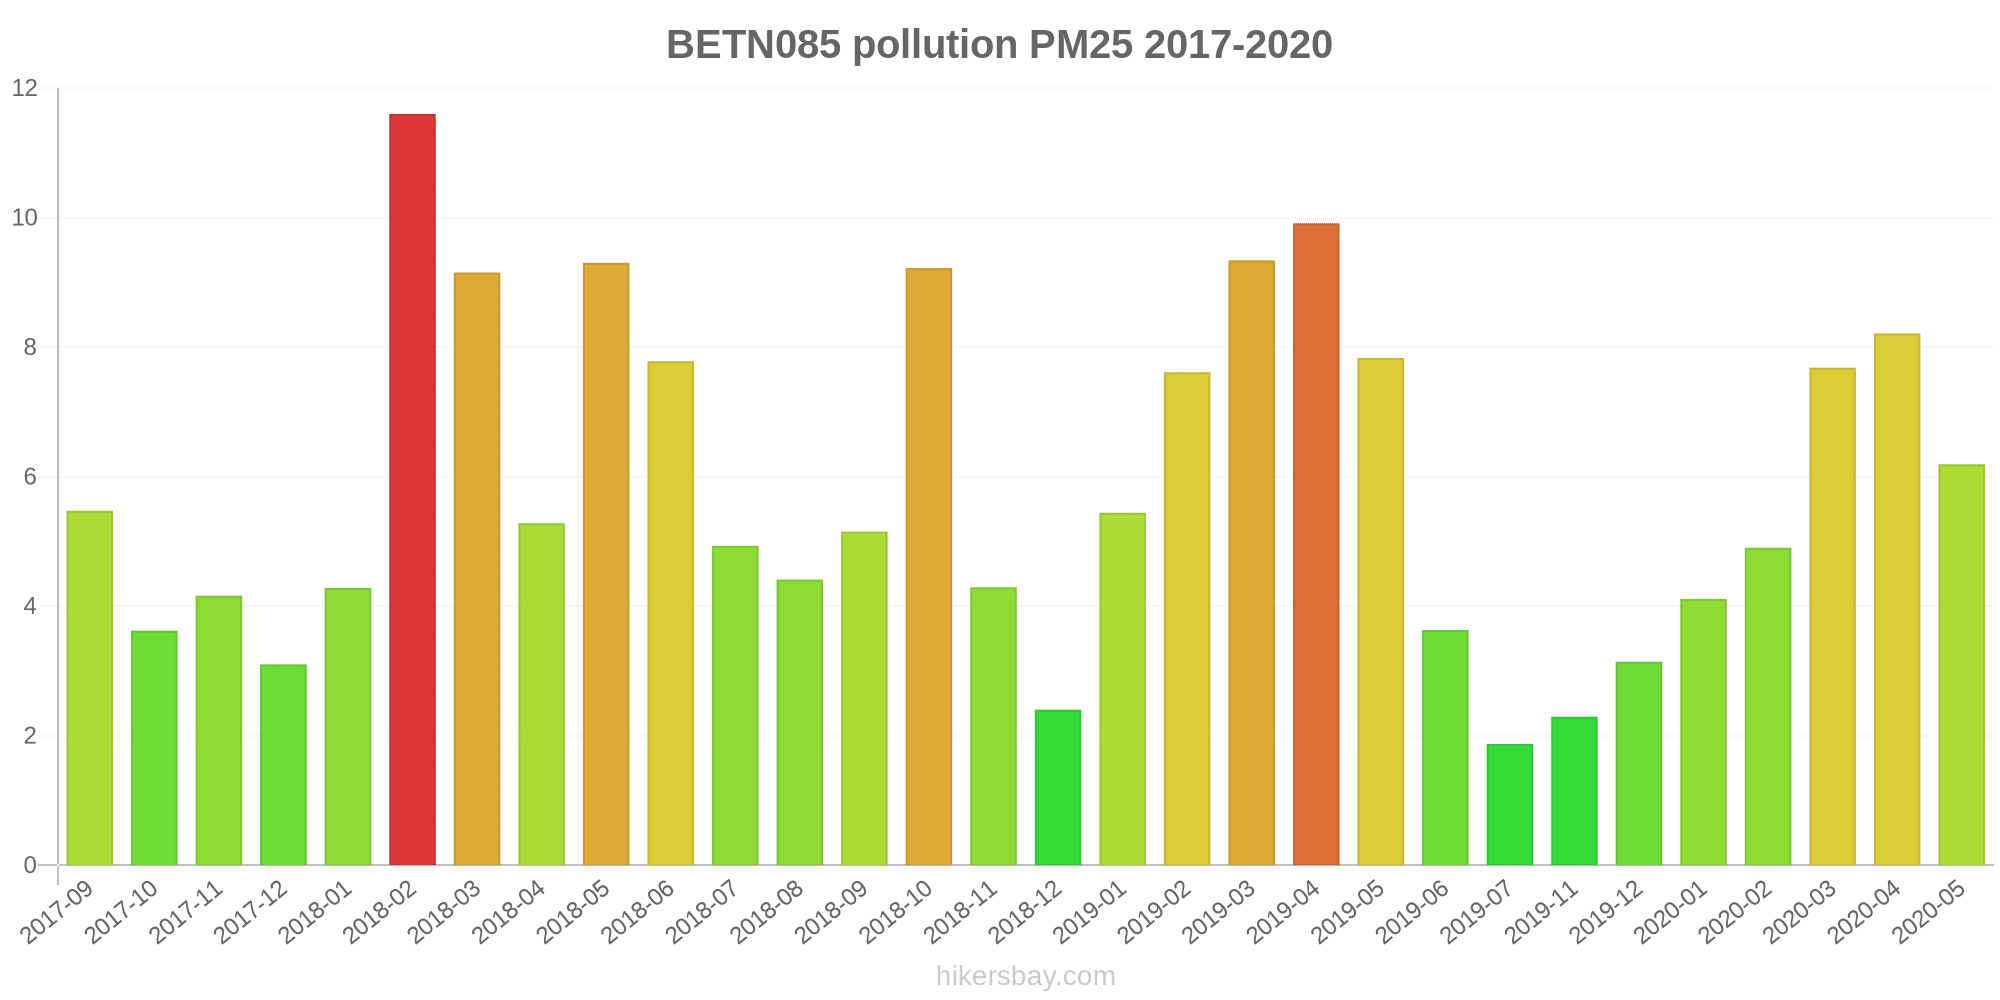
BETN085
2017-09 2020-05
index
2020-05
2020-04
2020-03
2020-02
2020-01
2019-12
2019-11
2019-10
2019-09
2019-07
2019-06
2019-05
2019-04
2019-03
2019-02
2019-01
2018-12
2018-11
2018-10
2018-09
2018-08
2018-07
2018-06
2018-05
2018-04
2018-03
2018-02
2018-01
2017-12
2017-11
2017-10
2017-09
pm25
6.2
8.2
7.7
4.9
4.1
3.1
2.3
-
-
1.9
3.6
7.8
9.9
9.3
7.6
5.4
2.4
4.3
9.2
5.2
4.4
4.9
7.8
9.3
5.3
9.2
12
4.3
3.1
4.2
3.6
5.5
pm10
11
14
11
3.8
7.1
3.3
4.1
0.72
4
2.7
6.7
8.9
13
9.1
12
8.8
4.2
7.7
13
9.4
7.3
9.3
12
13
8.2
12
15
5.9
5.5
5
4.4
7.6
co
0.18
0.17
0.18
0.16
0.17
0.1
0.09
0.06
0.12
0.06
0.13
0.15
0.19
0.17
0.18
0.16
0.16
0.19
0.16
0.16
0.13
0.11
0.11
0.14
0.15
0.2
0.21
0.16
0.17
4.5
14
18
so2
-
1.4
1
1
1
0.61
0.4
-
0.9
0.81
0.64
0.52
0.95
-
-
0.99
0.85
0.77
0.51
-
0.78
-
0.87
1.5
1.7
1.9
1.2
1
1
1.3
0.79
0.89
no2
5.3
6.2
4.8
5
4.2
2.7
2.8
0.73
3.3
2.8
5.7
5.5
5.9
6.8
7.3
5.3
5.6
6.7
7.5
9.1
7.9
8.1
6.5
6.8
5.2
8.7
11
6.1
8.4
8.4
3.4
2.8
o3
55
70
55
51
40
26
16
21
36
25
46
44
55
49
53
46
46
32
31
38
51
68
34
56
66
54
50
45
42
31
30
27
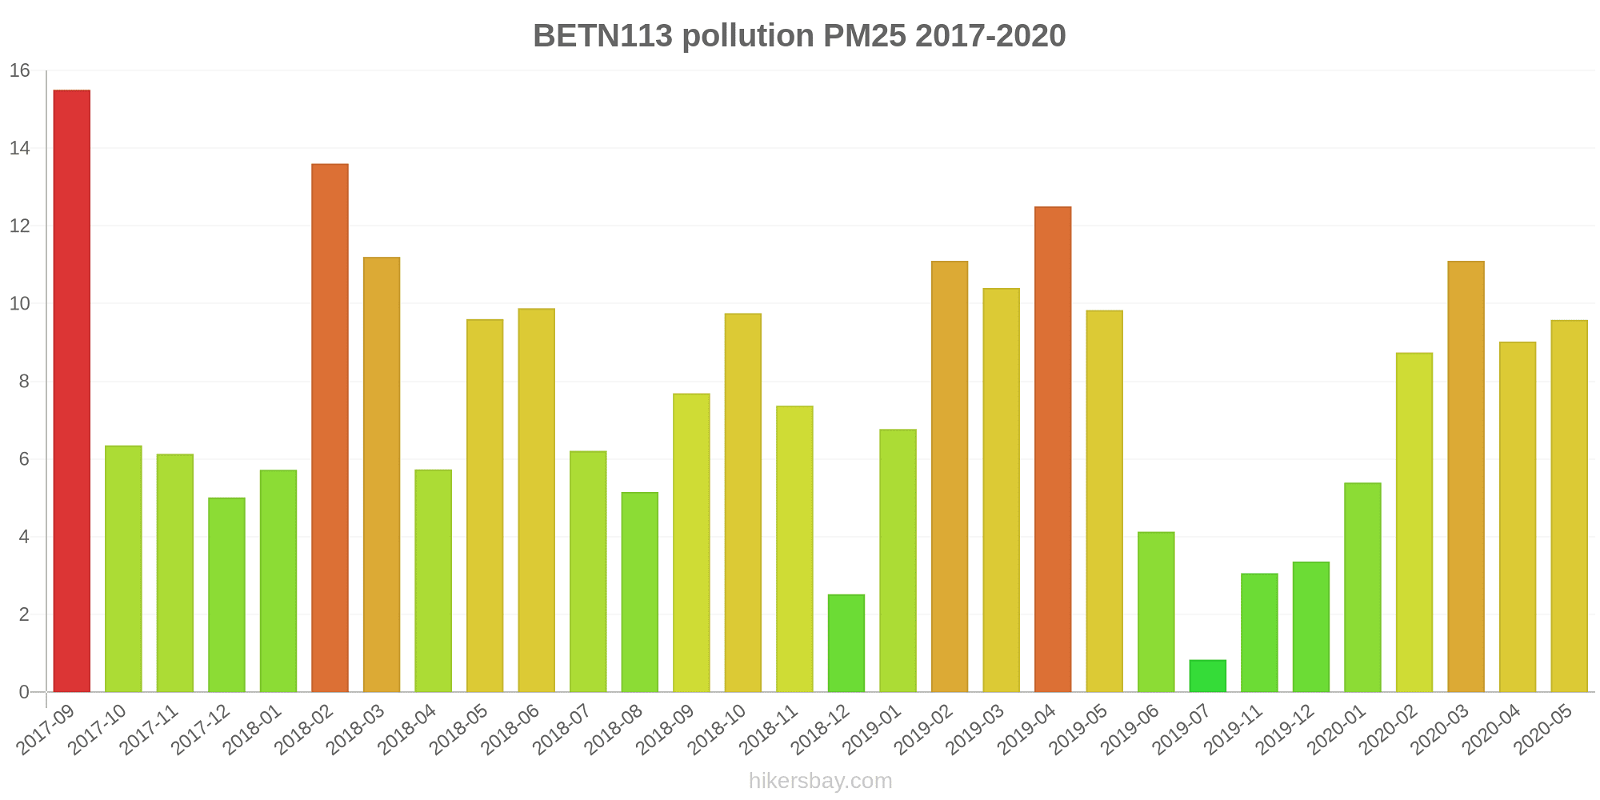
BETN113
2017-09 2020-05
index
2020-05
2020-04
2020-03
2020-02
2020-01
2019-12
2019-11
2019-10
2019-09
2019-07
2019-06
2019-05
2019-04
2019-03
2019-02
2019-01
2018-12
2018-11
2018-10
2018-09
2018-08
2018-07
2018-06
2018-05
2018-04
2018-03
2018-02
2018-01
2017-12
2017-11
2017-10
2017-09
pm25
9.6
9
11
8.7
5.4
3.4
3.1
-
-
0.83
4.1
9.8
13
10
11
6.8
2.5
7.4
9.8
7.7
5.2
6.2
9.9
9.6
5.7
11
14
5.7
5
6.1
6.3
16
pm10
14
17
12
9.2
6.8
4
4.5
-
-
3
7.8
12
18
12
13
9
4.3
9.6
14
9
8.5
12
14
15
9.3
14
15
7.1
6.8
9.6
9.4
17
no2
4.8
3.4
3.3
3.8
5.6
3.1
3.5
-
1.6
1.7
3.3
4
4.7
4.1
4
5
4.7
7.8
7.5
5.2
6
7.8
6.6
6.5
5.7
8.6
11
5.9
8.5
9
4.5
6.9
o3
70
80
65
67
53
33
22
30
43
33
73
65
67
67
63
51
53
42
46
63
68
87
58
73
81
62
52
57
47
42
48
53
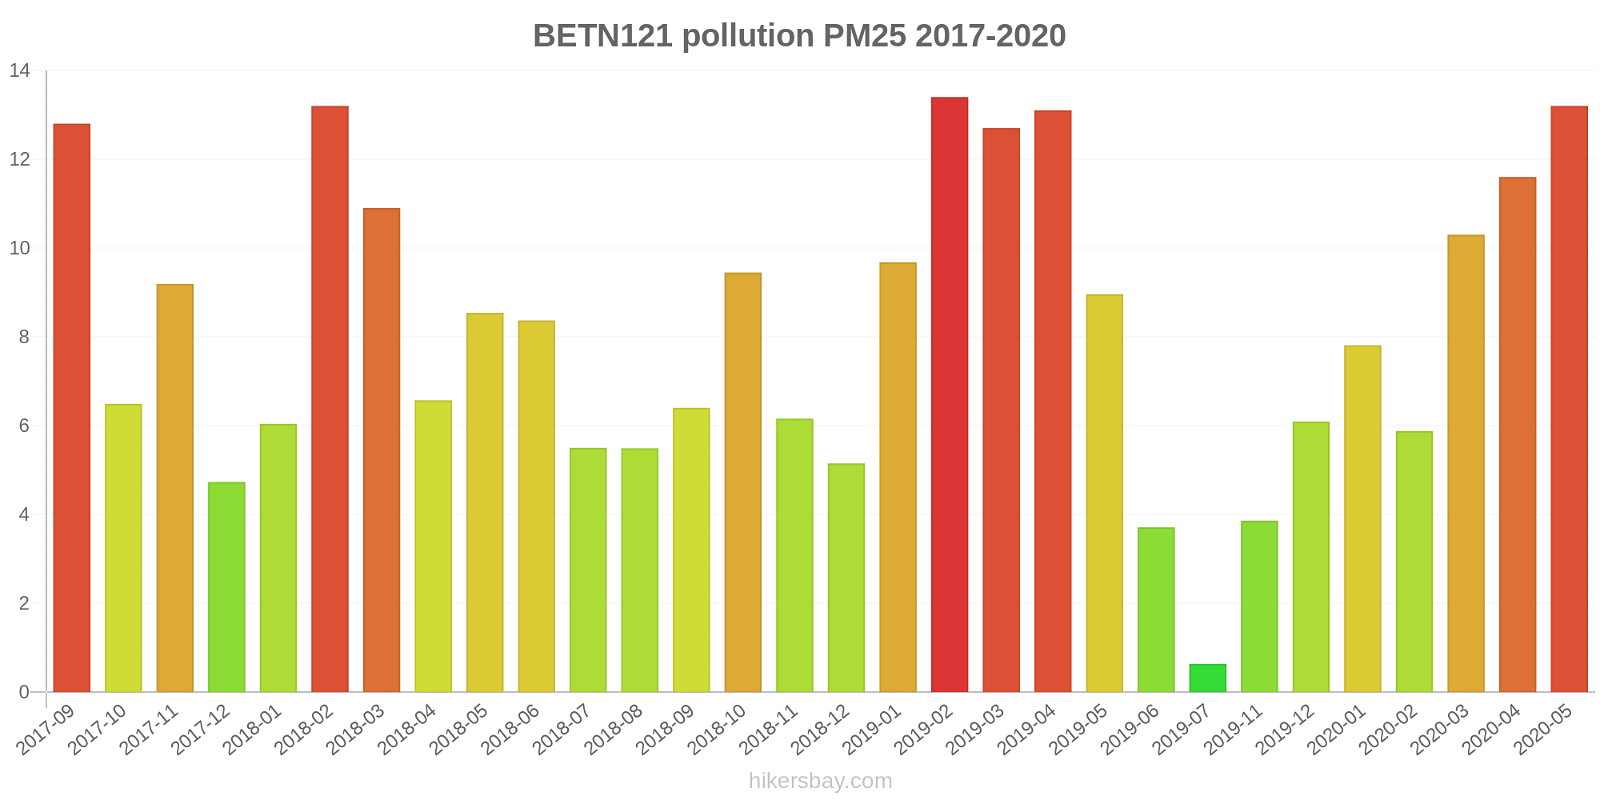
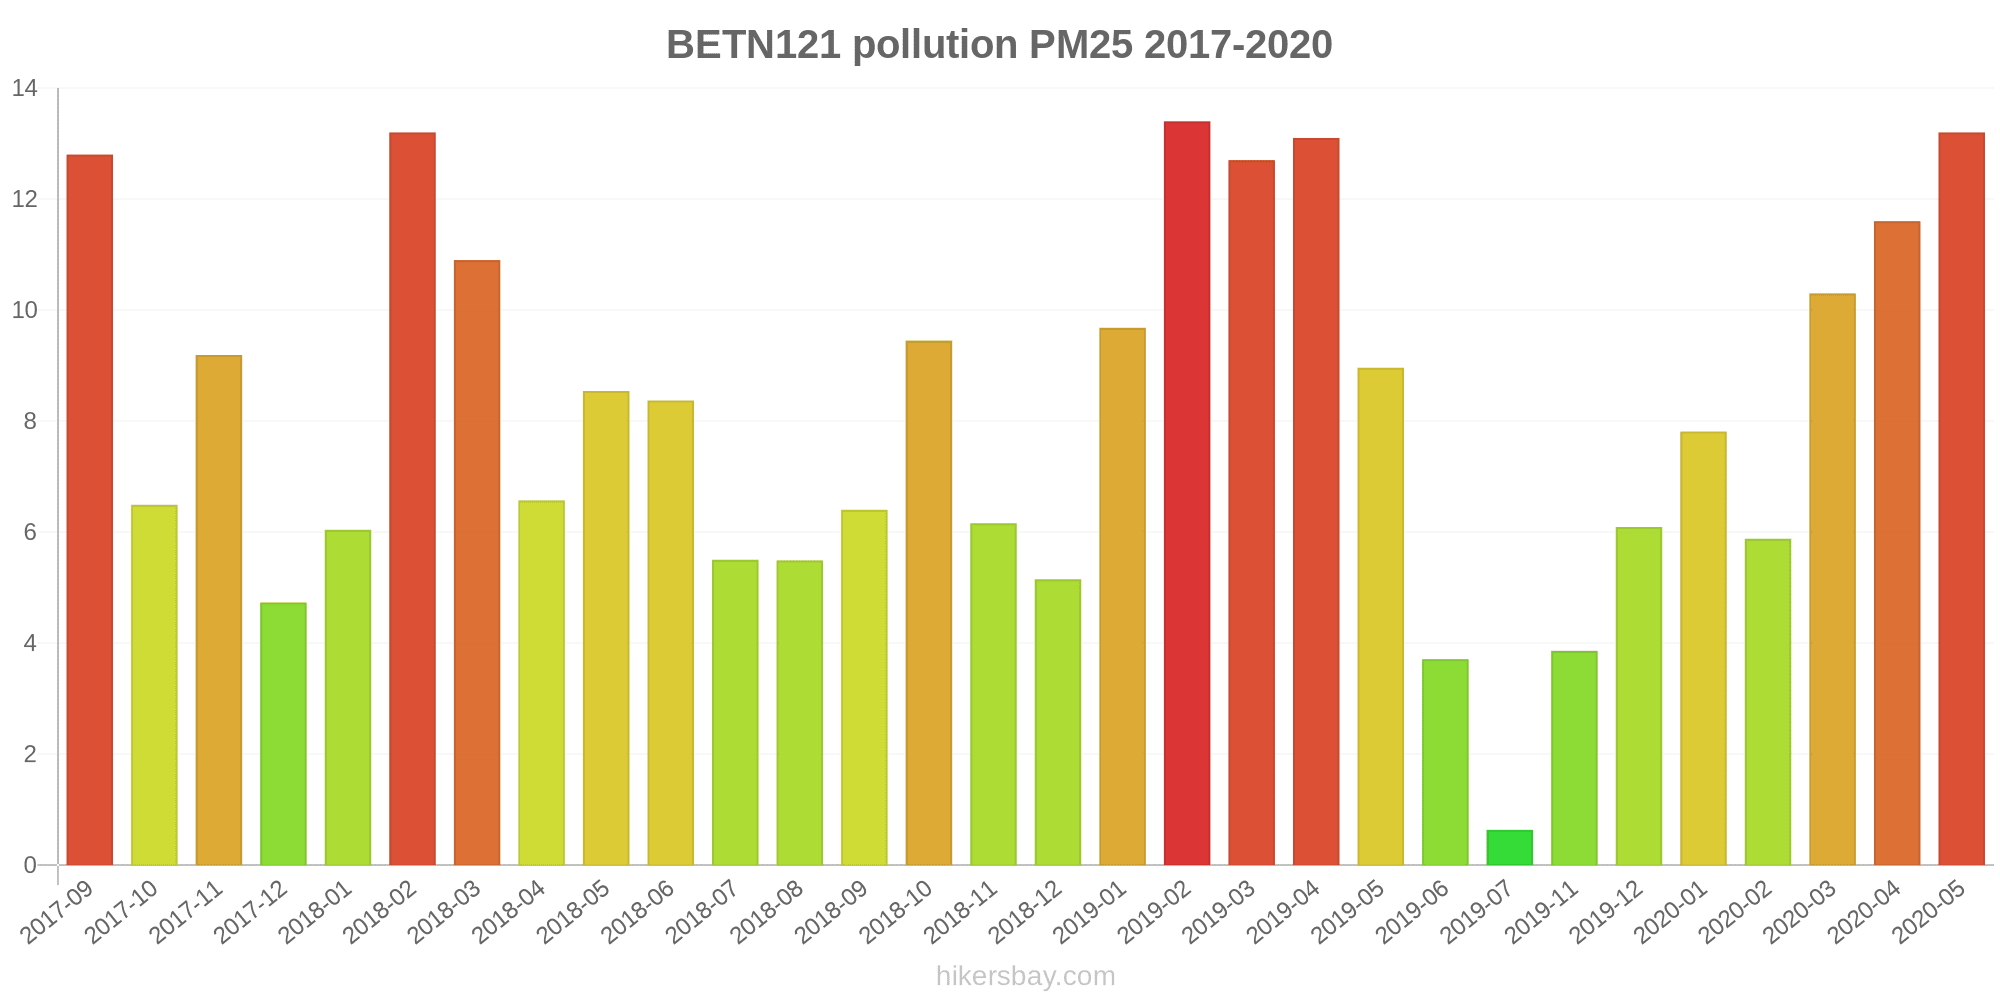
BETN121
2017-09 2020-05
index
2020-05
2020-04
2020-03
2020-02
2020-01
2019-12
2019-11
2019-10
2019-09
2019-07
2019-06
2019-05
2019-04
2019-03
2019-02
2019-01
2018-12
2018-11
2018-10
2018-09
2018-08
2018-07
2018-06
2018-05
2018-04
2018-03
2018-02
2018-01
2017-12
2017-11
2017-10
2017-09
pm10
20
22
14
7.3
12
6.8
4.9
1.6
-
2
6.5
10
15
11
16
11
5.8
8.2
15
8.6
8.9
12
11
14
10
14
16
6.8
6.7
11
11
19
no2
5.8
6
3.9
3.5
5.2
4
3.3
0.99
3.8
2.8
4.7
4.9
5.9
3.2
6.6
4
4.9
8.4
7.4
6.4
6.4
6.8
5.3
6.2
6.5
8.1
12
5.1
6.8
7.5
4.8
5.6
o3
71
73
61
63
50
30
19
22
35
38
64
70
54
59
50
47
44
35
35
44
52
75
52
70
72
60
49
56
45
37
36
44
pm25
13
12
10
5.9
7.8
6.1
3.9
-
-
0.64
3.7
9
13
13
13
9.7
5.2
6.2
9.4
6.4
5.5
5.5
8.4
8.5
6.6
11
13
6
4.7
9.2
6.5
13
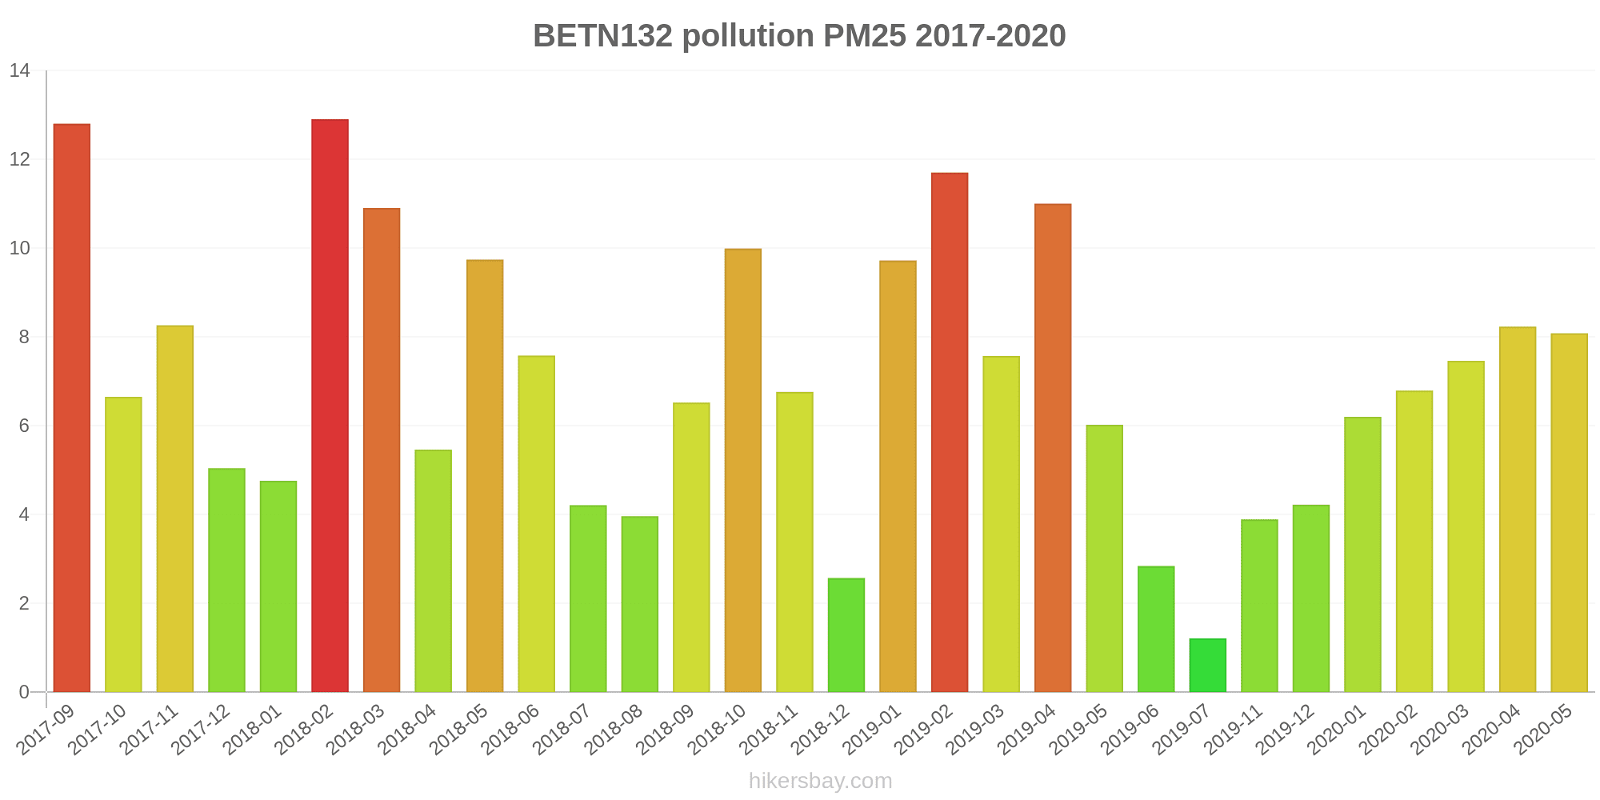
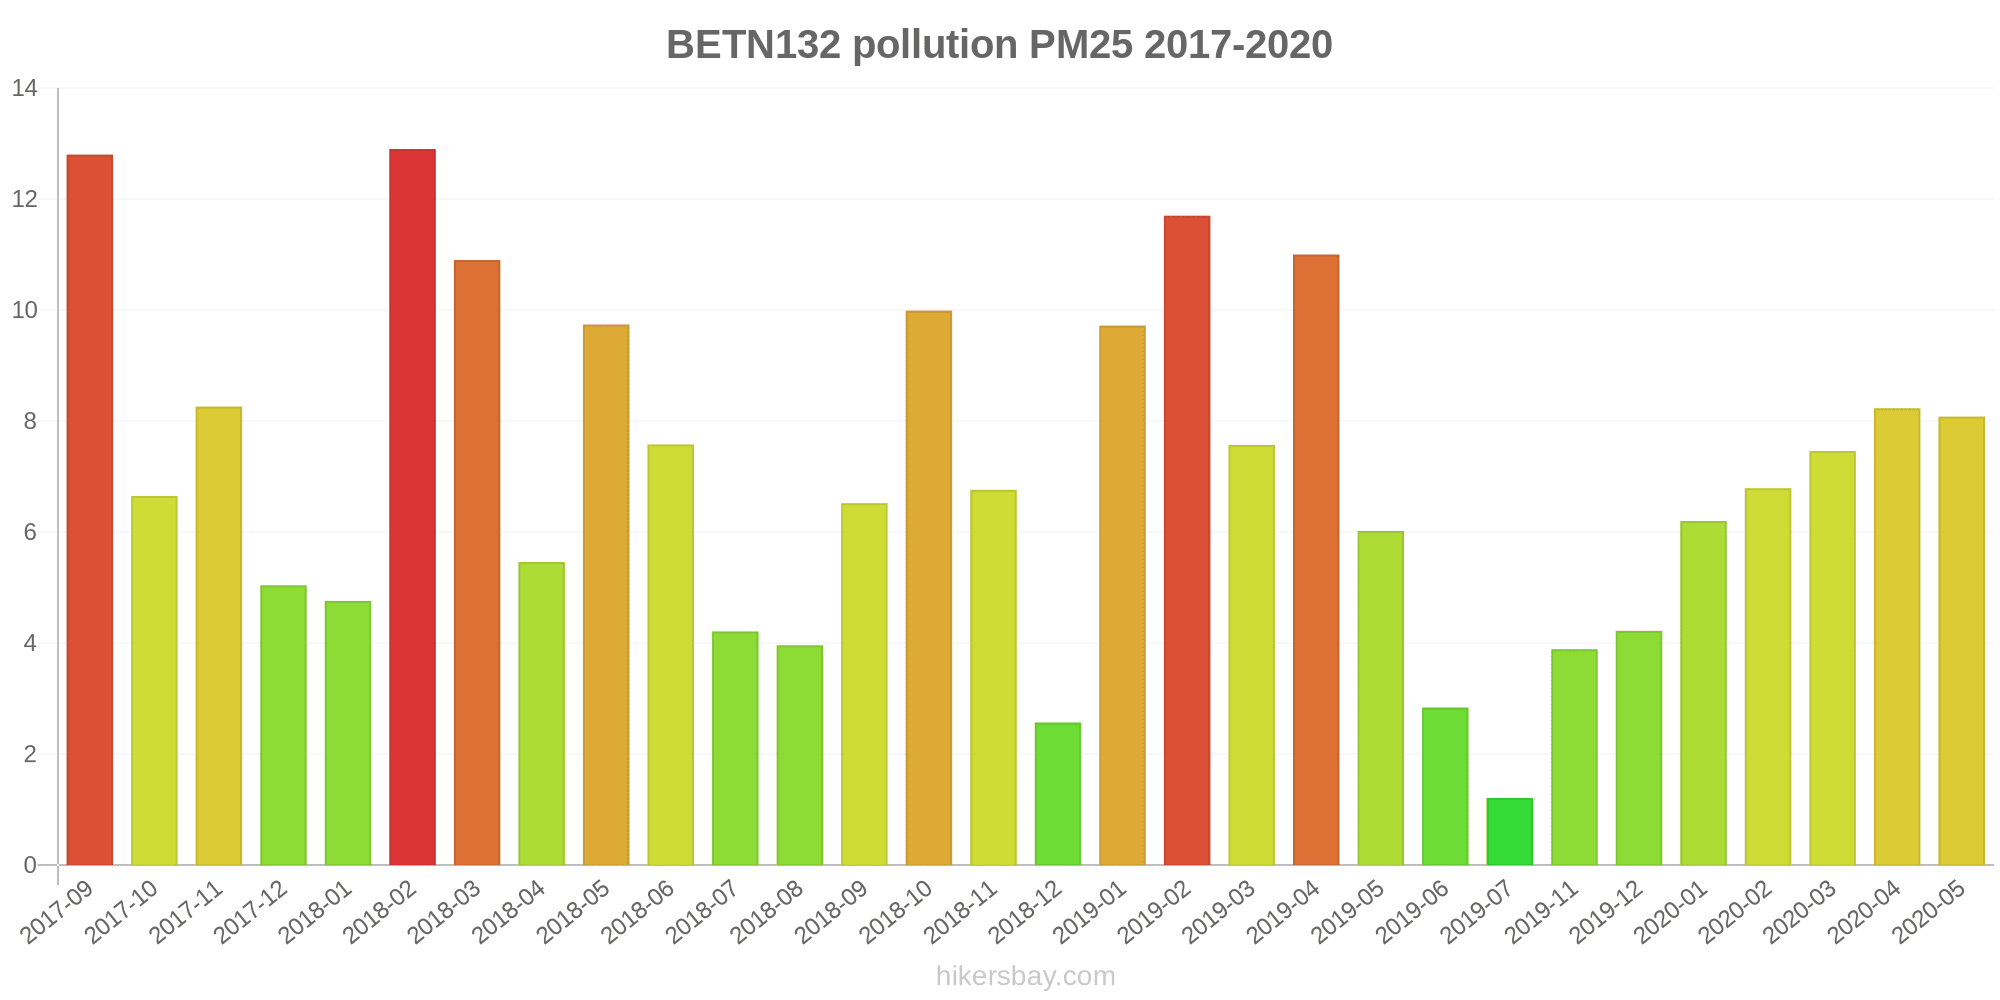
BETN132
2017-09 2020-05
index
2020-05
2020-04
2020-03
2020-02
2020-01
2019-12
2019-11
2019-10
2019-09
2019-07
2019-06
2019-05
2019-04
2019-03
2019-02
2019-01
2018-12
2018-11
2018-10
2018-09
2018-08
2018-07
2018-06
2018-05
2018-04
2018-03
2018-02
2018-01
2017-12
2017-11
2017-10
2017-09
pm25
8.1
8.2
7.5
6.8
6.2
4.2
3.9
-
-
1.2
2.8
6
11
7.6
12
9.7
2.6
6.8
10
6.5
4
4.2
7.6
9.7
5.5
11
13
4.8
5
8.3
6.7
13
pm10
12
15
11
6.5
13
5.5
5.5
1.2
-
3.3
6.4
8.9
16
9.7
15
12
5.2
9.8
16
9.3
7.1
11
9.9
14
9.5
16
16
7.4
7.2
13
12
18
co
0.17
0.19
0.21
0.18
0.22
0.13
0.12
0.06
0.11
0.06
0.14
0.17
0.21
0.18
0.24
0.19
0.23
0.23
0.18
0.17
0.14
0.14
0.14
0.18
0.19
0.26
0.27
0.2
0.21
5.4
17
21
so2
0.96
0.95
1
0.86
0.74
-
-
-
0.68
-
1
0.96
0.81
1
1
-
-
0.46
0.29
1
0.87
0.76
0.99
0.65
2.1
2.1
2
1.5
1
1.4
0.99
1
no2
4.9
5.5
4.4
4.4
7.1
4.1
4.6
1.5
4.8
2.2
4.1
5.7
6.8
6
10
6.5
11
12
9.1
7.8
6.6
5.8
5.3
5.4
7.5
12
13
8.4
9
9.9
7
6.8
o3
65
64
61
60
44
26
16
18
35
31
49
53
64
58
38
50
39
33
38
36
49
76
49
66
64
54
43
47
38
29
27
34
* Pollution data source:
https://openaq.org
(EEA Belgium)
The data is licensed under CC-By 4.0
SO2 1 (Bagus)
O3 39 (Bagus)
PM10 11 (Bagus)
NO2 10 (Bagus)
CO 293 (Bagus)
PM2,5 9 (Bagus)
Data tentang polusi udara dari beberapa hari terakhir di Luxembourg Province
| index | 2024-01-10 | 2024-01-11 | 2024-01-12 | 2024-01-13 | 2024-01-14 | 2024-01-15 | 2024-01-16 | 2024-01-17 |
|---|---|---|---|---|---|---|---|---|
| so2 | 1 Good |
1 Good |
1 Good |
1 Good |
1 Good |
1 Good |
1 Good |
1 Good |
| pm10 | 14 Good |
17 Good |
9 Good |
14 Good |
7 Good |
8 Good |
9 Good |
11 Good |
| no2 | 10 Good |
18 Good |
11 Good |
3 Good |
3 Good |
7 Good |
10 Good |
13 Good |
| o3 | 40 Good |
31 Good |
39 Good |
52 Good |
39 Good |
43 Good |
43 Good |
42 Good |
| pm25 | 11 Good |
14 Moderate |
6 Good |
11 Good |
5 Good |
6 Good |
6 Good |
9 Good |
| co | 251 Good |
273 Good |
191 Good |
167 Good |
195 Good |
208 Good |
228 Good |
290 Good |
| index | 2020-05 | 2020-04 | 2020-03 | 2020-02 | 2020-01 | 2019-12 | 2019-11 | 2019-10 | 2019-09 | 2019-07 | 2019-06 | 2019-05 | 2019-04 | 2019-03 | 2019-02 | 2019-01 | 2018-12 | 2018-11 | 2018-10 | 2018-09 | 2018-08 | 2018-07 | 2018-06 | 2018-05 | 2018-04 | 2018-03 | 2018-02 | 2018-01 | 2017-12 | 2017-11 | 2017-10 | 2017-09 |
|---|---|---|---|---|---|---|---|---|---|---|---|---|---|---|---|---|---|---|---|---|---|---|---|---|---|---|---|---|---|---|---|---|
| pm10 | 14 (Good) | 17 (Good) | 12 (Good) | 6.7 (Good) | 9.6 (Good) | 4.9 (Good) | 4.8 (Good) | 1.2 (Good) | 4 (Good) | 2.8 (Good) | 6.8 (Good) | 10 (Good) | 15 (Good) | 10 (Good) | 14 (Good) | 10 (Good) | 4.9 (Good) | 8.8 (Good) | 14 (Good) | 9.1 (Good) | 8 (Good) | 11 (Good) | 12 (Good) | 14 (Good) | 9.3 (Good) | 14 (Good) | 16 (Good) | 6.8 (Good) | 6.5 (Good) | 9.5 (Good) | 9.1 (Good) | 15 (Good) |
| no2 | 5.2 (Good) | 5.3 (Good) | 4.1 (Good) | 4.2 (Good) | 5.5 (Good) | 3.5 (Good) | 3.5 (Good) | 1.1 (Good) | 3.4 (Good) | 2.4 (Good) | 4.4 (Good) | 5 (Good) | 5.8 (Good) | 5 (Good) | 6.9 (Good) | 5.2 (Good) | 6.5 (Good) | 8.8 (Good) | 7.9 (Good) | 7.1 (Good) | 6.7 (Good) | 7.1 (Good) | 5.9 (Good) | 6.2 (Good) | 6.2 (Good) | 9.4 (Good) | 12 (Good) | 6.4 (Good) | 8.2 (Good) | 8.7 (Good) | 4.9 (Good) | 5.5 (Good) |
| co | 0.17 (Good) | 0.18 (Good) | 0.19 (Good) | 0.17 (Good) | 0.19 (Good) | 0.12 (Good) | 0.1 (Good) | 0.06 (Good) | 0.12 (Good) | 0.06 (Good) | 0.13 (Good) | 0.16 (Good) | 0.2 (Good) | 0.18 (Good) | 0.21 (Good) | 0.18 (Good) | 0.19 (Good) | 0.21 (Good) | 0.17 (Good) | 0.16 (Good) | 0.14 (Good) | 0.12 (Good) | 0.13 (Good) | 0.16 (Good) | 0.17 (Good) | 0.23 (Good) | 0.24 (Good) | 0.18 (Good) | 0.19 (Good) | 5 (Good) | 16 (Good) | 19 (Good) |
| o3 | 65 (Good) | 72 (Moderate) | 60 (Good) | 60 (Good) | 47 (Good) | 29 (Good) | 18 (Good) | 23 (Good) | 37 (Good) | 32 (Good) | 58 (Good) | 58 (Good) | 60 (Good) | 58 (Good) | 51 (Good) | 49 (Good) | 45 (Good) | 35 (Good) | 38 (Good) | 45 (Good) | 55 (Good) | 77 (Moderate) | 48 (Good) | 66 (Good) | 71 (Moderate) | 58 (Good) | 49 (Good) | 51 (Good) | 43 (Good) | 35 (Good) | 35 (Good) | 39 (Good) |
| pm25 | 9.3 (Good) | 9.3 (Good) | 9.1 (Good) | 6.6 (Good) | 5.9 (Good) | 4.2 (Good) | 3.3 (Good) | - (Good) | - (Good) | 1.1 (Good) | 3.6 (Good) | 8.2 (Good) | 12 (Good) | 10 (Good) | 11 (Good) | 7.9 (Good) | 3.2 (Good) | 6.1 (Good) | 9.6 (Good) | 6.4 (Good) | 4.8 (Good) | 5.2 (Good) | 8.4 (Good) | 9.3 (Good) | 5.8 (Good) | 11 (Good) | 13 (Good) | 5.2 (Good) | 4.5 (Good) | 6.9 (Good) | 5.8 (Good) | 12 (Good) |
| so2 | 0.96 (Good) | 1.2 (Good) | 1 (Good) | 0.93 (Good) | 0.87 (Good) | 0.61 (Good) | 0.4 (Good) | - (Good) | 0.79 (Good) | 0.81 (Good) | 0.82 (Good) | 0.74 (Good) | 0.88 (Good) | 1 (Good) | 1 (Good) | 0.99 (Good) | 0.85 (Good) | 0.61 (Good) | 0.4 (Good) | 1 (Good) | 0.82 (Good) | 0.76 (Good) | 0.93 (Good) | 1.1 (Good) | 1.9 (Good) | 2 (Good) | 1.6 (Good) | 1.3 (Good) | 1 (Good) | 1.3 (Good) | 0.89 (Good) | 0.95 (Good) |
SO2 1 (Bagus)
sulfur dioksida (SO2)O3 50 (Bagus)
ozon (O3)PM10 11 (Bagus)
partikulat Matter (PM10) debu tersuspensiNO2 5.5 (Bagus)
nitrogen dioksida (NO2)CO 215 (Bagus)
karbon monoksida (CO)PM2,5 8.9 (Bagus)
partikulat Matter (PM 2.5) debuNO2 8.5 (Bagus)
nitrogen dioksida (NO2)O3 42 (Bagus)
ozon (O3)PM2,5 6 (Bagus)
partikulat Matter (PM 2.5) debuPM10 7.8 (Bagus)
partikulat Matter (PM10) debu tersuspensiPM2,5 4.1 (Bagus)
partikulat Matter (PM 2.5) debuO3 37 (Bagus)
ozon (O3)NO2 6.5 (Bagus)
nitrogen dioksida (NO2)PM10 5.8 (Bagus)
partikulat Matter (PM10) debu tersuspensiSO2 0.5 (Bagus)
sulfur dioksida (SO2)PM10 18 (Bagus)
partikulat Matter (PM10) debu tersuspensiPM2,5 15 (Moderat)
partikulat Matter (PM 2.5) debuCO 370 (Bagus)
karbon monoksida (CO)NO2 19 (Bagus)
nitrogen dioksida (NO2)O3 26 (Bagus)
ozon (O3)43N085 - VIELSALM
| index | 2024-01-17 | 2024-01-16 | 2024-01-15 | 2024-01-14 | 2024-01-13 | 2024-01-12 | 2024-01-11 | 2024-01-10 |
|---|---|---|---|---|---|---|---|---|
| so2 | 1 | 1 | 1 | 1 | 1 | 1 | 1 | 0.96 |
| pm10 | 13 | 5.7 | 7.3 | 6.2 | 13 | 6.6 | 15 | 14 |
| no2 | 6 | 4.5 | 6.5 | 3.7 | 3.5 | 8 | 14 | 6.5 |
| o3 | 47 | 52 | 51 | 41 | 51 | 42 | 33 | 41 |
| pm25 | 10 | 3.1 | 5.3 | 4.4 | 11 | 4.2 | 12 | 11 |
| co | 221 | 163 | 185 | 184 | 165 | 179 | 268 | 235 |
43N113 - SAINT-ODE
| index | 2024-01-17 | 2024-01-16 | 2024-01-15 | 2024-01-14 | 2024-01-13 | 2024-01-12 | 2024-01-11 | 2024-01-10 |
|---|---|---|---|---|---|---|---|---|
| no2 | 7.7 | 5.9 | 7 | 3.9 | 2.7 | 11 | 22 | 11 |
| pm10 | 8.9 | 5.7 | 5.9 | 5.1 | 7.3 | 10 | 21 | 13 |
| pm25 | 7.1 | 3.8 | 4.5 | 2.7 | 5.4 | 6.1 | 17 | 10 |
| o3 | 53 | 55 | 48 | 42 | 59 | 41 | 24 | 41 |
43N121 - OFFAGNE
| index | 2024-01-17 | 2024-01-16 | 2024-01-15 | 2024-01-14 | 2024-01-13 | 2024-01-12 | 2024-01-11 | 2024-01-10 |
|---|---|---|---|---|---|---|---|---|
| pm10 | 7.2 | 8 | 7.2 | 5.4 | 21 | 5.9 | 16 | 11 |
| pm25 | 5.5 | 5.8 | 5.6 | 3.6 | 18 | 4.2 | 13 | 8.1 |
| no2 | 6.6 | 10 | 6.4 | 2.1 | 3.1 | 10 | 20 | 9.4 |
| o3 | 44 | 34 | 36 | 36 | 48 | 41 | 27 | 40 |
43N132 - HABAY-LA-N.
| index | 2024-01-17 | 2024-01-16 | 2024-01-15 | 2024-01-14 | 2024-01-13 | 2024-01-12 | 2024-01-11 | 2024-01-10 |
|---|---|---|---|---|---|---|---|---|
| no2 | 31 | 18 | 8.1 | 4.4 | 4.2 | 14 | 14 | 12 |
| pm10 | 17 | 17 | 13 | 11 | 12 | 12 | 17 | 17 |
| co | 360 | 293 | 231 | 207 | 169 | 204 | 277 | 268 |
| pm25 | 14 | 13 | 10 | 8.1 | 10 | 10 | 13 | 14 |
| o3 | 24 | 33 | 38 | 37 | 52 | 33 | 39 | 39 |
| so2 | 0.5 | 0.3 | 0.09 | 0.08 | 0.2 | 0.17 | 0.32 | 0.56 |
BETN085
| index | 2020-05 | 2020-04 | 2020-03 | 2020-02 | 2020-01 | 2019-12 | 2019-11 | 2019-10 | 2019-09 | 2019-07 | 2019-06 | 2019-05 | 2019-04 | 2019-03 | 2019-02 | 2019-01 | 2018-12 | 2018-11 | 2018-10 | 2018-09 | 2018-08 | 2018-07 | 2018-06 | 2018-05 | 2018-04 | 2018-03 | 2018-02 | 2018-01 | 2017-12 | 2017-11 | 2017-10 | 2017-09 |
|---|---|---|---|---|---|---|---|---|---|---|---|---|---|---|---|---|---|---|---|---|---|---|---|---|---|---|---|---|---|---|---|---|
| pm25 | 6.2 | 8.2 | 7.7 | 4.9 | 4.1 | 3.1 | 2.3 | - | - | 1.9 | 3.6 | 7.8 | 9.9 | 9.3 | 7.6 | 5.4 | 2.4 | 4.3 | 9.2 | 5.2 | 4.4 | 4.9 | 7.8 | 9.3 | 5.3 | 9.2 | 12 | 4.3 | 3.1 | 4.2 | 3.6 | 5.5 |
| pm10 | 11 | 14 | 11 | 3.8 | 7.1 | 3.3 | 4.1 | 0.72 | 4 | 2.7 | 6.7 | 8.9 | 13 | 9.1 | 12 | 8.8 | 4.2 | 7.7 | 13 | 9.4 | 7.3 | 9.3 | 12 | 13 | 8.2 | 12 | 15 | 5.9 | 5.5 | 5 | 4.4 | 7.6 |
| co | 0.18 | 0.17 | 0.18 | 0.16 | 0.17 | 0.1 | 0.09 | 0.06 | 0.12 | 0.06 | 0.13 | 0.15 | 0.19 | 0.17 | 0.18 | 0.16 | 0.16 | 0.19 | 0.16 | 0.16 | 0.13 | 0.11 | 0.11 | 0.14 | 0.15 | 0.2 | 0.21 | 0.16 | 0.17 | 4.5 | 14 | 18 |
| so2 | - | 1.4 | 1 | 1 | 1 | 0.61 | 0.4 | - | 0.9 | 0.81 | 0.64 | 0.52 | 0.95 | - | - | 0.99 | 0.85 | 0.77 | 0.51 | - | 0.78 | - | 0.87 | 1.5 | 1.7 | 1.9 | 1.2 | 1 | 1 | 1.3 | 0.79 | 0.89 |
| no2 | 5.3 | 6.2 | 4.8 | 5 | 4.2 | 2.7 | 2.8 | 0.73 | 3.3 | 2.8 | 5.7 | 5.5 | 5.9 | 6.8 | 7.3 | 5.3 | 5.6 | 6.7 | 7.5 | 9.1 | 7.9 | 8.1 | 6.5 | 6.8 | 5.2 | 8.7 | 11 | 6.1 | 8.4 | 8.4 | 3.4 | 2.8 |
| o3 | 55 | 70 | 55 | 51 | 40 | 26 | 16 | 21 | 36 | 25 | 46 | 44 | 55 | 49 | 53 | 46 | 46 | 32 | 31 | 38 | 51 | 68 | 34 | 56 | 66 | 54 | 50 | 45 | 42 | 31 | 30 | 27 |
BETN113

| index | 2020-05 | 2020-04 | 2020-03 | 2020-02 | 2020-01 | 2019-12 | 2019-11 | 2019-10 | 2019-09 | 2019-07 | 2019-06 | 2019-05 | 2019-04 | 2019-03 | 2019-02 | 2019-01 | 2018-12 | 2018-11 | 2018-10 | 2018-09 | 2018-08 | 2018-07 | 2018-06 | 2018-05 | 2018-04 | 2018-03 | 2018-02 | 2018-01 | 2017-12 | 2017-11 | 2017-10 | 2017-09 |
|---|---|---|---|---|---|---|---|---|---|---|---|---|---|---|---|---|---|---|---|---|---|---|---|---|---|---|---|---|---|---|---|---|
| pm25 | 9.6 | 9 | 11 | 8.7 | 5.4 | 3.4 | 3.1 | - | - | 0.83 | 4.1 | 9.8 | 13 | 10 | 11 | 6.8 | 2.5 | 7.4 | 9.8 | 7.7 | 5.2 | 6.2 | 9.9 | 9.6 | 5.7 | 11 | 14 | 5.7 | 5 | 6.1 | 6.3 | 16 |
| pm10 | 14 | 17 | 12 | 9.2 | 6.8 | 4 | 4.5 | - | - | 3 | 7.8 | 12 | 18 | 12 | 13 | 9 | 4.3 | 9.6 | 14 | 9 | 8.5 | 12 | 14 | 15 | 9.3 | 14 | 15 | 7.1 | 6.8 | 9.6 | 9.4 | 17 |
| no2 | 4.8 | 3.4 | 3.3 | 3.8 | 5.6 | 3.1 | 3.5 | - | 1.6 | 1.7 | 3.3 | 4 | 4.7 | 4.1 | 4 | 5 | 4.7 | 7.8 | 7.5 | 5.2 | 6 | 7.8 | 6.6 | 6.5 | 5.7 | 8.6 | 11 | 5.9 | 8.5 | 9 | 4.5 | 6.9 |
| o3 | 70 | 80 | 65 | 67 | 53 | 33 | 22 | 30 | 43 | 33 | 73 | 65 | 67 | 67 | 63 | 51 | 53 | 42 | 46 | 63 | 68 | 87 | 58 | 73 | 81 | 62 | 52 | 57 | 47 | 42 | 48 | 53 |
BETN121
| index | 2020-05 | 2020-04 | 2020-03 | 2020-02 | 2020-01 | 2019-12 | 2019-11 | 2019-10 | 2019-09 | 2019-07 | 2019-06 | 2019-05 | 2019-04 | 2019-03 | 2019-02 | 2019-01 | 2018-12 | 2018-11 | 2018-10 | 2018-09 | 2018-08 | 2018-07 | 2018-06 | 2018-05 | 2018-04 | 2018-03 | 2018-02 | 2018-01 | 2017-12 | 2017-11 | 2017-10 | 2017-09 |
|---|---|---|---|---|---|---|---|---|---|---|---|---|---|---|---|---|---|---|---|---|---|---|---|---|---|---|---|---|---|---|---|---|
| pm10 | 20 | 22 | 14 | 7.3 | 12 | 6.8 | 4.9 | 1.6 | - | 2 | 6.5 | 10 | 15 | 11 | 16 | 11 | 5.8 | 8.2 | 15 | 8.6 | 8.9 | 12 | 11 | 14 | 10 | 14 | 16 | 6.8 | 6.7 | 11 | 11 | 19 |
| no2 | 5.8 | 6 | 3.9 | 3.5 | 5.2 | 4 | 3.3 | 0.99 | 3.8 | 2.8 | 4.7 | 4.9 | 5.9 | 3.2 | 6.6 | 4 | 4.9 | 8.4 | 7.4 | 6.4 | 6.4 | 6.8 | 5.3 | 6.2 | 6.5 | 8.1 | 12 | 5.1 | 6.8 | 7.5 | 4.8 | 5.6 |
| o3 | 71 | 73 | 61 | 63 | 50 | 30 | 19 | 22 | 35 | 38 | 64 | 70 | 54 | 59 | 50 | 47 | 44 | 35 | 35 | 44 | 52 | 75 | 52 | 70 | 72 | 60 | 49 | 56 | 45 | 37 | 36 | 44 |
| pm25 | 13 | 12 | 10 | 5.9 | 7.8 | 6.1 | 3.9 | - | - | 0.64 | 3.7 | 9 | 13 | 13 | 13 | 9.7 | 5.2 | 6.2 | 9.4 | 6.4 | 5.5 | 5.5 | 8.4 | 8.5 | 6.6 | 11 | 13 | 6 | 4.7 | 9.2 | 6.5 | 13 |
BETN132
| index | 2020-05 | 2020-04 | 2020-03 | 2020-02 | 2020-01 | 2019-12 | 2019-11 | 2019-10 | 2019-09 | 2019-07 | 2019-06 | 2019-05 | 2019-04 | 2019-03 | 2019-02 | 2019-01 | 2018-12 | 2018-11 | 2018-10 | 2018-09 | 2018-08 | 2018-07 | 2018-06 | 2018-05 | 2018-04 | 2018-03 | 2018-02 | 2018-01 | 2017-12 | 2017-11 | 2017-10 | 2017-09 |
|---|---|---|---|---|---|---|---|---|---|---|---|---|---|---|---|---|---|---|---|---|---|---|---|---|---|---|---|---|---|---|---|---|
| pm25 | 8.1 | 8.2 | 7.5 | 6.8 | 6.2 | 4.2 | 3.9 | - | - | 1.2 | 2.8 | 6 | 11 | 7.6 | 12 | 9.7 | 2.6 | 6.8 | 10 | 6.5 | 4 | 4.2 | 7.6 | 9.7 | 5.5 | 11 | 13 | 4.8 | 5 | 8.3 | 6.7 | 13 |
| pm10 | 12 | 15 | 11 | 6.5 | 13 | 5.5 | 5.5 | 1.2 | - | 3.3 | 6.4 | 8.9 | 16 | 9.7 | 15 | 12 | 5.2 | 9.8 | 16 | 9.3 | 7.1 | 11 | 9.9 | 14 | 9.5 | 16 | 16 | 7.4 | 7.2 | 13 | 12 | 18 |
| co | 0.17 | 0.19 | 0.21 | 0.18 | 0.22 | 0.13 | 0.12 | 0.06 | 0.11 | 0.06 | 0.14 | 0.17 | 0.21 | 0.18 | 0.24 | 0.19 | 0.23 | 0.23 | 0.18 | 0.17 | 0.14 | 0.14 | 0.14 | 0.18 | 0.19 | 0.26 | 0.27 | 0.2 | 0.21 | 5.4 | 17 | 21 |
| so2 | 0.96 | 0.95 | 1 | 0.86 | 0.74 | - | - | - | 0.68 | - | 1 | 0.96 | 0.81 | 1 | 1 | - | - | 0.46 | 0.29 | 1 | 0.87 | 0.76 | 0.99 | 0.65 | 2.1 | 2.1 | 2 | 1.5 | 1 | 1.4 | 0.99 | 1 |
| no2 | 4.9 | 5.5 | 4.4 | 4.4 | 7.1 | 4.1 | 4.6 | 1.5 | 4.8 | 2.2 | 4.1 | 5.7 | 6.8 | 6 | 10 | 6.5 | 11 | 12 | 9.1 | 7.8 | 6.6 | 5.8 | 5.3 | 5.4 | 7.5 | 12 | 13 | 8.4 | 9 | 9.9 | 7 | 6.8 |
| o3 | 65 | 64 | 61 | 60 | 44 | 26 | 16 | 18 | 35 | 31 | 49 | 53 | 64 | 58 | 38 | 50 | 39 | 33 | 38 | 36 | 49 | 76 | 49 | 66 | 64 | 54 | 43 | 47 | 38 | 29 | 27 | 34 |