Contaminación del aire en Peshāwar: índice de calidad del aire en tiempo real y alerta de smog.
Previsión de la contaminación y la calidad del aire para Peshāwar. Hoy es martes, 5 de mayo de 2026. Se han registrado los siguientes valores de contaminación atmosférica para Peshāwar:- polvo de partículas (PM2.5) - 577 (Muy malo Peligroso)

¿Cuál es la calidad del aire en Peshāwar la actualidad? ¿El aire está contaminado en Peshāwar? ¿Hay smog?
¿Cuál es el nivel actual de PM2.5 en Peshāwar? (polvo de partículas (PM2.5))
El nivel actual de PM2.5 es:
577 (Muy malo Peligroso)
En comparación, el nivel más alto de PM2.5 en Peshāwar en los últimos 7 días fue: 985 (sábado, 30 de septiembre de 2023) y el más bajo: 47 (lunes, 25 de septiembre de 2023).
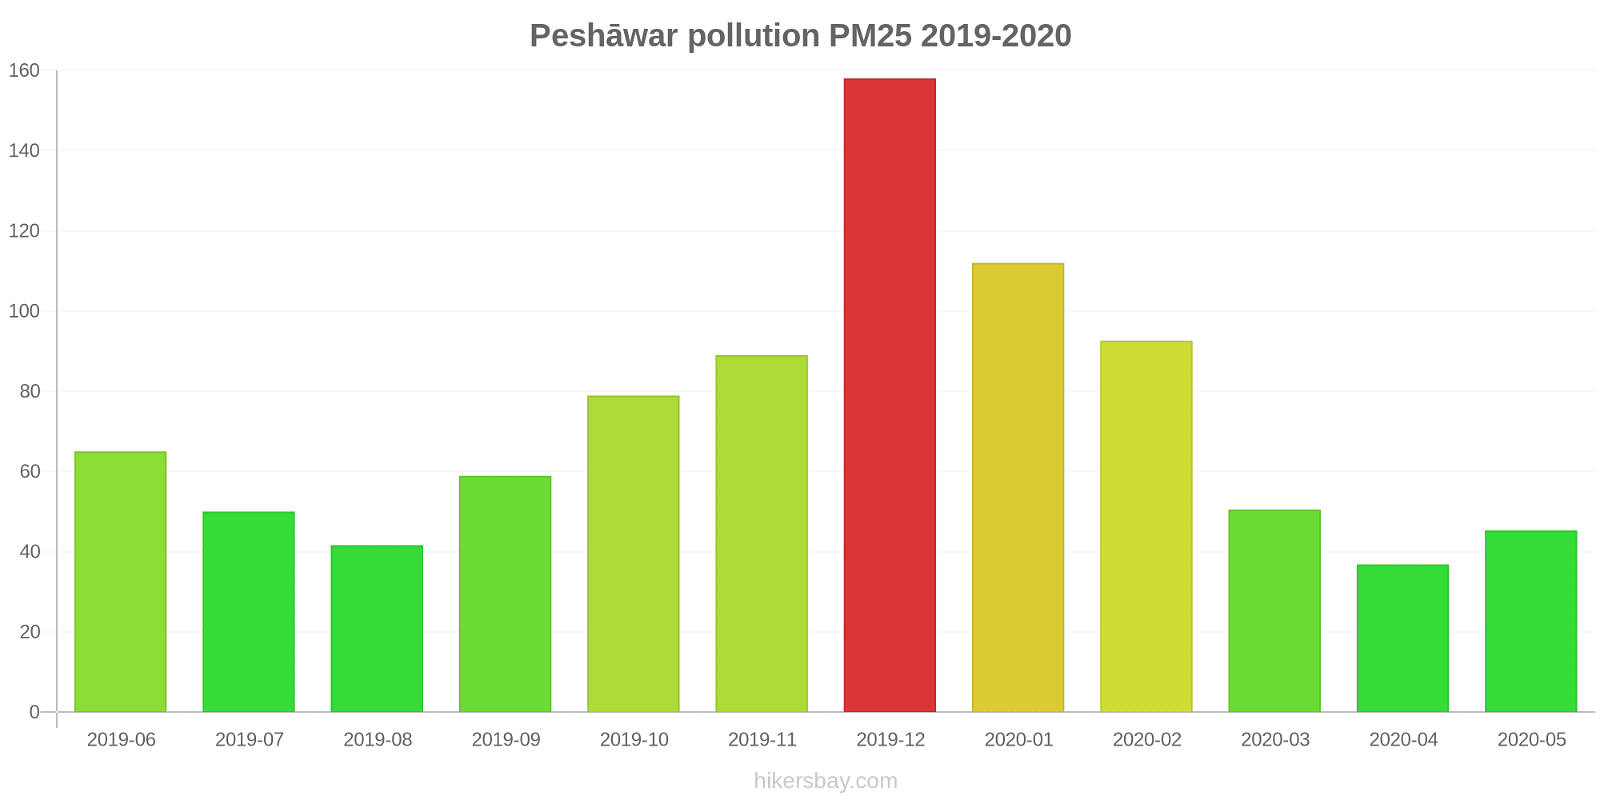
Se registraron los valores PM2.5 más altos: 158 (diciembre de 2019).
El nivel más bajo de contaminación por partículas PM2.5 se produce en el mes: abril (37).
Datos actuales sábado, 30 de septiembre de 2023 23:00
PM2,5 577 (Muy malo Peligroso)
Datos sobre la contaminación atmosférica de los últimos días Peshāwar
index
2024-01-31
2024-02-01
2024-02-02
2024-02-03
2024-02-04
2024-02-05
2024-02-06
2024-02-07
2023-09-24
2023-09-25
2023-09-26
2023-09-27
2023-09-28
2023-09-29
2023-09-30
pm25
157
Very bad Hazardous
111
Very bad Hazardous
86
Very Unhealthy
117
Very bad Hazardous
95
Very Unhealthy
98
Very Unhealthy
74
Unhealthy
87
Very Unhealthy
56
Unhealthy
47
Unhealthy for Sensitive Groups
54
Unhealthy for Sensitive Groups
84
Very Unhealthy
87
Very Unhealthy
307
Very bad Hazardous
985
Very bad Hazardous
data source »
Contaminación atmosférica en Peshāwar de junio de 2019 a mayo de 2020
index
2020-05
2020-04
2020-03
2020-02
2020-01
2019-12
2019-11
2019-10
2019-09
2019-08
2019-07
2019-06
pm25
45 (Unhealthy for Sensitive Groups)
37 (Unhealthy for Sensitive Groups)
51 (Unhealthy for Sensitive Groups)
93 (Very Unhealthy)
112 (Very bad Hazardous)
158 (Very bad Hazardous)
89 (Very Unhealthy)
79 (Very Unhealthy)
59 (Unhealthy)
42 (Unhealthy for Sensitive Groups)
50 (Unhealthy for Sensitive Groups)
65 (Unhealthy)
data source »
Calidad de vida Peshāwar
Green y Parks in the City
Peshāwar
49 %
Afganistán: 35 %
Tayikistán: 66 %
Kirguizistán: 66 %
Uzbekistán: 62 %
Omán: 68 %
partículas de materia PM2.5
Peshāwar
110 (Very bad Hazardous)
El placer de pasar tiempo en la ciudad
Peshāwar
38 %
Afganistán: 24 %
Tayikistán: 69 %
Kirguizistán: 38 %
Uzbekistán: 54 %
Omán: 73 %
partículas de materia PM10
Peshāwar
540 (Very bad Hazardous)
Contaminación del aire
Peshāwar
71 %
Afganistán: 78 %
Tayikistán: 52 %
Kirguizistán: 78 %
Uzbekistán: 53 %
Omán: 34 %
Eliminación de basura
Peshāwar
37 %
Afganistán: 26 %
Tayikistán: 52 %
Kirguizistán: 42 %
Uzbekistán: 45 %
Omán: 67 %
Disponibilidad y calidad del agua potable
Peshāwar
60 %
Afganistán: 37 %
Tayikistán: 54 %
Kirguizistán: 67 %
Uzbekistán: 66 %
Omán: 69 %
Limpieza y orden
Peshāwar
37 %
Afganistán: 32 %
Tayikistán: 67 %
Kirguizistán: 43 %
Uzbekistán: 53 %
Omán: 77 %
Contaminación acústica y lumínica
Peshāwar
54 %
Afganistán: 55 %
Tayikistán: 38 %
Kirguizistán: 43 %
Omán: 37 %
Contaminación del agua
Peshāwar
55 %
Afganistán: 74 %
Tayikistán: 52 %
Kirguizistán: 46 %
Uzbekistán: 51 %
Omán: 38 %
Source: Numbeo
miércoles, 7 de febrero de 2024 5:00
PM2,5 168 (Muy malo Peligroso)
polvo de partículas (PM2.5)
US Diplomatic Post: Peshawar
sábado, 30 de septiembre de 2023 23:00
PM2,5 985 (Muy malo Peligroso)
polvo de partículas (PM2.5)
index
2024-02-07
2024-02-06
2024-02-05
2024-02-04
2024-02-03
2024-02-02
2024-02-01
2024-01-31
pm25
87
74
98
95
117
86
111
157
US Diplomatic Post: Peshawar
index
2023-09-30
2023-09-29
2023-09-28
2023-09-27
2023-09-26
2023-09-25
2023-09-24
pm25
985
307
87
84
54
47
56
US Diplomatic Post: Peshawar
2019-06 2020-05

index
2020-05
2020-04
2020-03
2020-02
2020-01
2019-12
2019-11
2019-10
2019-09
2019-08
2019-07
2019-06
pm25
45
37
51
93
112
158
89
79
59
42
50
65
* Pollution data source:
https://openaq.org
(StateAir_Peshawar)
The data is licensed under CC-By 4.0
PM2,5 577 (Muy malo Peligroso)
Datos sobre la contaminación atmosférica de los últimos días Peshāwar
| index | 2024-01-31 | 2024-02-01 | 2024-02-02 | 2024-02-03 | 2024-02-04 | 2024-02-05 | 2024-02-06 | 2024-02-07 | 2023-09-24 | 2023-09-25 | 2023-09-26 | 2023-09-27 | 2023-09-28 | 2023-09-29 | 2023-09-30 |
|---|---|---|---|---|---|---|---|---|---|---|---|---|---|---|---|
| pm25 | 157 Very bad Hazardous |
111 Very bad Hazardous |
86 Very Unhealthy |
117 Very bad Hazardous |
95 Very Unhealthy |
98 Very Unhealthy |
74 Unhealthy |
87 Very Unhealthy |
56 Unhealthy |
47 Unhealthy for Sensitive Groups |
54 Unhealthy for Sensitive Groups |
84 Very Unhealthy |
87 Very Unhealthy |
307 Very bad Hazardous |
985 Very bad Hazardous |

| index | 2020-05 | 2020-04 | 2020-03 | 2020-02 | 2020-01 | 2019-12 | 2019-11 | 2019-10 | 2019-09 | 2019-08 | 2019-07 | 2019-06 |
|---|---|---|---|---|---|---|---|---|---|---|---|---|
| pm25 | 45 (Unhealthy for Sensitive Groups) | 37 (Unhealthy for Sensitive Groups) | 51 (Unhealthy for Sensitive Groups) | 93 (Very Unhealthy) | 112 (Very bad Hazardous) | 158 (Very bad Hazardous) | 89 (Very Unhealthy) | 79 (Very Unhealthy) | 59 (Unhealthy) | 42 (Unhealthy for Sensitive Groups) | 50 (Unhealthy for Sensitive Groups) | 65 (Unhealthy) |
Green y Parks in the City
Peshāwar 49 %
Afganistán: 35 % Tayikistán: 66 % Kirguizistán: 66 % Uzbekistán: 62 % Omán: 68 %partículas de materia PM2.5
Peshāwar 110 (Very bad Hazardous)
El placer de pasar tiempo en la ciudad
Peshāwar 38 %
Afganistán: 24 % Tayikistán: 69 % Kirguizistán: 38 % Uzbekistán: 54 % Omán: 73 %partículas de materia PM10
Peshāwar 540 (Very bad Hazardous)
Contaminación del aire
Peshāwar 71 %
Afganistán: 78 % Tayikistán: 52 % Kirguizistán: 78 % Uzbekistán: 53 % Omán: 34 %Eliminación de basura
Peshāwar 37 %
Afganistán: 26 % Tayikistán: 52 % Kirguizistán: 42 % Uzbekistán: 45 % Omán: 67 %Disponibilidad y calidad del agua potable
Peshāwar 60 %
Afganistán: 37 % Tayikistán: 54 % Kirguizistán: 67 % Uzbekistán: 66 % Omán: 69 %Limpieza y orden
Peshāwar 37 %
Afganistán: 32 % Tayikistán: 67 % Kirguizistán: 43 % Uzbekistán: 53 % Omán: 77 %Contaminación acústica y lumínica
Peshāwar 54 %
Afganistán: 55 % Tayikistán: 38 % Kirguizistán: 43 % Omán: 37 %Contaminación del agua
Peshāwar 55 %
Afganistán: 74 % Tayikistán: 52 % Kirguizistán: 46 % Uzbekistán: 51 % Omán: 38 %PM2,5 168 (Muy malo Peligroso)
polvo de partículas (PM2.5)PM2,5 985 (Muy malo Peligroso)
polvo de partículas (PM2.5)
| index | 2024-02-07 | 2024-02-06 | 2024-02-05 | 2024-02-04 | 2024-02-03 | 2024-02-02 | 2024-02-01 | 2024-01-31 |
|---|---|---|---|---|---|---|---|---|
| pm25 | 87 | 74 | 98 | 95 | 117 | 86 | 111 | 157 |
US Diplomatic Post: Peshawar
| index | 2023-09-30 | 2023-09-29 | 2023-09-28 | 2023-09-27 | 2023-09-26 | 2023-09-25 | 2023-09-24 |
|---|---|---|---|---|---|---|---|
| pm25 | 985 | 307 | 87 | 84 | 54 | 47 | 56 |
US Diplomatic Post: Peshawar

| index | 2020-05 | 2020-04 | 2020-03 | 2020-02 | 2020-01 | 2019-12 | 2019-11 | 2019-10 | 2019-09 | 2019-08 | 2019-07 | 2019-06 |
|---|---|---|---|---|---|---|---|---|---|---|---|---|
| pm25 | 45 | 37 | 51 | 93 | 112 | 158 | 89 | 79 | 59 | 42 | 50 | 65 |