Air Pollution in Peters Corner: Real-time Air Quality Index and smog alert.
Pollution and air quality forecast for Peters Corner. Today is Saturday, June 20, 2026. The following air pollution values have been recorded for Peters Corner:- particulate matter (PM2.5) dust - 2 (Good)
- particulate matter (PM10) suspended dust - 69 (Unhealthy for Sensitive Groups)

What is the air quality in Peters Corner today? Is the air polluted in Peters Corner?. Is there smog?
What is the current level of PM2.5 in Peters Corner? (particulate matter (PM2.5) dust)
Today's PM2.5 level is:
2 (Good)
For comparison, the highest level of PM2.5 in Peters Corner in the last 7 days was: 14 (Friday, April 12, 2024) and the lowest: 5 (Tuesday, April 9, 2024).
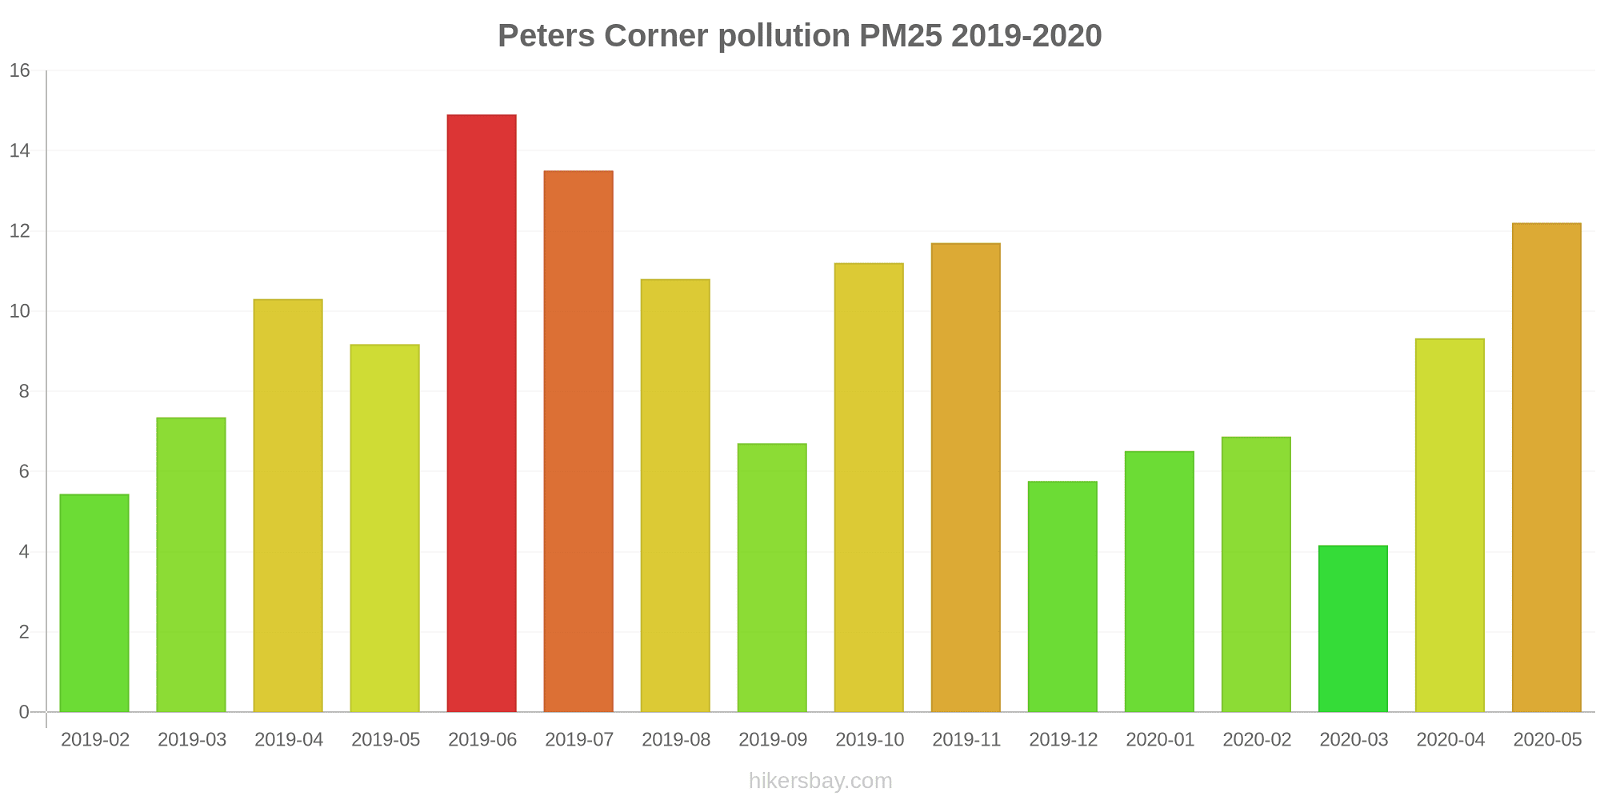
The highest PM2.5 values were recorded: 15 (June 2019).
The lowest level of particulate matter PM2.5 pollution occurs in month: March (4.2).
What is the level of PM10 today in Peters Corner? (particulate matter (PM10) suspended dust)
The current level of particulate matter PM10 in Peters Corner is:
69 (Unhealthy for Sensitive Groups)
The highest PM10 values usually occur in month: 107 (June 2019).
The lowest value of particulate matter PM10 pollution in Peters Corner is usually recorded in: February (23).
Current data Tuesday, April 16, 2024, 10:00 AM
PM2,5 2 (Good)
PM10 69 (Unhealthy for Sensitive Groups)
Data on air pollution from recent days in Peters Corner
index
2024-04-09
2024-04-10
2024-04-11
2024-04-12
2024-04-13
2024-04-14
2024-04-15
2024-04-16
pm25
5
Good
8
Good
12
Good
14
Moderate
11
Good
9
Good
7
Good
7
Good
pm10
18
Good
54
Unhealthy for Sensitive Groups
78
Unhealthy for Sensitive Groups
84
Unhealthy
61
Unhealthy for Sensitive Groups
25
Moderate
22
Moderate
31
Moderate
data source »
Air pollution in Peters Corner from August 2016 to May 2020
index
2020-05
2020-04
2020-03
2020-02
2020-01
2019-12
2019-11
2019-10
2019-09
2019-08
2019-07
2019-06
2019-05
2019-04
2019-03
2019-02
2019-01
2018-12
2018-11
2018-10
2018-09
2018-08
2018-07
2018-06
2018-05
2018-04
2018-03
2018-02
2018-01
2017-12
2017-11
2017-10
2017-09
2017-08
2017-07
2017-06
2017-05
2017-04
2017-03
2017-02
2017-01
2016-12
2016-11
2016-10
2016-09
2016-08
pm10
85 (Unhealthy)
61 (Unhealthy for Sensitive Groups)
29 (Moderate)
51 (Unhealthy for Sensitive Groups)
32 (Moderate)
26 (Moderate)
80 (Unhealthy)
92 (Unhealthy)
55 (Unhealthy for Sensitive Groups)
69 (Unhealthy for Sensitive Groups)
87 (Unhealthy)
107 (Unhealthy)
60 (Unhealthy for Sensitive Groups)
70 (Unhealthy for Sensitive Groups)
43 (Moderate)
23 (Moderate)
27 (Moderate)
35 (Moderate)
71 (Unhealthy for Sensitive Groups)
32 (Moderate)
80 (Unhealthy)
56 (Unhealthy for Sensitive Groups)
58 (Unhealthy for Sensitive Groups)
61 (Unhealthy for Sensitive Groups)
51 (Unhealthy for Sensitive Groups)
59 (Unhealthy for Sensitive Groups)
41 (Moderate)
63 (Unhealthy for Sensitive Groups)
51 (Unhealthy for Sensitive Groups)
62 (Unhealthy for Sensitive Groups)
67 (Unhealthy for Sensitive Groups)
82 (Unhealthy)
57 (Unhealthy for Sensitive Groups)
67 (Unhealthy for Sensitive Groups)
56 (Unhealthy for Sensitive Groups)
67 (Unhealthy for Sensitive Groups)
49 (Moderate)
49 (Moderate)
49 (Moderate)
39 (Moderate)
23 (Moderate)
38 (Moderate)
47 (Moderate)
74 (Unhealthy for Sensitive Groups)
54 (Unhealthy for Sensitive Groups)
57 (Unhealthy for Sensitive Groups)
pm25
12 (Good)
9.3 (Good)
4.2 (Good)
6.9 (Good)
6.5 (Good)
5.8 (Good)
12 (Good)
11 (Good)
6.7 (Good)
11 (Good)
14 (Moderate)
15 (Moderate)
9.2 (Good)
10 (Good)
7.3 (Good)
5.4 (Good)
- (Good)
- (Good)
- (Good)
- (Good)
- (Good)
- (Good)
- (Good)
- (Good)
- (Good)
- (Good)
- (Good)
- (Good)
- (Good)
- (Good)
- (Good)
- (Good)
- (Good)
- (Good)
- (Good)
- (Good)
- (Good)
- (Good)
- (Good)
- (Good)
- (Good)
- (Good)
- (Good)
- (Good)
- (Good)
- (Good)
data source »
Hidden Valley
Tuesday, April 16, 2024, 10:00 AM
PM2,5 1.8 (Good)
particulate matter (PM2.5) dust
PM10 69 (Unhealthy for Sensitive Groups)
particulate matter (PM10) suspended dust
Hidden Valley
index
2024-04-16
2024-04-15
2024-04-14
2024-04-13
2024-04-12
2024-04-11
2024-04-10
2024-04-09
pm25
7
7.1
8.7
11
14
12
8.4
5.5
pm10
31
22
25
61
84
78
54
18
Hidden Valley
2016-08 2020-05

index
2020-05
2020-04
2020-03
2020-02
2020-01
2019-12
2019-11
2019-10
2019-09
2019-08
2019-07
2019-06
2019-05
2019-04
2019-03
2019-02
2019-01
2018-12
2018-11
2018-10
2018-09
2018-08
2018-07
2018-06
2018-05
2018-04
2018-03
2018-02
2018-01
2017-12
2017-11
2017-10
2017-09
2017-08
2017-07
2017-06
2017-05
2017-04
2017-03
2017-02
2017-01
2016-12
2016-11
2016-10
2016-09
2016-08
pm10
85
61
29
51
32
26
80
92
55
69
87
107
60
70
43
23
27
35
71
32
80
56
58
61
51
59
41
63
51
62
67
82
57
67
56
67
49
49
49
39
23
38
47
74
54
57
pm25
12
9.3
4.2
6.9
6.5
5.8
12
11
6.7
11
14
15
9.2
10
7.3
5.4
-
-
-
-
-
-
-
-
-
-
-
-
-
-
-
-
-
-
-
-
-
-
-
-
-
-
-
-
-
-
* Pollution data source:
https://openaq.org
(AirNow)
The data is licensed under CC-By 4.0
PM2,5 2 (Good)
PM10 69 (Unhealthy for Sensitive Groups)
Data on air pollution from recent days in Peters Corner
| index | 2024-04-09 | 2024-04-10 | 2024-04-11 | 2024-04-12 | 2024-04-13 | 2024-04-14 | 2024-04-15 | 2024-04-16 |
|---|---|---|---|---|---|---|---|---|
| pm25 | 5 Good |
8 Good |
12 Good |
14 Moderate |
11 Good |
9 Good |
7 Good |
7 Good |
| pm10 | 18 Good |
54 Unhealthy for Sensitive Groups |
78 Unhealthy for Sensitive Groups |
84 Unhealthy |
61 Unhealthy for Sensitive Groups |
25 Moderate |
22 Moderate |
31 Moderate |

| index | 2020-05 | 2020-04 | 2020-03 | 2020-02 | 2020-01 | 2019-12 | 2019-11 | 2019-10 | 2019-09 | 2019-08 | 2019-07 | 2019-06 | 2019-05 | 2019-04 | 2019-03 | 2019-02 | 2019-01 | 2018-12 | 2018-11 | 2018-10 | 2018-09 | 2018-08 | 2018-07 | 2018-06 | 2018-05 | 2018-04 | 2018-03 | 2018-02 | 2018-01 | 2017-12 | 2017-11 | 2017-10 | 2017-09 | 2017-08 | 2017-07 | 2017-06 | 2017-05 | 2017-04 | 2017-03 | 2017-02 | 2017-01 | 2016-12 | 2016-11 | 2016-10 | 2016-09 | 2016-08 |
|---|---|---|---|---|---|---|---|---|---|---|---|---|---|---|---|---|---|---|---|---|---|---|---|---|---|---|---|---|---|---|---|---|---|---|---|---|---|---|---|---|---|---|---|---|---|---|
| pm10 | 85 (Unhealthy) | 61 (Unhealthy for Sensitive Groups) | 29 (Moderate) | 51 (Unhealthy for Sensitive Groups) | 32 (Moderate) | 26 (Moderate) | 80 (Unhealthy) | 92 (Unhealthy) | 55 (Unhealthy for Sensitive Groups) | 69 (Unhealthy for Sensitive Groups) | 87 (Unhealthy) | 107 (Unhealthy) | 60 (Unhealthy for Sensitive Groups) | 70 (Unhealthy for Sensitive Groups) | 43 (Moderate) | 23 (Moderate) | 27 (Moderate) | 35 (Moderate) | 71 (Unhealthy for Sensitive Groups) | 32 (Moderate) | 80 (Unhealthy) | 56 (Unhealthy for Sensitive Groups) | 58 (Unhealthy for Sensitive Groups) | 61 (Unhealthy for Sensitive Groups) | 51 (Unhealthy for Sensitive Groups) | 59 (Unhealthy for Sensitive Groups) | 41 (Moderate) | 63 (Unhealthy for Sensitive Groups) | 51 (Unhealthy for Sensitive Groups) | 62 (Unhealthy for Sensitive Groups) | 67 (Unhealthy for Sensitive Groups) | 82 (Unhealthy) | 57 (Unhealthy for Sensitive Groups) | 67 (Unhealthy for Sensitive Groups) | 56 (Unhealthy for Sensitive Groups) | 67 (Unhealthy for Sensitive Groups) | 49 (Moderate) | 49 (Moderate) | 49 (Moderate) | 39 (Moderate) | 23 (Moderate) | 38 (Moderate) | 47 (Moderate) | 74 (Unhealthy for Sensitive Groups) | 54 (Unhealthy for Sensitive Groups) | 57 (Unhealthy for Sensitive Groups) |
| pm25 | 12 (Good) | 9.3 (Good) | 4.2 (Good) | 6.9 (Good) | 6.5 (Good) | 5.8 (Good) | 12 (Good) | 11 (Good) | 6.7 (Good) | 11 (Good) | 14 (Moderate) | 15 (Moderate) | 9.2 (Good) | 10 (Good) | 7.3 (Good) | 5.4 (Good) | - (Good) | - (Good) | - (Good) | - (Good) | - (Good) | - (Good) | - (Good) | - (Good) | - (Good) | - (Good) | - (Good) | - (Good) | - (Good) | - (Good) | - (Good) | - (Good) | - (Good) | - (Good) | - (Good) | - (Good) | - (Good) | - (Good) | - (Good) | - (Good) | - (Good) | - (Good) | - (Good) | - (Good) | - (Good) | - (Good) |
PM2,5 1.8 (Good)
particulate matter (PM2.5) dustPM10 69 (Unhealthy for Sensitive Groups)
particulate matter (PM10) suspended dustHidden Valley
| index | 2024-04-16 | 2024-04-15 | 2024-04-14 | 2024-04-13 | 2024-04-12 | 2024-04-11 | 2024-04-10 | 2024-04-09 |
|---|---|---|---|---|---|---|---|---|
| pm25 | 7 | 7.1 | 8.7 | 11 | 14 | 12 | 8.4 | 5.5 |
| pm10 | 31 | 22 | 25 | 61 | 84 | 78 | 54 | 18 |
Hidden Valley

| index | 2020-05 | 2020-04 | 2020-03 | 2020-02 | 2020-01 | 2019-12 | 2019-11 | 2019-10 | 2019-09 | 2019-08 | 2019-07 | 2019-06 | 2019-05 | 2019-04 | 2019-03 | 2019-02 | 2019-01 | 2018-12 | 2018-11 | 2018-10 | 2018-09 | 2018-08 | 2018-07 | 2018-06 | 2018-05 | 2018-04 | 2018-03 | 2018-02 | 2018-01 | 2017-12 | 2017-11 | 2017-10 | 2017-09 | 2017-08 | 2017-07 | 2017-06 | 2017-05 | 2017-04 | 2017-03 | 2017-02 | 2017-01 | 2016-12 | 2016-11 | 2016-10 | 2016-09 | 2016-08 |
|---|---|---|---|---|---|---|---|---|---|---|---|---|---|---|---|---|---|---|---|---|---|---|---|---|---|---|---|---|---|---|---|---|---|---|---|---|---|---|---|---|---|---|---|---|---|---|
| pm10 | 85 | 61 | 29 | 51 | 32 | 26 | 80 | 92 | 55 | 69 | 87 | 107 | 60 | 70 | 43 | 23 | 27 | 35 | 71 | 32 | 80 | 56 | 58 | 61 | 51 | 59 | 41 | 63 | 51 | 62 | 67 | 82 | 57 | 67 | 56 | 67 | 49 | 49 | 49 | 39 | 23 | 38 | 47 | 74 | 54 | 57 |
| pm25 | 12 | 9.3 | 4.2 | 6.9 | 6.5 | 5.8 | 12 | 11 | 6.7 | 11 | 14 | 15 | 9.2 | 10 | 7.3 | 5.4 | - | - | - | - | - | - | - | - | - | - | - | - | - | - | - | - | - | - | - | - | - | - | - | - | - | - | - | - | - | - |