Air Pollution in Cornwall: Real-time Air Quality Index and smog alert.
Pollution and air quality forecast for Cornwall. Today is Thursday, June 25, 2026. The following air pollution values have been recorded for Cornwall:- particulate matter (PM10) suspended dust - 20 (Moderate)
- particulate matter (PM2.5) dust - 3 (Good)

What is the air quality in Cornwall today? Is the air polluted in Cornwall?. Is there smog?
What is the level of PM10 today in Cornwall? (particulate matter (PM10) suspended dust)
The current level of particulate matter PM10 in Cornwall is:
20 (Moderate)
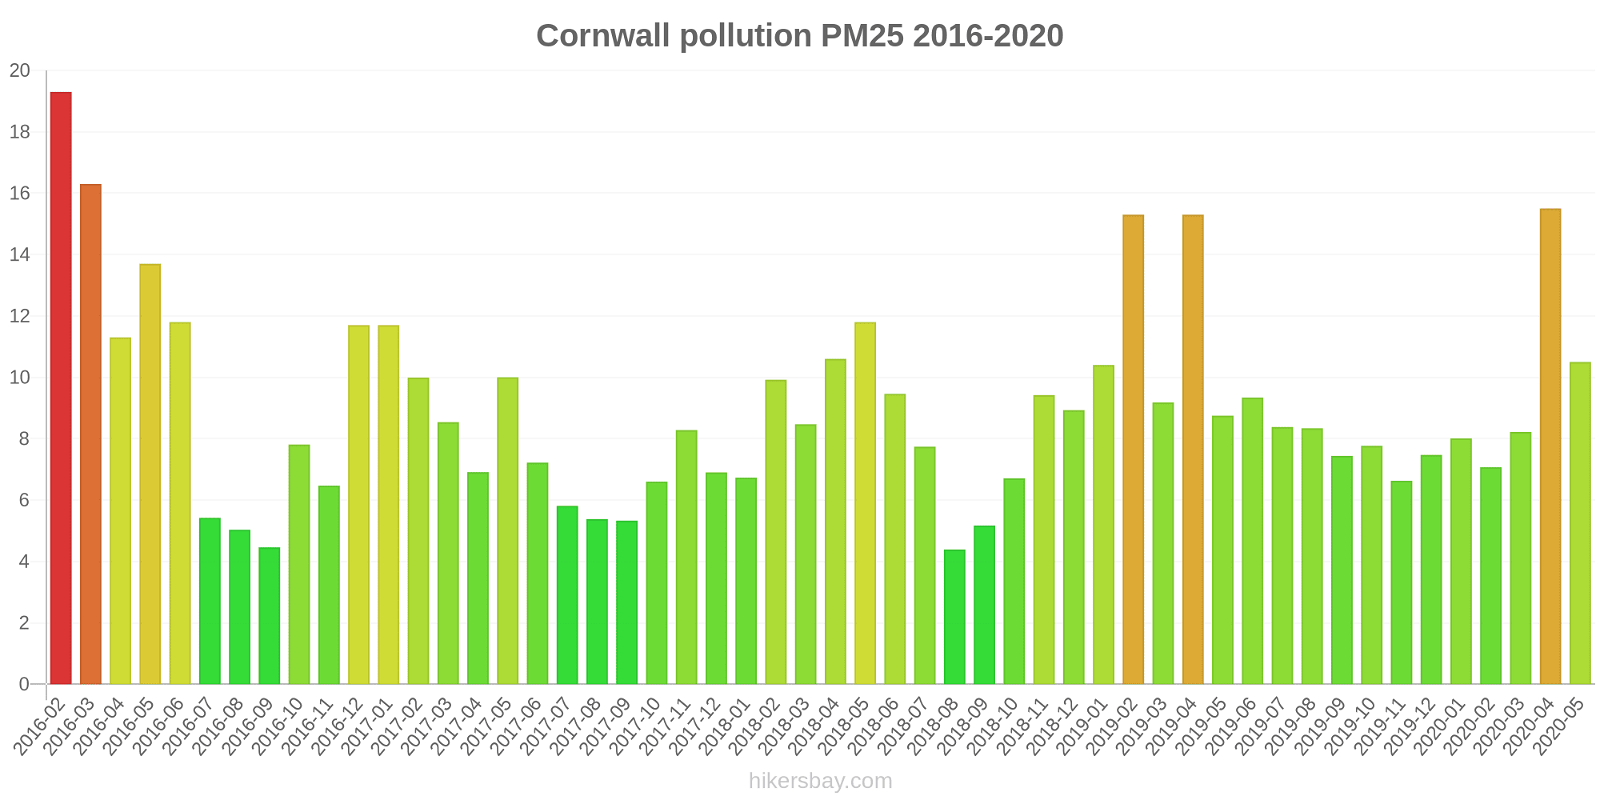
The highest PM10 values usually occur in month: 25 (April 2020).
The lowest value of particulate matter PM10 pollution in Cornwall is usually recorded in: July (9.1).
What is the current level of PM2.5 in Cornwall? (particulate matter (PM2.5) dust)
Today's PM2.5 level is:
3 (Good)
For comparison, the highest level of PM2.5 in Cornwall in the last 7 days was: 3 (Saturday, April 13, 2024) and the lowest: 1 (Thursday, April 11, 2024).
The highest PM2.5 values were recorded: 19 (February 2016).
The lowest level of particulate matter PM2.5 pollution occurs in month: August (4.4).
Current data Tuesday, April 16, 2024, 12:00 AM
PM10 20 (Moderate)
PM2,5 3 (Good)
Data on air pollution from recent days in Cornwall
index
2024-04-10
2024-04-11
2024-04-12
2024-04-13
2024-04-14
2024-04-15
2024-04-16
pm25
2
Good
1
Good
2
Good
3
Good
3
Good
3
Good
3
Good
pm10
12
Good
7
Good
15
Good
16
Good
15
Good
16
Good
20
Moderate
data source »
Air pollution in Cornwall from February 2016 to May 2020
index
2020-05
2020-04
2020-03
2020-02
2020-01
2019-12
2019-11
2019-10
2019-09
2019-08
2019-07
2019-06
2019-05
2019-04
2019-03
2019-02
2019-01
2018-12
2018-11
2018-10
2018-09
2018-08
2018-07
2018-06
2018-05
2018-04
2018-03
2018-02
2018-01
2017-12
2017-11
2017-10
2017-09
2017-08
2017-07
2017-06
2017-05
2017-04
2017-03
2017-02
2017-01
2016-12
2016-11
2016-10
2016-09
2016-08
2016-07
2016-06
2016-05
2016-04
2016-03
2016-02
pm25
11 (Good)
16 (Moderate)
8.2 (Good)
7.1 (Good)
8 (Good)
7.5 (Good)
6.6 (Good)
7.8 (Good)
7.4 (Good)
8.3 (Good)
8.4 (Good)
9.3 (Good)
8.8 (Good)
15 (Moderate)
9.2 (Good)
15 (Moderate)
10 (Good)
8.9 (Good)
9.4 (Good)
6.7 (Good)
5.2 (Good)
4.4 (Good)
7.7 (Good)
9.5 (Good)
12 (Good)
11 (Good)
8.5 (Good)
9.9 (Good)
6.7 (Good)
6.9 (Good)
8.3 (Good)
6.6 (Good)
5.3 (Good)
5.4 (Good)
5.8 (Good)
7.2 (Good)
10 (Good)
6.9 (Good)
8.5 (Good)
10 (Good)
12 (Good)
12 (Good)
6.5 (Good)
7.8 (Good)
4.5 (Good)
5 (Good)
5.4 (Good)
12 (Good)
14 (Moderate)
11 (Good)
16 (Moderate)
19 (Moderate)
pm10
18 (Good)
25 (Moderate)
16 (Good)
17 (Good)
19 (Good)
20 (Good)
14 (Good)
16 (Good)
17 (Good)
20 (Good)
14 (Good)
15 (Good)
17 (Good)
24 (Moderate)
18 (Good)
24 (Moderate)
18 (Good)
19 (Good)
21 (Moderate)
15 (Good)
13 (Good)
10 (Good)
15 (Good)
18 (Good)
19 (Good)
19 (Good)
16 (Good)
18 (Good)
15 (Good)
13 (Good)
16 (Good)
14 (Good)
11 (Good)
11 (Good)
10 (Good)
14 (Good)
17 (Good)
14 (Good)
16 (Good)
17 (Good)
19 (Good)
20 (Moderate)
13 (Good)
15 (Good)
12 (Good)
12 (Good)
9.1 (Good)
17 (Good)
16 (Good)
13 (Good)
19 (Good)
21 (Moderate)
data source »
Quality of life in Cornwall
Green and Parks in the City
Cornwall
72%
Isle of Man: 78%
Ireland: 72%
Netherlands: 82%
Belgium: 64%
Faroe Islands: 87%
Pleasure of spending time in the city
Cornwall
72%
Isle of Man: 83%
Ireland: 78%
Netherlands: 88%
Belgium: 64%
Faroe Islands: 100%
Air Pollution
Cornwall
31%
Isle of Man: 13%
Ireland: 24%
Netherlands: 21%
Belgium: 45%
Faroe Islands: 0%
Garbage Disposal
Cornwall
59%
Isle of Man: 78%
Ireland: 61%
Netherlands: 79%
Belgium: 54%
Faroe Islands: 88%
Availability and quality of drinking water
Cornwall
56%
Isle of Man: 88%
Ireland: 72%
Netherlands: 92%
Belgium: 70%
Faroe Islands: 98%
Cleanliness and tidiness
Cornwall
63%
Isle of Man: 69%
Ireland: 52%
Netherlands: 77%
Belgium: 46%
Faroe Islands: 94%
Noise and Light pollution
Cornwall
61%
Isle of Man: 12%
Ireland: 37%
Netherlands: 31%
Belgium: 54%
Faroe Islands: 21%
Water Pollution
Cornwall
41%
Isle of Man: 13%
Ireland: 37%
Netherlands: 17%
Belgium: 42%
Faroe Islands: 7.7%
Source: Numbeo
Saltash Callington Road
Tuesday, April 16, 2024, 12:00 AM
PM10 20 (Moderate)
particulate matter (PM10) suspended dust
PM2,5 3 (Good)
particulate matter (PM2.5) dust
Saltash Callington Road
index
2024-04-16
2024-04-15
2024-04-14
2024-04-13
2024-04-12
2024-04-11
2024-04-10
pm25
3
2.8
3.1
3.4
2.3
1.1
2
pm10
20
16
15
16
15
7.3
12
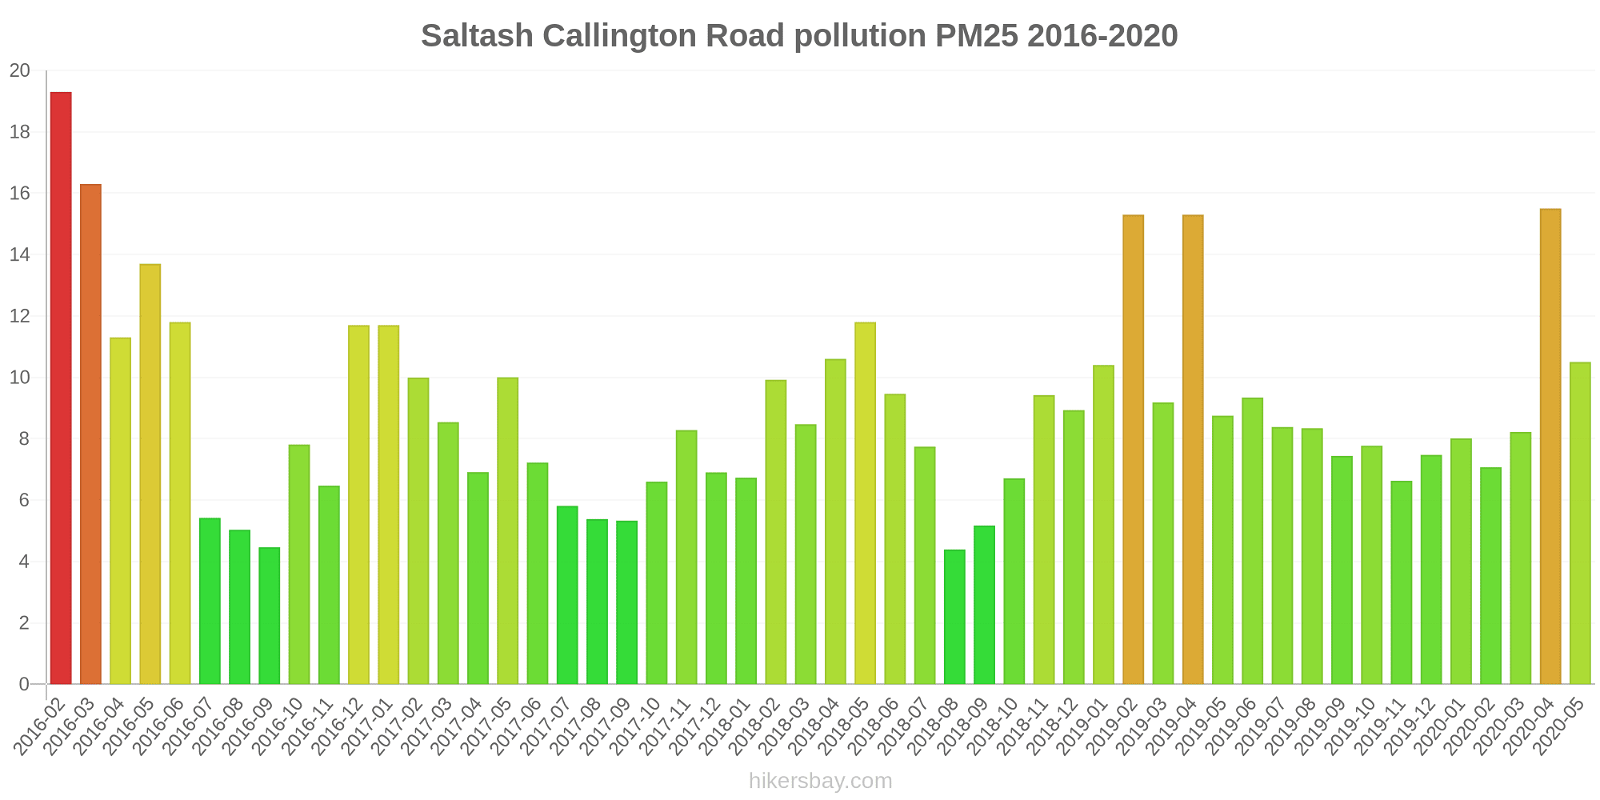
Saltash Callington Road
2016-02 2020-05
index
2020-05
2020-04
2020-03
2020-02
2020-01
2019-12
2019-11
2019-10
2019-09
2019-08
2019-07
2019-06
2019-05
2019-04
2019-03
2019-02
2019-01
2018-12
2018-11
2018-10
2018-09
2018-08
2018-07
2018-06
2018-05
2018-04
2018-03
2018-02
2018-01
2017-12
2017-11
2017-10
2017-09
2017-08
2017-07
2017-06
2017-05
2017-04
2017-03
2017-02
2017-01
2016-12
2016-11
2016-10
2016-09
2016-08
2016-07
2016-06
2016-05
2016-04
2016-03
2016-02
pm25
11
16
8.2
7.1
8
7.5
6.6
7.8
7.4
8.3
8.4
9.3
8.8
15
9.2
15
10
8.9
9.4
6.7
5.2
4.4
7.7
9.5
12
11
8.5
9.9
6.7
6.9
8.3
6.6
5.3
5.4
5.8
7.2
10
6.9
8.5
10
12
12
6.5
7.8
4.5
5
5.4
12
14
11
16
19
pm10
18
25
16
17
19
20
14
16
17
20
14
15
17
24
18
24
18
19
21
15
13
10
15
18
19
19
16
18
15
13
16
14
11
11
10
14
17
14
16
17
19
20
13
15
12
12
9.1
17
16
13
19
21
* Pollution data source:
https://openaq.org
(DEFRA)
The data is licensed under CC-By 4.0
PM10 20 (Moderate)
PM2,5 3 (Good)
Data on air pollution from recent days in Cornwall
| index | 2024-04-10 | 2024-04-11 | 2024-04-12 | 2024-04-13 | 2024-04-14 | 2024-04-15 | 2024-04-16 |
|---|---|---|---|---|---|---|---|
| pm25 | 2 Good |
1 Good |
2 Good |
3 Good |
3 Good |
3 Good |
3 Good |
| pm10 | 12 Good |
7 Good |
15 Good |
16 Good |
15 Good |
16 Good |
20 Moderate |

| index | 2020-05 | 2020-04 | 2020-03 | 2020-02 | 2020-01 | 2019-12 | 2019-11 | 2019-10 | 2019-09 | 2019-08 | 2019-07 | 2019-06 | 2019-05 | 2019-04 | 2019-03 | 2019-02 | 2019-01 | 2018-12 | 2018-11 | 2018-10 | 2018-09 | 2018-08 | 2018-07 | 2018-06 | 2018-05 | 2018-04 | 2018-03 | 2018-02 | 2018-01 | 2017-12 | 2017-11 | 2017-10 | 2017-09 | 2017-08 | 2017-07 | 2017-06 | 2017-05 | 2017-04 | 2017-03 | 2017-02 | 2017-01 | 2016-12 | 2016-11 | 2016-10 | 2016-09 | 2016-08 | 2016-07 | 2016-06 | 2016-05 | 2016-04 | 2016-03 | 2016-02 |
|---|---|---|---|---|---|---|---|---|---|---|---|---|---|---|---|---|---|---|---|---|---|---|---|---|---|---|---|---|---|---|---|---|---|---|---|---|---|---|---|---|---|---|---|---|---|---|---|---|---|---|---|---|
| pm25 | 11 (Good) | 16 (Moderate) | 8.2 (Good) | 7.1 (Good) | 8 (Good) | 7.5 (Good) | 6.6 (Good) | 7.8 (Good) | 7.4 (Good) | 8.3 (Good) | 8.4 (Good) | 9.3 (Good) | 8.8 (Good) | 15 (Moderate) | 9.2 (Good) | 15 (Moderate) | 10 (Good) | 8.9 (Good) | 9.4 (Good) | 6.7 (Good) | 5.2 (Good) | 4.4 (Good) | 7.7 (Good) | 9.5 (Good) | 12 (Good) | 11 (Good) | 8.5 (Good) | 9.9 (Good) | 6.7 (Good) | 6.9 (Good) | 8.3 (Good) | 6.6 (Good) | 5.3 (Good) | 5.4 (Good) | 5.8 (Good) | 7.2 (Good) | 10 (Good) | 6.9 (Good) | 8.5 (Good) | 10 (Good) | 12 (Good) | 12 (Good) | 6.5 (Good) | 7.8 (Good) | 4.5 (Good) | 5 (Good) | 5.4 (Good) | 12 (Good) | 14 (Moderate) | 11 (Good) | 16 (Moderate) | 19 (Moderate) |
| pm10 | 18 (Good) | 25 (Moderate) | 16 (Good) | 17 (Good) | 19 (Good) | 20 (Good) | 14 (Good) | 16 (Good) | 17 (Good) | 20 (Good) | 14 (Good) | 15 (Good) | 17 (Good) | 24 (Moderate) | 18 (Good) | 24 (Moderate) | 18 (Good) | 19 (Good) | 21 (Moderate) | 15 (Good) | 13 (Good) | 10 (Good) | 15 (Good) | 18 (Good) | 19 (Good) | 19 (Good) | 16 (Good) | 18 (Good) | 15 (Good) | 13 (Good) | 16 (Good) | 14 (Good) | 11 (Good) | 11 (Good) | 10 (Good) | 14 (Good) | 17 (Good) | 14 (Good) | 16 (Good) | 17 (Good) | 19 (Good) | 20 (Moderate) | 13 (Good) | 15 (Good) | 12 (Good) | 12 (Good) | 9.1 (Good) | 17 (Good) | 16 (Good) | 13 (Good) | 19 (Good) | 21 (Moderate) |
Green and Parks in the City
Cornwall 72%
Isle of Man: 78% Ireland: 72% Netherlands: 82% Belgium: 64% Faroe Islands: 87%Pleasure of spending time in the city
Cornwall 72%
Isle of Man: 83% Ireland: 78% Netherlands: 88% Belgium: 64% Faroe Islands: 100%Air Pollution
Cornwall 31%
Isle of Man: 13% Ireland: 24% Netherlands: 21% Belgium: 45% Faroe Islands: 0%Garbage Disposal
Cornwall 59%
Isle of Man: 78% Ireland: 61% Netherlands: 79% Belgium: 54% Faroe Islands: 88%Availability and quality of drinking water
Cornwall 56%
Isle of Man: 88% Ireland: 72% Netherlands: 92% Belgium: 70% Faroe Islands: 98%Cleanliness and tidiness
Cornwall 63%
Isle of Man: 69% Ireland: 52% Netherlands: 77% Belgium: 46% Faroe Islands: 94%Noise and Light pollution
Cornwall 61%
Isle of Man: 12% Ireland: 37% Netherlands: 31% Belgium: 54% Faroe Islands: 21%Water Pollution
Cornwall 41%
Isle of Man: 13% Ireland: 37% Netherlands: 17% Belgium: 42% Faroe Islands: 7.7%PM10 20 (Moderate)
particulate matter (PM10) suspended dustPM2,5 3 (Good)
particulate matter (PM2.5) dustSaltash Callington Road
| index | 2024-04-16 | 2024-04-15 | 2024-04-14 | 2024-04-13 | 2024-04-12 | 2024-04-11 | 2024-04-10 |
|---|---|---|---|---|---|---|---|
| pm25 | 3 | 2.8 | 3.1 | 3.4 | 2.3 | 1.1 | 2 |
| pm10 | 20 | 16 | 15 | 16 | 15 | 7.3 | 12 |
Saltash Callington Road
| index | 2020-05 | 2020-04 | 2020-03 | 2020-02 | 2020-01 | 2019-12 | 2019-11 | 2019-10 | 2019-09 | 2019-08 | 2019-07 | 2019-06 | 2019-05 | 2019-04 | 2019-03 | 2019-02 | 2019-01 | 2018-12 | 2018-11 | 2018-10 | 2018-09 | 2018-08 | 2018-07 | 2018-06 | 2018-05 | 2018-04 | 2018-03 | 2018-02 | 2018-01 | 2017-12 | 2017-11 | 2017-10 | 2017-09 | 2017-08 | 2017-07 | 2017-06 | 2017-05 | 2017-04 | 2017-03 | 2017-02 | 2017-01 | 2016-12 | 2016-11 | 2016-10 | 2016-09 | 2016-08 | 2016-07 | 2016-06 | 2016-05 | 2016-04 | 2016-03 | 2016-02 |
|---|---|---|---|---|---|---|---|---|---|---|---|---|---|---|---|---|---|---|---|---|---|---|---|---|---|---|---|---|---|---|---|---|---|---|---|---|---|---|---|---|---|---|---|---|---|---|---|---|---|---|---|---|
| pm25 | 11 | 16 | 8.2 | 7.1 | 8 | 7.5 | 6.6 | 7.8 | 7.4 | 8.3 | 8.4 | 9.3 | 8.8 | 15 | 9.2 | 15 | 10 | 8.9 | 9.4 | 6.7 | 5.2 | 4.4 | 7.7 | 9.5 | 12 | 11 | 8.5 | 9.9 | 6.7 | 6.9 | 8.3 | 6.6 | 5.3 | 5.4 | 5.8 | 7.2 | 10 | 6.9 | 8.5 | 10 | 12 | 12 | 6.5 | 7.8 | 4.5 | 5 | 5.4 | 12 | 14 | 11 | 16 | 19 |
| pm10 | 18 | 25 | 16 | 17 | 19 | 20 | 14 | 16 | 17 | 20 | 14 | 15 | 17 | 24 | 18 | 24 | 18 | 19 | 21 | 15 | 13 | 10 | 15 | 18 | 19 | 19 | 16 | 18 | 15 | 13 | 16 | 14 | 11 | 11 | 10 | 14 | 17 | 14 | 16 | 17 | 19 | 20 | 13 | 15 | 12 | 12 | 9.1 | 17 | 16 | 13 | 19 | 21 |