Air Pollution in Cumbria: Real-time Air Quality Index and smog alert.
Pollution and air quality forecast for Cumbria. Today is Tuesday, June 16, 2026. The following air pollution values have been recorded for Cumbria:- ozone (O3) - 71 (Moderate)
- nitrogen dioxide (NO2) - 2 (Good)
- sulfur dioxide (SO2) - 0 (Good)
- particulate matter (PM10) suspended dust - 53 (Unhealthy for Sensitive Groups)
- particulate matter (PM2.5) dust - 12 (Good)
- carbon monoxide (CO) - 69 (Good)
- black carbon (BC) - 0 (Good)

What is the air quality in Cumbria today? Is the air polluted in Cumbria?. Is there smog?
How is the O3 level today in Cumbria? (ozone (O3))
71 (Moderate)
How high is the level of NO2? (nitrogen dioxide (NO2))
2 (Good)
What is the level of SO2 pollution? (sulfur dioxide (SO2))
0 (Good)
What is the level of PM10 today in Cumbria? (particulate matter (PM10) suspended dust)
The current level of particulate matter PM10 in Cumbria is:
53 (Unhealthy for Sensitive Groups)
The highest PM10 values usually occur in month: 29 (April 2019).
The lowest value of particulate matter PM10 pollution in Cumbria is usually recorded in: July (7.7).
What is the current level of PM2.5 in Cumbria? (particulate matter (PM2.5) dust)
Today's PM2.5 level is:
12 (Good)
The highest PM2.5 values were recorded: 18 (April 2019).
The lowest level of particulate matter PM2.5 pollution occurs in month: August (4.7).
How high is the CO level? (carbon monoxide (CO))
69 (Good)
What is the level of black carbon pollution? (black carbon (BC))
0 (Good)
Current data Friday, May 27, 2022, 3:00 PM
O3 71 (Moderate)
NO2 2 (Good)
SO2 0 (Good)
PM10 53 (Unhealthy for Sensitive Groups)
PM2,5 12 (Good)
CO 69 (Good)
BC 0 (Good)
Data on air pollution from recent days in Cumbria
index
2022-05-27
o3
14
Good
no2
9
Good
so2
1
Good
pm10
39
Moderate
pm25
-44
Good
co
25
Good
bc
0
Good
data source »
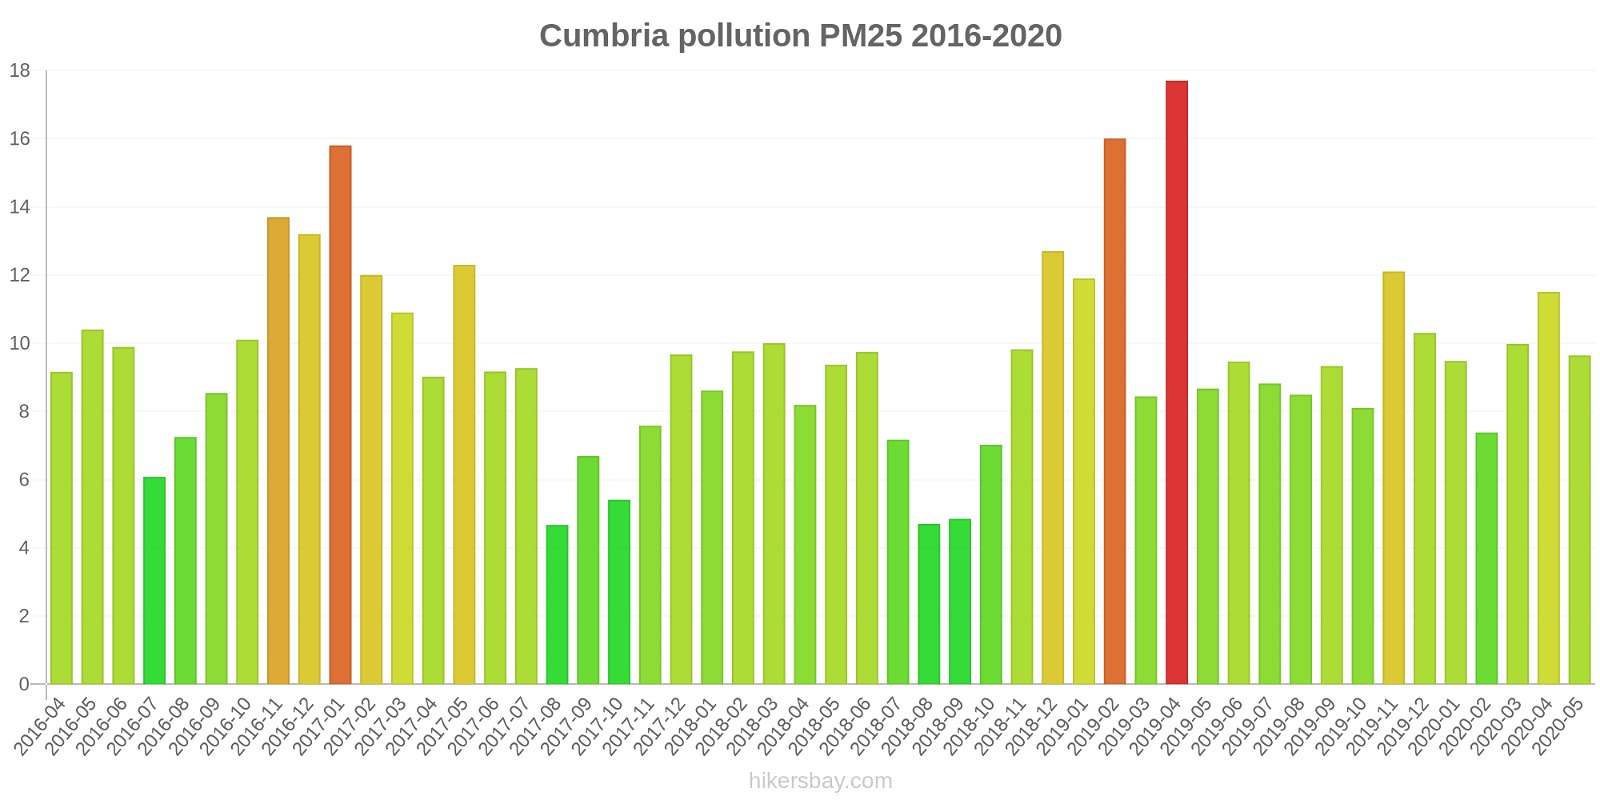
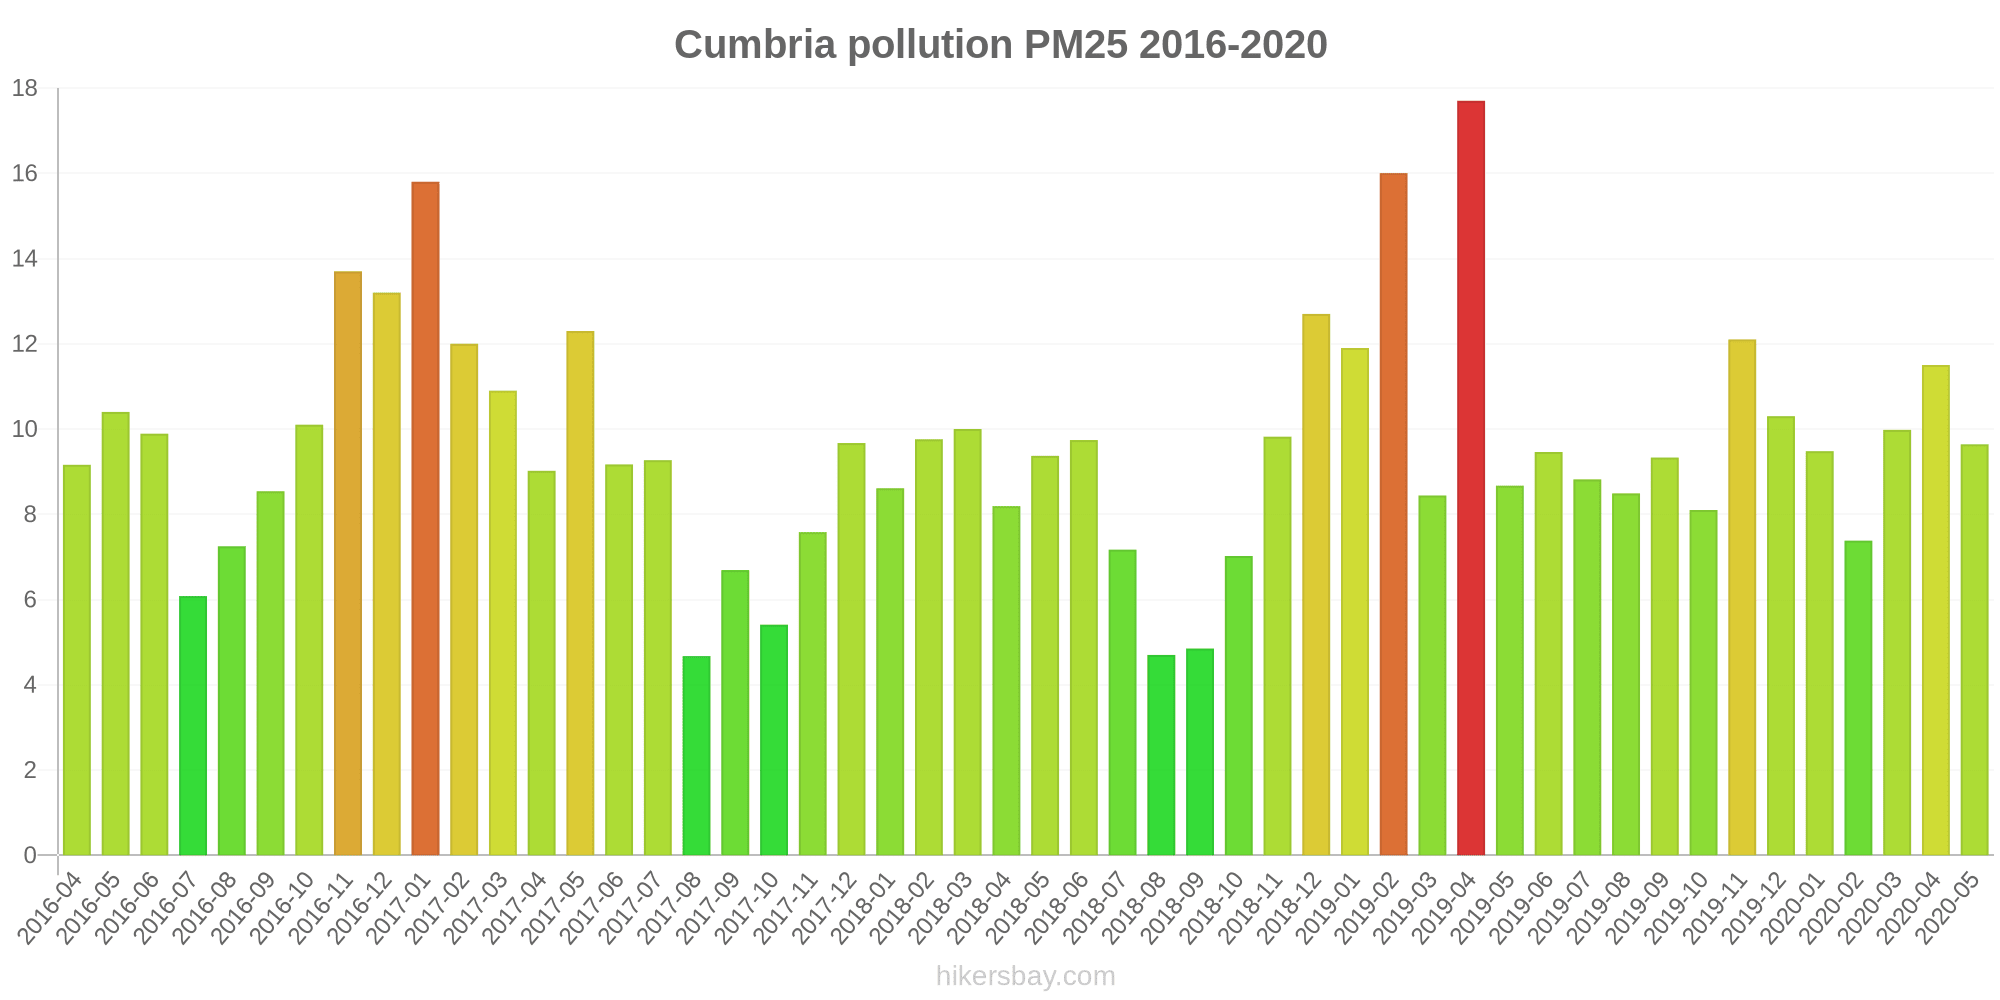
Air pollution in Cumbria from April 2016 to May 2020
index
2020-05
2020-04
2020-03
2020-02
2020-01
2019-12
2019-11
2019-10
2019-09
2019-08
2019-07
2019-06
2019-05
2019-04
2019-03
2019-02
2019-01
2018-12
2018-11
2018-10
2018-09
2018-08
2018-07
2018-06
2018-05
2018-04
2018-03
2018-02
2018-01
2017-12
2017-11
2017-10
2017-09
2017-08
2017-07
2017-06
2017-05
2017-04
2017-03
2017-02
2017-01
2016-12
2016-11
2016-10
2016-09
2016-08
2016-07
2016-06
2016-05
2016-04
no2
14 (Good)
14 (Good)
19 (Good)
18 (Good)
20 (Good)
27 (Good)
36 (Good)
27 (Good)
18 (Good)
14 (Good)
17 (Good)
17 (Good)
22 (Good)
25 (Good)
21 (Good)
27 (Good)
28 (Good)
27 (Good)
28 (Good)
26 (Good)
16 (Good)
16 (Good)
19 (Good)
20 (Good)
24 (Good)
24 (Good)
28 (Good)
26 (Good)
30 (Good)
35 (Good)
35 (Good)
22 (Good)
21 (Good)
16 (Good)
21 (Good)
20 (Good)
23 (Good)
21 (Good)
28 (Good)
26 (Good)
32 (Good)
31 (Good)
41 (Moderate)
31 (Good)
16 (Good)
17 (Good)
15 (Good)
26 (Good)
24 (Good)
33 (Good)
pm25
9.6 (Good)
12 (Good)
10 (Good)
7.4 (Good)
9.5 (Good)
10 (Good)
12 (Good)
8.1 (Good)
9.3 (Good)
8.5 (Good)
8.8 (Good)
9.5 (Good)
8.7 (Good)
18 (Moderate)
8.4 (Good)
16 (Moderate)
12 (Good)
13 (Good)
9.8 (Good)
7 (Good)
4.8 (Good)
4.7 (Good)
7.2 (Good)
9.7 (Good)
9.4 (Good)
8.2 (Good)
10 (Good)
9.8 (Good)
8.6 (Good)
9.7 (Good)
7.6 (Good)
5.4 (Good)
6.7 (Good)
4.7 (Good)
9.3 (Good)
9.2 (Good)
12 (Good)
9 (Good)
11 (Good)
12 (Good)
16 (Moderate)
13 (Moderate)
14 (Moderate)
10 (Good)
8.5 (Good)
7.3 (Good)
6.1 (Good)
9.9 (Good)
10 (Good)
9.2 (Good)
pm10
16 (Good)
20 (Moderate)
21 (Moderate)
17 (Good)
15 (Good)
17 (Good)
19 (Good)
17 (Good)
15 (Good)
14 (Good)
14 (Good)
14 (Good)
16 (Good)
29 (Moderate)
19 (Good)
29 (Moderate)
22 (Moderate)
20 (Moderate)
15 (Good)
13 (Good)
12 (Good)
10 (Good)
14 (Good)
18 (Good)
18 (Good)
18 (Good)
20 (Moderate)
19 (Good)
16 (Good)
16 (Good)
15 (Good)
12 (Good)
13 (Good)
12 (Good)
11 (Good)
12 (Good)
17 (Good)
15 (Good)
17 (Good)
16 (Good)
19 (Good)
18 (Good)
19 (Good)
15 (Good)
12 (Good)
9.5 (Good)
7.7 (Good)
14 (Good)
16 (Good)
15 (Good)
data source »
Quality of life in Cumbria
Green and Parks in the City
Cumbria
50%
Isle of Man: 78%
Ireland: 72%
Netherlands: 82%
Belgium: 64%
Faroe Islands: 87%
particulate matter PM2.5
Cumbria
11 (Good)
Pleasure of spending time in the city
Cumbria
88%
Isle of Man: 83%
Ireland: 78%
Netherlands: 88%
Belgium: 64%
Faroe Islands: 100%
particulate matter PM10
Cumbria
16 (Good)
Air Pollution
Cumbria
13%
Isle of Man: 13%
Ireland: 24%
Netherlands: 21%
Belgium: 45%
Faroe Islands: 0%
Garbage Disposal
Cumbria
50%
Isle of Man: 78%
Ireland: 61%
Netherlands: 79%
Belgium: 54%
Faroe Islands: 88%
Availability and quality of drinking water
Cumbria
88%
Isle of Man: 88%
Ireland: 72%
Netherlands: 92%
Belgium: 70%
Faroe Islands: 98%
Cleanliness and tidiness
Cumbria
56%
Isle of Man: 69%
Ireland: 52%
Netherlands: 77%
Belgium: 46%
Faroe Islands: 94%
Noise and Light pollution
Cumbria
31%
Isle of Man: 12%
Ireland: 37%
Netherlands: 31%
Belgium: 54%
Faroe Islands: 21%
Water Pollution
Cumbria
0%
Isle of Man: 13%
Ireland: 37%
Netherlands: 17%
Belgium: 42%
Faroe Islands: 7.7%
Source: Numbeo
Carlisle Roadside
Friday, May 27, 2022, 3:00 PM
O3 71 (Moderate)
ozone (O3)
NO2 2.1 (Good)
nitrogen dioxide (NO2)
SO2 0.18 (Good)
sulfur dioxide (SO2)
PM10 53 (Unhealthy for Sensitive Groups)
particulate matter (PM10) suspended dust
PM2,5 12 (Good)
particulate matter (PM2.5) dust
CO 69 (Good)
carbon monoxide (CO)
BC 0.25 (Good)
black carbon (BC)
Carlisle Roadside
index
2022-05-27
o3
14
no2
9.3
so2
1.3
pm10
39
pm25
-43.53
co
25
bc
0.25
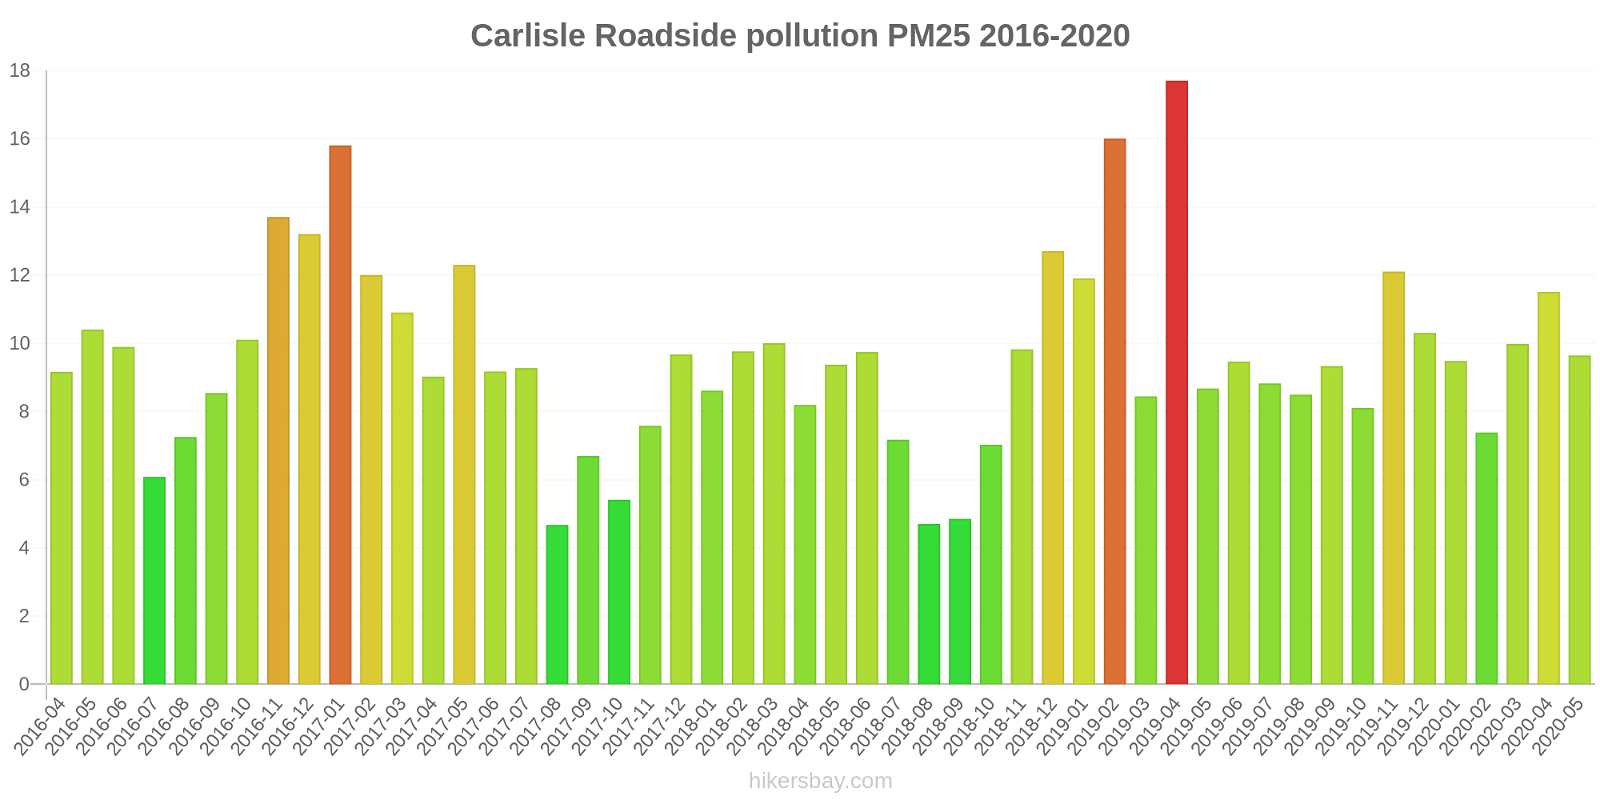
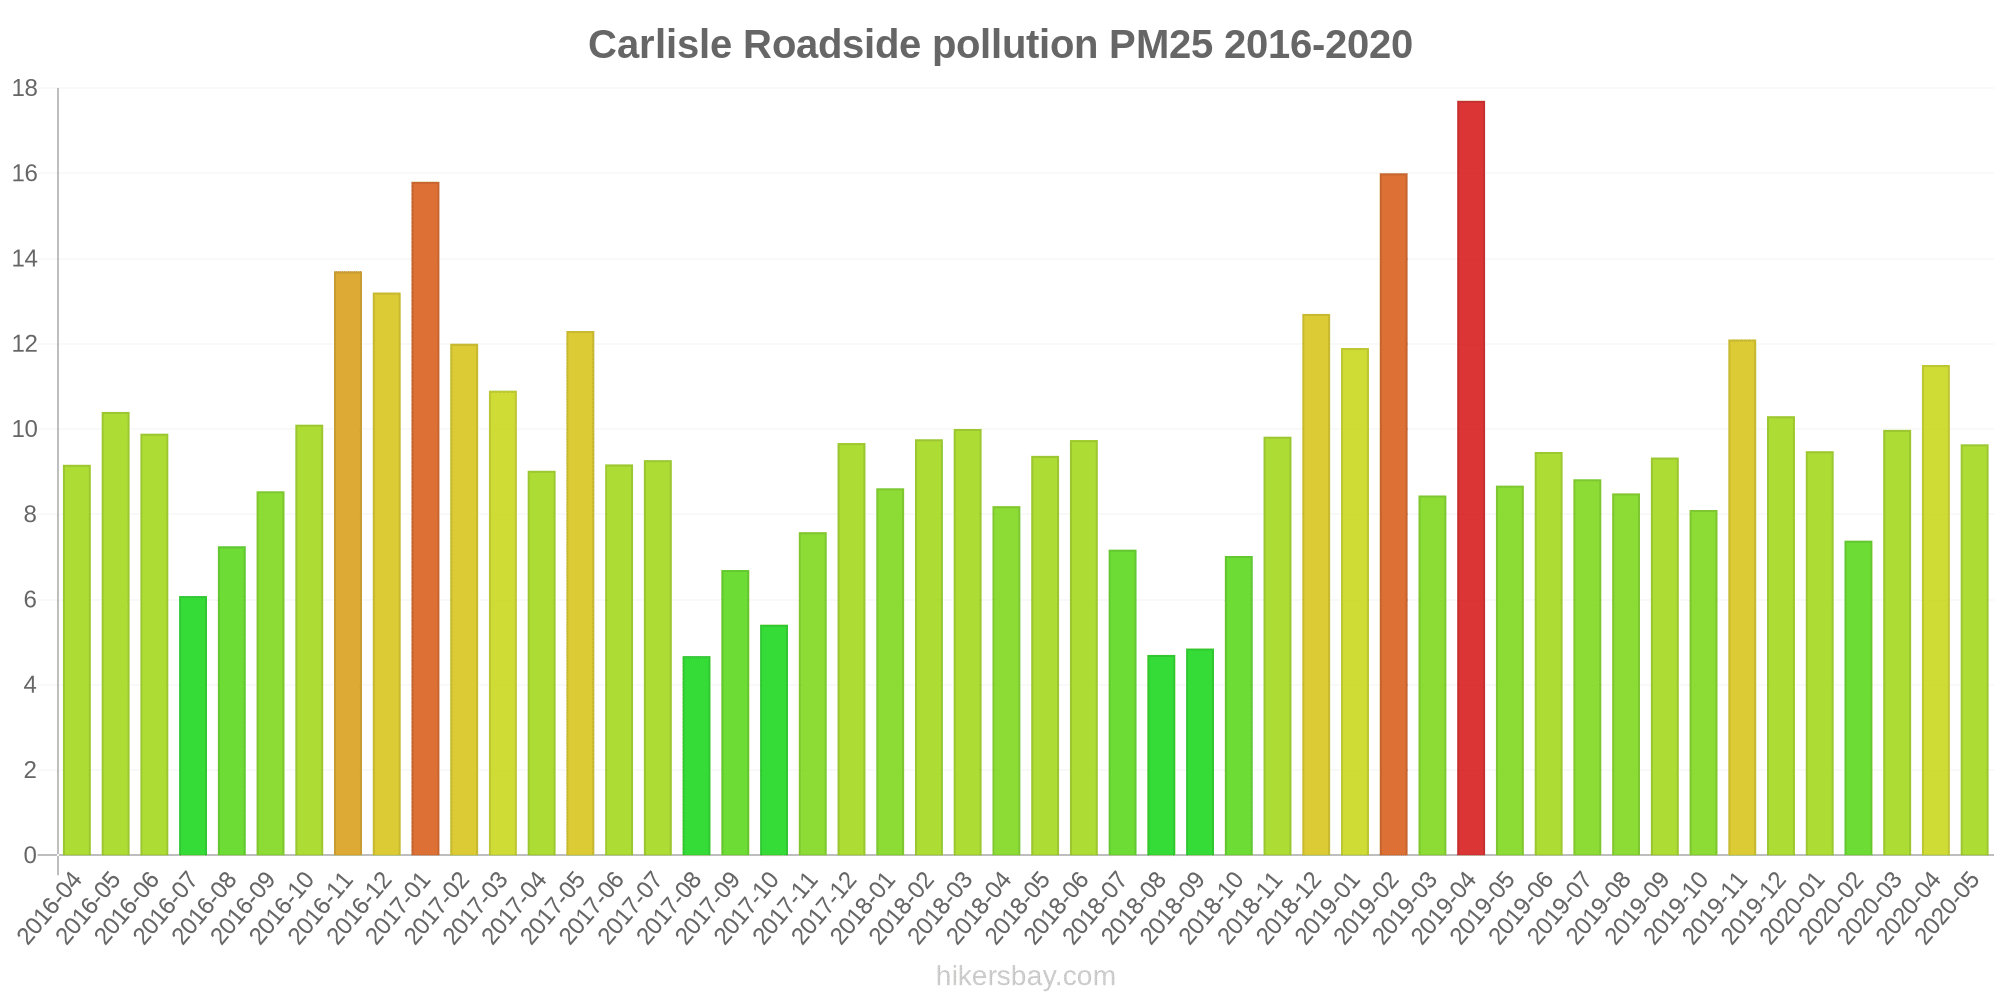
Carlisle Roadside
2016-04 2020-05
index
2020-05
2020-04
2020-03
2020-02
2020-01
2019-12
2019-11
2019-10
2019-09
2019-08
2019-07
2019-06
2019-05
2019-04
2019-03
2019-02
2019-01
2018-12
2018-11
2018-10
2018-09
2018-08
2018-07
2018-06
2018-05
2018-04
2018-03
2018-02
2018-01
2017-12
2017-11
2017-10
2017-09
2017-08
2017-07
2017-06
2017-05
2017-04
2017-03
2017-02
2017-01
2016-12
2016-11
2016-10
2016-09
2016-08
2016-07
2016-06
2016-05
2016-04
pm25
9.6
12
10
7.4
9.5
10
12
8.1
9.3
8.5
8.8
9.5
8.7
18
8.4
16
12
13
9.8
7
4.8
4.7
7.2
9.7
9.4
8.2
10
9.8
8.6
9.7
7.6
5.4
6.7
4.7
9.3
9.2
12
9
11
12
16
13
14
10
8.5
7.3
6.1
9.9
10
9.2
no2
14
14
19
18
20
27
36
27
18
14
17
17
22
25
21
27
28
27
28
26
16
16
19
20
24
24
28
26
30
35
35
22
21
16
21
20
23
21
28
26
32
31
41
31
16
17
15
26
24
33
pm10
16
20
21
17
15
17
19
17
15
14
14
14
16
29
19
29
22
20
15
13
12
10
14
18
18
18
20
19
16
16
15
12
13
12
11
12
17
15
17
16
19
18
19
15
12
9.5
7.7
14
16
15
* Pollution data source:
https://openaq.org
(DEFRA)
The data is licensed under CC-By 4.0
O3 71 (Moderate)
NO2 2 (Good)
SO2 0 (Good)
PM10 53 (Unhealthy for Sensitive Groups)
PM2,5 12 (Good)
CO 69 (Good)
BC 0 (Good)
Data on air pollution from recent days in Cumbria
| index | 2022-05-27 |
|---|---|
| o3 | 14 Good |
| no2 | 9 Good |
| so2 | 1 Good |
| pm10 | 39 Moderate |
| pm25 | -44 Good |
| co | 25 Good |
| bc | 0 Good |
| index | 2020-05 | 2020-04 | 2020-03 | 2020-02 | 2020-01 | 2019-12 | 2019-11 | 2019-10 | 2019-09 | 2019-08 | 2019-07 | 2019-06 | 2019-05 | 2019-04 | 2019-03 | 2019-02 | 2019-01 | 2018-12 | 2018-11 | 2018-10 | 2018-09 | 2018-08 | 2018-07 | 2018-06 | 2018-05 | 2018-04 | 2018-03 | 2018-02 | 2018-01 | 2017-12 | 2017-11 | 2017-10 | 2017-09 | 2017-08 | 2017-07 | 2017-06 | 2017-05 | 2017-04 | 2017-03 | 2017-02 | 2017-01 | 2016-12 | 2016-11 | 2016-10 | 2016-09 | 2016-08 | 2016-07 | 2016-06 | 2016-05 | 2016-04 |
|---|---|---|---|---|---|---|---|---|---|---|---|---|---|---|---|---|---|---|---|---|---|---|---|---|---|---|---|---|---|---|---|---|---|---|---|---|---|---|---|---|---|---|---|---|---|---|---|---|---|---|
| no2 | 14 (Good) | 14 (Good) | 19 (Good) | 18 (Good) | 20 (Good) | 27 (Good) | 36 (Good) | 27 (Good) | 18 (Good) | 14 (Good) | 17 (Good) | 17 (Good) | 22 (Good) | 25 (Good) | 21 (Good) | 27 (Good) | 28 (Good) | 27 (Good) | 28 (Good) | 26 (Good) | 16 (Good) | 16 (Good) | 19 (Good) | 20 (Good) | 24 (Good) | 24 (Good) | 28 (Good) | 26 (Good) | 30 (Good) | 35 (Good) | 35 (Good) | 22 (Good) | 21 (Good) | 16 (Good) | 21 (Good) | 20 (Good) | 23 (Good) | 21 (Good) | 28 (Good) | 26 (Good) | 32 (Good) | 31 (Good) | 41 (Moderate) | 31 (Good) | 16 (Good) | 17 (Good) | 15 (Good) | 26 (Good) | 24 (Good) | 33 (Good) |
| pm25 | 9.6 (Good) | 12 (Good) | 10 (Good) | 7.4 (Good) | 9.5 (Good) | 10 (Good) | 12 (Good) | 8.1 (Good) | 9.3 (Good) | 8.5 (Good) | 8.8 (Good) | 9.5 (Good) | 8.7 (Good) | 18 (Moderate) | 8.4 (Good) | 16 (Moderate) | 12 (Good) | 13 (Good) | 9.8 (Good) | 7 (Good) | 4.8 (Good) | 4.7 (Good) | 7.2 (Good) | 9.7 (Good) | 9.4 (Good) | 8.2 (Good) | 10 (Good) | 9.8 (Good) | 8.6 (Good) | 9.7 (Good) | 7.6 (Good) | 5.4 (Good) | 6.7 (Good) | 4.7 (Good) | 9.3 (Good) | 9.2 (Good) | 12 (Good) | 9 (Good) | 11 (Good) | 12 (Good) | 16 (Moderate) | 13 (Moderate) | 14 (Moderate) | 10 (Good) | 8.5 (Good) | 7.3 (Good) | 6.1 (Good) | 9.9 (Good) | 10 (Good) | 9.2 (Good) |
| pm10 | 16 (Good) | 20 (Moderate) | 21 (Moderate) | 17 (Good) | 15 (Good) | 17 (Good) | 19 (Good) | 17 (Good) | 15 (Good) | 14 (Good) | 14 (Good) | 14 (Good) | 16 (Good) | 29 (Moderate) | 19 (Good) | 29 (Moderate) | 22 (Moderate) | 20 (Moderate) | 15 (Good) | 13 (Good) | 12 (Good) | 10 (Good) | 14 (Good) | 18 (Good) | 18 (Good) | 18 (Good) | 20 (Moderate) | 19 (Good) | 16 (Good) | 16 (Good) | 15 (Good) | 12 (Good) | 13 (Good) | 12 (Good) | 11 (Good) | 12 (Good) | 17 (Good) | 15 (Good) | 17 (Good) | 16 (Good) | 19 (Good) | 18 (Good) | 19 (Good) | 15 (Good) | 12 (Good) | 9.5 (Good) | 7.7 (Good) | 14 (Good) | 16 (Good) | 15 (Good) |
Green and Parks in the City
Cumbria 50%
Isle of Man: 78% Ireland: 72% Netherlands: 82% Belgium: 64% Faroe Islands: 87%particulate matter PM2.5
Cumbria 11 (Good)
Pleasure of spending time in the city
Cumbria 88%
Isle of Man: 83% Ireland: 78% Netherlands: 88% Belgium: 64% Faroe Islands: 100%particulate matter PM10
Cumbria 16 (Good)
Air Pollution
Cumbria 13%
Isle of Man: 13% Ireland: 24% Netherlands: 21% Belgium: 45% Faroe Islands: 0%Garbage Disposal
Cumbria 50%
Isle of Man: 78% Ireland: 61% Netherlands: 79% Belgium: 54% Faroe Islands: 88%Availability and quality of drinking water
Cumbria 88%
Isle of Man: 88% Ireland: 72% Netherlands: 92% Belgium: 70% Faroe Islands: 98%Cleanliness and tidiness
Cumbria 56%
Isle of Man: 69% Ireland: 52% Netherlands: 77% Belgium: 46% Faroe Islands: 94%Noise and Light pollution
Cumbria 31%
Isle of Man: 12% Ireland: 37% Netherlands: 31% Belgium: 54% Faroe Islands: 21%Water Pollution
Cumbria 0%
Isle of Man: 13% Ireland: 37% Netherlands: 17% Belgium: 42% Faroe Islands: 7.7%O3 71 (Moderate)
ozone (O3)NO2 2.1 (Good)
nitrogen dioxide (NO2)SO2 0.18 (Good)
sulfur dioxide (SO2)PM10 53 (Unhealthy for Sensitive Groups)
particulate matter (PM10) suspended dustPM2,5 12 (Good)
particulate matter (PM2.5) dustCO 69 (Good)
carbon monoxide (CO)BC 0.25 (Good)
black carbon (BC)Carlisle Roadside
| index | 2022-05-27 |
|---|---|
| o3 | 14 |
| no2 | 9.3 |
| so2 | 1.3 |
| pm10 | 39 |
| pm25 | -43.53 |
| co | 25 |
| bc | 0.25 |
Carlisle Roadside
| index | 2020-05 | 2020-04 | 2020-03 | 2020-02 | 2020-01 | 2019-12 | 2019-11 | 2019-10 | 2019-09 | 2019-08 | 2019-07 | 2019-06 | 2019-05 | 2019-04 | 2019-03 | 2019-02 | 2019-01 | 2018-12 | 2018-11 | 2018-10 | 2018-09 | 2018-08 | 2018-07 | 2018-06 | 2018-05 | 2018-04 | 2018-03 | 2018-02 | 2018-01 | 2017-12 | 2017-11 | 2017-10 | 2017-09 | 2017-08 | 2017-07 | 2017-06 | 2017-05 | 2017-04 | 2017-03 | 2017-02 | 2017-01 | 2016-12 | 2016-11 | 2016-10 | 2016-09 | 2016-08 | 2016-07 | 2016-06 | 2016-05 | 2016-04 |
|---|---|---|---|---|---|---|---|---|---|---|---|---|---|---|---|---|---|---|---|---|---|---|---|---|---|---|---|---|---|---|---|---|---|---|---|---|---|---|---|---|---|---|---|---|---|---|---|---|---|---|
| pm25 | 9.6 | 12 | 10 | 7.4 | 9.5 | 10 | 12 | 8.1 | 9.3 | 8.5 | 8.8 | 9.5 | 8.7 | 18 | 8.4 | 16 | 12 | 13 | 9.8 | 7 | 4.8 | 4.7 | 7.2 | 9.7 | 9.4 | 8.2 | 10 | 9.8 | 8.6 | 9.7 | 7.6 | 5.4 | 6.7 | 4.7 | 9.3 | 9.2 | 12 | 9 | 11 | 12 | 16 | 13 | 14 | 10 | 8.5 | 7.3 | 6.1 | 9.9 | 10 | 9.2 |
| no2 | 14 | 14 | 19 | 18 | 20 | 27 | 36 | 27 | 18 | 14 | 17 | 17 | 22 | 25 | 21 | 27 | 28 | 27 | 28 | 26 | 16 | 16 | 19 | 20 | 24 | 24 | 28 | 26 | 30 | 35 | 35 | 22 | 21 | 16 | 21 | 20 | 23 | 21 | 28 | 26 | 32 | 31 | 41 | 31 | 16 | 17 | 15 | 26 | 24 | 33 |
| pm10 | 16 | 20 | 21 | 17 | 15 | 17 | 19 | 17 | 15 | 14 | 14 | 14 | 16 | 29 | 19 | 29 | 22 | 20 | 15 | 13 | 12 | 10 | 14 | 18 | 18 | 18 | 20 | 19 | 16 | 16 | 15 | 12 | 13 | 12 | 11 | 12 | 17 | 15 | 17 | 16 | 19 | 18 | 19 | 15 | 12 | 9.5 | 7.7 | 14 | 16 | 15 |