Air Pollution in Glasgow: Real-time Air Quality Index and smog alert.
Pollution and air quality forecast for Glasgow. Today is Thursday, June 25, 2026. The following air pollution values have been recorded for Glasgow:- nitrogen dioxide (NO2) - 6 (Good)
- ozone (O3) - 83 (Moderate)
- particulate matter (PM10) suspended dust - 4 (Good)
- particulate matter (PM2.5) dust - 2 (Good)

What is the air quality in Glasgow today? Is the air polluted in Glasgow?. Is there smog?
How high is the level of NO2? (nitrogen dioxide (NO2))
6 (Good)
How is the O3 level today in Glasgow? (ozone (O3))
83 (Moderate)
What is the level of PM10 today in Glasgow? (particulate matter (PM10) suspended dust)
The current level of particulate matter PM10 in Glasgow is:
4 (Good)
The highest PM10 values usually occur in month: 21 (February 2016).
The lowest value of particulate matter PM10 pollution in Glasgow is usually recorded in: August (6.9).
What is the current level of PM2.5 in Glasgow? (particulate matter (PM2.5) dust)
Today's PM2.5 level is:
2 (Good)
For comparison, the highest level of PM2.5 in Glasgow in the last 7 days was: 5 (Sunday, April 14, 2024) and the lowest: 2 (Tuesday, April 16, 2024).
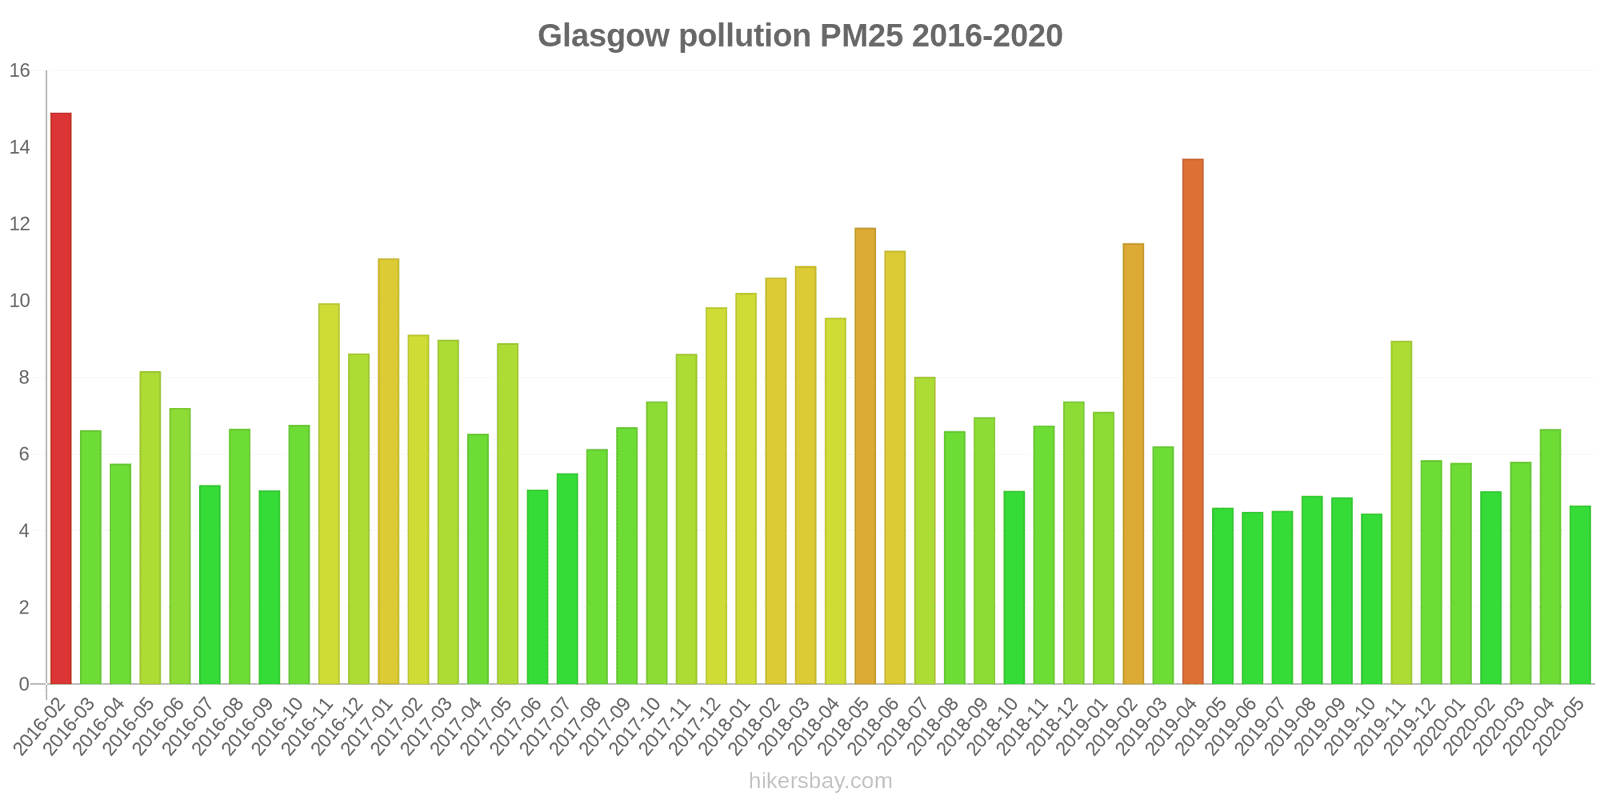
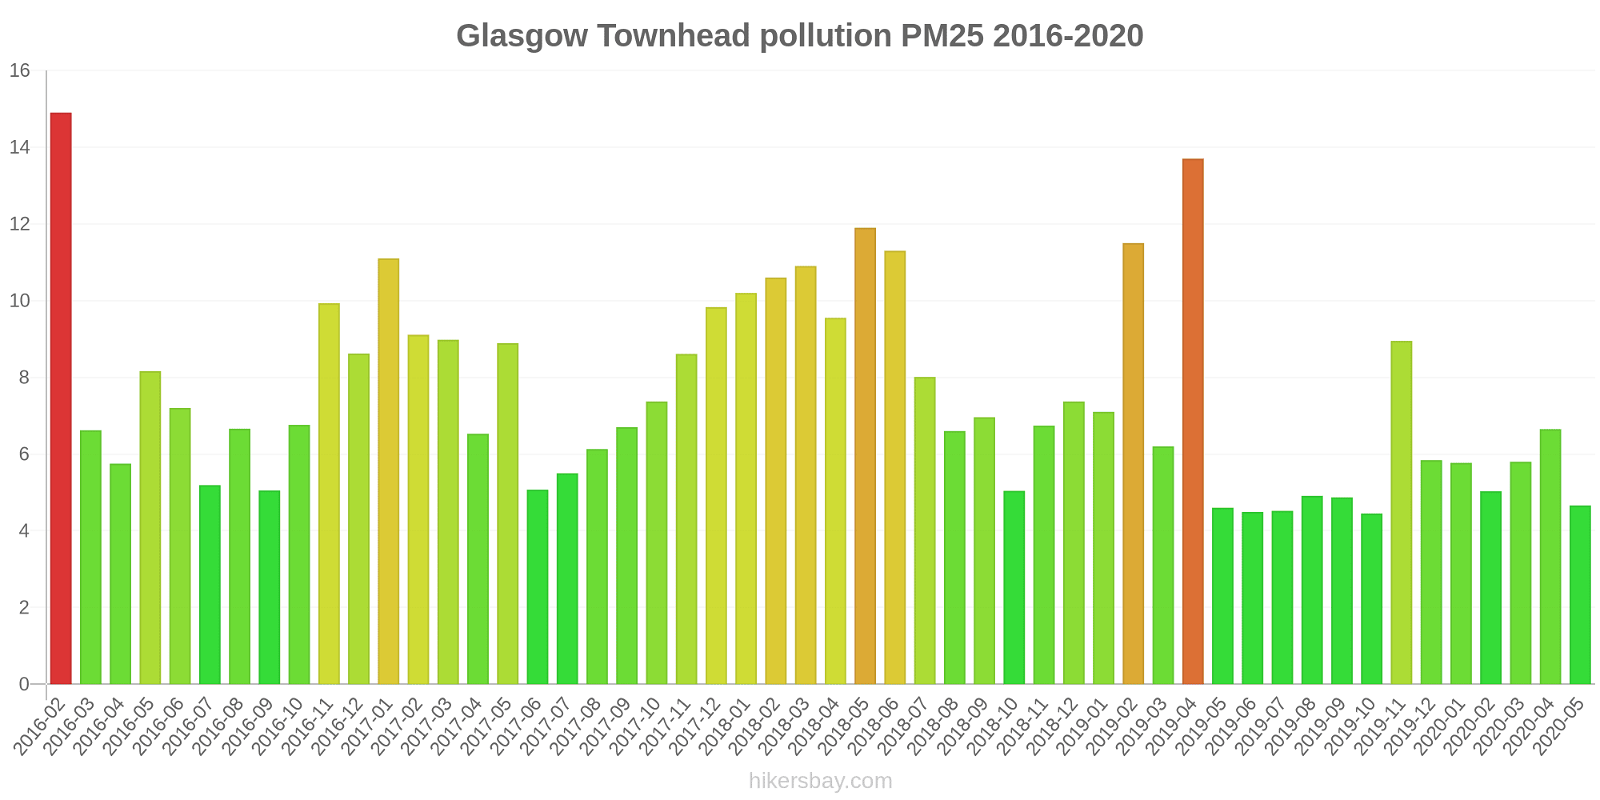
The highest PM2.5 values were recorded: 15 (February 2016).
The lowest level of particulate matter PM2.5 pollution occurs in month: October (4.5).
Current data Tuesday, April 16, 2024, 1:00 AM
NO2 6 (Good)
O3 83 (Moderate)
PM10 4 (Good)
PM2,5 2 (Good)
Data on air pollution from recent days in Glasgow
index
2024-04-10
2024-04-11
2024-04-12
2024-04-13
2024-04-14
2024-04-15
2024-04-16
no2
10
Good
8
Good
8
Good
7
Good
6
Good
12
Good
8
Good
pm10
6
Good
7
Good
7
Good
7
Good
9
Good
6
Good
4
Good
o3
59
Good
70
Moderate
61
Good
74
Moderate
82
Moderate
85
Moderate
84
Moderate
pm25
3
Good
4
Good
4
Good
4
Good
5
Good
3
Good
2
Good
data source »
Air pollution in Glasgow from February 2016 to May 2020
index
2020-05
2020-04
2020-03
2020-02
2020-01
2019-12
2019-11
2019-10
2019-09
2019-08
2019-07
2019-06
2019-05
2019-04
2019-03
2019-02
2019-01
2018-12
2018-11
2018-10
2018-09
2018-08
2018-07
2018-06
2018-05
2018-04
2018-03
2018-02
2018-01
2017-12
2017-11
2017-10
2017-09
2017-08
2017-07
2017-06
2017-05
2017-04
2017-03
2017-02
2017-01
2016-12
2016-11
2016-10
2016-09
2016-08
2016-07
2016-06
2016-05
2016-04
2016-03
2016-02
no2
10 (Good)
10 (Good)
21 (Good)
23 (Good)
23 (Good)
34 (Good)
36 (Good)
25 (Good)
20 (Good)
16 (Good)
16 (Good)
14 (Good)
19 (Good)
20 (Good)
21 (Good)
34 (Good)
40 (Good)
40 (Good)
29 (Good)
28 (Good)
19 (Good)
15 (Good)
14 (Good)
16 (Good)
18 (Good)
22 (Good)
26 (Good)
35 (Good)
36 (Good)
45 (Moderate)
40 (Good)
24 (Good)
25 (Good)
16 (Good)
15 (Good)
15 (Good)
17 (Good)
20 (Good)
32 (Good)
29 (Good)
38 (Good)
35 (Good)
51 (Moderate)
29 (Good)
23 (Good)
21 (Good)
17 (Good)
16 (Good)
18 (Good)
23 (Good)
31 (Good)
62 (Moderate)
o3
60 (Good)
67 (Good)
54 (Good)
54 (Good)
49 (Good)
38 (Good)
20 (Good)
34 (Good)
34 (Good)
43 (Good)
40 (Good)
51 (Good)
54 (Good)
70 (Good)
58 (Good)
40 (Good)
32 (Good)
25 (Good)
34 (Good)
37 (Good)
41 (Good)
33 (Good)
43 (Good)
53 (Good)
63 (Good)
61 (Good)
51 (Good)
39 (Good)
34 (Good)
28 (Good)
31 (Good)
38 (Good)
32 (Good)
33 (Good)
35 (Good)
44 (Good)
60 (Good)
64 (Good)
46 (Good)
45 (Good)
31 (Good)
34 (Good)
21 (Good)
27 (Good)
34 (Good)
35 (Good)
35 (Good)
49 (Good)
65 (Good)
54 (Good)
43 (Good)
24 (Good)
pm25
4.7 (Good)
6.7 (Good)
5.8 (Good)
5 (Good)
5.8 (Good)
5.8 (Good)
8.9 (Good)
4.5 (Good)
4.9 (Good)
4.9 (Good)
4.5 (Good)
4.5 (Good)
4.6 (Good)
14 (Moderate)
6.2 (Good)
12 (Good)
7.1 (Good)
7.4 (Good)
6.7 (Good)
5 (Good)
7 (Good)
6.6 (Good)
8 (Good)
11 (Good)
12 (Good)
9.6 (Good)
11 (Good)
11 (Good)
10 (Good)
9.8 (Good)
8.6 (Good)
7.4 (Good)
6.7 (Good)
6.1 (Good)
5.5 (Good)
5.1 (Good)
8.9 (Good)
6.5 (Good)
9 (Good)
9.1 (Good)
11 (Good)
8.6 (Good)
9.9 (Good)
6.8 (Good)
5 (Good)
6.7 (Good)
5.2 (Good)
7.2 (Good)
8.2 (Good)
5.8 (Good)
6.6 (Good)
15 (Moderate)
pm10
7.4 (Good)
11 (Good)
11 (Good)
9.3 (Good)
10 (Good)
9.6 (Good)
13 (Good)
8.5 (Good)
9.5 (Good)
8.8 (Good)
8.3 (Good)
8.2 (Good)
8.2 (Good)
21 (Moderate)
11 (Good)
19 (Good)
12 (Good)
11 (Good)
10 (Good)
9.1 (Good)
8.8 (Good)
6.9 (Good)
9.7 (Good)
14 (Good)
13 (Good)
11 (Good)
12 (Good)
14 (Good)
15 (Good)
14 (Good)
13 (Good)
12 (Good)
10 (Good)
10 (Good)
12 (Good)
11 (Good)
18 (Good)
14 (Good)
17 (Good)
15 (Good)
16 (Good)
16 (Good)
15 (Good)
13 (Good)
10 (Good)
11 (Good)
9.2 (Good)
13 (Good)
14 (Good)
11 (Good)
10 (Good)
21 (Moderate)
data source »
Quality of life in Glasgow
Green and Parks in the City
Glasgow
82%
Isle of Man: 78%
Ireland: 72%
Netherlands: 82%
Belgium: 64%
Faroe Islands: 87%
particulate matter PM2.5
Glasgow
8 (Good)
Pleasure of spending time in the city
Glasgow
78%
Isle of Man: 83%
Ireland: 78%
Netherlands: 88%
Belgium: 64%
Faroe Islands: 100%
particulate matter PM10
Glasgow
12 (Good)
Air Pollution
Glasgow
33%
Isle of Man: 13%
Ireland: 24%
Netherlands: 21%
Belgium: 45%
Faroe Islands: 0%
Garbage Disposal
Glasgow
56%
Isle of Man: 78%
Ireland: 61%
Netherlands: 79%
Belgium: 54%
Faroe Islands: 88%
Availability and quality of drinking water
Glasgow
86%
Isle of Man: 88%
Ireland: 72%
Netherlands: 92%
Belgium: 70%
Faroe Islands: 98%
Cleanliness and tidiness
Glasgow
46%
Isle of Man: 69%
Ireland: 52%
Netherlands: 77%
Belgium: 46%
Faroe Islands: 94%
Noise and Light pollution
Glasgow
42%
Isle of Man: 12%
Ireland: 37%
Netherlands: 31%
Belgium: 54%
Faroe Islands: 21%
Water Pollution
Glasgow
17%
Isle of Man: 13%
Ireland: 37%
Netherlands: 17%
Belgium: 42%
Faroe Islands: 7.7%
Source: Numbeo
Glasgow Great Western Road
Tuesday, April 16, 2024, 1:00 AM
NO2 5 (Good)
nitrogen dioxide (NO2)
Glasgow Townhead
Tuesday, April 16, 2024, 1:00 AM
O3 83 (Moderate)
ozone (O3)
NO2 7 (Good)
nitrogen dioxide (NO2)
PM10 4 (Good)
particulate matter (PM10) suspended dust
PM2,5 2 (Good)
particulate matter (PM2.5) dust
Glasgow Great Western Road
index
2024-04-16
2024-04-15
2024-04-14
2024-04-13
2024-04-12
2024-04-11
2024-04-10
no2
6.5
13
5.3
6.5
7.9
8.5
12
Glasgow Townhead
index
2024-04-16
2024-04-15
2024-04-14
2024-04-13
2024-04-12
2024-04-11
2024-04-10
pm10
4
5.9
9.3
6.9
7.1
7.4
6
no2
8.5
10
7
7.7
8.6
8.4
7.4
o3
84
85
82
74
61
70
59
pm25
2
2.9
4.7
4
4.3
4.3
3
Glasgow Great Western Road
index
2020-05
2020-04
2020-03
2020-02
2020-01
2019-12
2019-11
2019-10
2019-09
2019-08
2019-07
2019-06
2019-05
2019-04
2019-03
2019-02
2019-01
2018-12
2018-11
2018-10
2018-09
2018-08
2018-07
2018-06
2018-05
2018-04
2018-03
2018-02
2018-01
2017-12
2017-11
2017-10
2017-09
2017-08
2017-07
2017-06
2017-05
2017-04
2017-03
2017-02
2017-01
2016-12
2016-11
2016-10
2016-09
2016-08
2016-07
2016-06
2016-05
2016-04
2016-03
2016-02
no2
11
10
22
23
22
35
35
28
22
16
19
17
23
22
23
37
43
41
32
31
21
15
15
18
18
23
26
36
37
47
42
24
27
17
15
16
17
22
35
32
40
38
55
29
26
22
19
15
17
23
32
64
Glasgow Townhead
2016-02 2020-05
index
2020-05
2020-04
2020-03
2020-02
2020-01
2019-12
2019-11
2019-10
2019-09
2019-08
2019-07
2019-06
2019-05
2019-04
2019-03
2019-02
2019-01
2018-12
2018-11
2018-10
2018-09
2018-08
2018-07
2018-06
2018-05
2018-04
2018-03
2018-02
2018-01
2017-12
2017-11
2017-10
2017-09
2017-08
2017-07
2017-06
2017-05
2017-04
2017-03
2017-02
2017-01
2016-12
2016-11
2016-10
2016-09
2016-08
2016-07
2016-06
2016-05
2016-04
2016-03
2016-02
pm25
4.7
6.7
5.8
5
5.8
5.8
8.9
4.5
4.9
4.9
4.5
4.5
4.6
14
6.2
12
7.1
7.4
6.7
5
7
6.6
8
11
12
9.6
11
11
10
9.8
8.6
7.4
6.7
6.1
5.5
5.1
8.9
6.5
9
9.1
11
8.6
9.9
6.8
5
6.7
5.2
7.2
8.2
5.8
6.6
15
pm10
7.4
11
11
9.3
10
9.6
13
8.5
9.5
8.8
8.3
8.2
8.2
21
11
19
12
11
10
9.1
8.8
6.9
9.7
14
13
11
12
14
15
14
13
12
10
10
12
11
18
14
17
15
16
16
15
13
10
11
9.2
13
14
11
10
21
o3
60
67
54
54
49
38
20
34
34
43
40
51
54
70
58
40
32
25
34
37
41
33
43
53
63
61
51
39
34
28
31
38
32
33
35
44
60
64
46
45
31
34
21
27
34
35
35
49
65
54
43
24
no2
9.3
9.6
20
22
23
32
37
23
19
16
13
10
15
19
19
31
37
38
26
26
17
14
13
14
17
21
26
34
35
44
38
23
23
15
14
14
16
18
29
27
36
33
47
29
19
19
16
17
18
23
29
61
* Pollution data source:
https://openaq.org
(DEFRA)
The data is licensed under CC-By 4.0
NO2 6 (Good)
O3 83 (Moderate)
PM10 4 (Good)
PM2,5 2 (Good)
Data on air pollution from recent days in Glasgow
| index | 2024-04-10 | 2024-04-11 | 2024-04-12 | 2024-04-13 | 2024-04-14 | 2024-04-15 | 2024-04-16 |
|---|---|---|---|---|---|---|---|
| no2 | 10 Good |
8 Good |
8 Good |
7 Good |
6 Good |
12 Good |
8 Good |
| pm10 | 6 Good |
7 Good |
7 Good |
7 Good |
9 Good |
6 Good |
4 Good |
| o3 | 59 Good |
70 Moderate |
61 Good |
74 Moderate |
82 Moderate |
85 Moderate |
84 Moderate |
| pm25 | 3 Good |
4 Good |
4 Good |
4 Good |
5 Good |
3 Good |
2 Good |

| index | 2020-05 | 2020-04 | 2020-03 | 2020-02 | 2020-01 | 2019-12 | 2019-11 | 2019-10 | 2019-09 | 2019-08 | 2019-07 | 2019-06 | 2019-05 | 2019-04 | 2019-03 | 2019-02 | 2019-01 | 2018-12 | 2018-11 | 2018-10 | 2018-09 | 2018-08 | 2018-07 | 2018-06 | 2018-05 | 2018-04 | 2018-03 | 2018-02 | 2018-01 | 2017-12 | 2017-11 | 2017-10 | 2017-09 | 2017-08 | 2017-07 | 2017-06 | 2017-05 | 2017-04 | 2017-03 | 2017-02 | 2017-01 | 2016-12 | 2016-11 | 2016-10 | 2016-09 | 2016-08 | 2016-07 | 2016-06 | 2016-05 | 2016-04 | 2016-03 | 2016-02 |
|---|---|---|---|---|---|---|---|---|---|---|---|---|---|---|---|---|---|---|---|---|---|---|---|---|---|---|---|---|---|---|---|---|---|---|---|---|---|---|---|---|---|---|---|---|---|---|---|---|---|---|---|---|
| no2 | 10 (Good) | 10 (Good) | 21 (Good) | 23 (Good) | 23 (Good) | 34 (Good) | 36 (Good) | 25 (Good) | 20 (Good) | 16 (Good) | 16 (Good) | 14 (Good) | 19 (Good) | 20 (Good) | 21 (Good) | 34 (Good) | 40 (Good) | 40 (Good) | 29 (Good) | 28 (Good) | 19 (Good) | 15 (Good) | 14 (Good) | 16 (Good) | 18 (Good) | 22 (Good) | 26 (Good) | 35 (Good) | 36 (Good) | 45 (Moderate) | 40 (Good) | 24 (Good) | 25 (Good) | 16 (Good) | 15 (Good) | 15 (Good) | 17 (Good) | 20 (Good) | 32 (Good) | 29 (Good) | 38 (Good) | 35 (Good) | 51 (Moderate) | 29 (Good) | 23 (Good) | 21 (Good) | 17 (Good) | 16 (Good) | 18 (Good) | 23 (Good) | 31 (Good) | 62 (Moderate) |
| o3 | 60 (Good) | 67 (Good) | 54 (Good) | 54 (Good) | 49 (Good) | 38 (Good) | 20 (Good) | 34 (Good) | 34 (Good) | 43 (Good) | 40 (Good) | 51 (Good) | 54 (Good) | 70 (Good) | 58 (Good) | 40 (Good) | 32 (Good) | 25 (Good) | 34 (Good) | 37 (Good) | 41 (Good) | 33 (Good) | 43 (Good) | 53 (Good) | 63 (Good) | 61 (Good) | 51 (Good) | 39 (Good) | 34 (Good) | 28 (Good) | 31 (Good) | 38 (Good) | 32 (Good) | 33 (Good) | 35 (Good) | 44 (Good) | 60 (Good) | 64 (Good) | 46 (Good) | 45 (Good) | 31 (Good) | 34 (Good) | 21 (Good) | 27 (Good) | 34 (Good) | 35 (Good) | 35 (Good) | 49 (Good) | 65 (Good) | 54 (Good) | 43 (Good) | 24 (Good) |
| pm25 | 4.7 (Good) | 6.7 (Good) | 5.8 (Good) | 5 (Good) | 5.8 (Good) | 5.8 (Good) | 8.9 (Good) | 4.5 (Good) | 4.9 (Good) | 4.9 (Good) | 4.5 (Good) | 4.5 (Good) | 4.6 (Good) | 14 (Moderate) | 6.2 (Good) | 12 (Good) | 7.1 (Good) | 7.4 (Good) | 6.7 (Good) | 5 (Good) | 7 (Good) | 6.6 (Good) | 8 (Good) | 11 (Good) | 12 (Good) | 9.6 (Good) | 11 (Good) | 11 (Good) | 10 (Good) | 9.8 (Good) | 8.6 (Good) | 7.4 (Good) | 6.7 (Good) | 6.1 (Good) | 5.5 (Good) | 5.1 (Good) | 8.9 (Good) | 6.5 (Good) | 9 (Good) | 9.1 (Good) | 11 (Good) | 8.6 (Good) | 9.9 (Good) | 6.8 (Good) | 5 (Good) | 6.7 (Good) | 5.2 (Good) | 7.2 (Good) | 8.2 (Good) | 5.8 (Good) | 6.6 (Good) | 15 (Moderate) |
| pm10 | 7.4 (Good) | 11 (Good) | 11 (Good) | 9.3 (Good) | 10 (Good) | 9.6 (Good) | 13 (Good) | 8.5 (Good) | 9.5 (Good) | 8.8 (Good) | 8.3 (Good) | 8.2 (Good) | 8.2 (Good) | 21 (Moderate) | 11 (Good) | 19 (Good) | 12 (Good) | 11 (Good) | 10 (Good) | 9.1 (Good) | 8.8 (Good) | 6.9 (Good) | 9.7 (Good) | 14 (Good) | 13 (Good) | 11 (Good) | 12 (Good) | 14 (Good) | 15 (Good) | 14 (Good) | 13 (Good) | 12 (Good) | 10 (Good) | 10 (Good) | 12 (Good) | 11 (Good) | 18 (Good) | 14 (Good) | 17 (Good) | 15 (Good) | 16 (Good) | 16 (Good) | 15 (Good) | 13 (Good) | 10 (Good) | 11 (Good) | 9.2 (Good) | 13 (Good) | 14 (Good) | 11 (Good) | 10 (Good) | 21 (Moderate) |
Green and Parks in the City
Glasgow 82%
Isle of Man: 78% Ireland: 72% Netherlands: 82% Belgium: 64% Faroe Islands: 87%particulate matter PM2.5
Glasgow 8 (Good)
Pleasure of spending time in the city
Glasgow 78%
Isle of Man: 83% Ireland: 78% Netherlands: 88% Belgium: 64% Faroe Islands: 100%particulate matter PM10
Glasgow 12 (Good)
Air Pollution
Glasgow 33%
Isle of Man: 13% Ireland: 24% Netherlands: 21% Belgium: 45% Faroe Islands: 0%Garbage Disposal
Glasgow 56%
Isle of Man: 78% Ireland: 61% Netherlands: 79% Belgium: 54% Faroe Islands: 88%Availability and quality of drinking water
Glasgow 86%
Isle of Man: 88% Ireland: 72% Netherlands: 92% Belgium: 70% Faroe Islands: 98%Cleanliness and tidiness
Glasgow 46%
Isle of Man: 69% Ireland: 52% Netherlands: 77% Belgium: 46% Faroe Islands: 94%Noise and Light pollution
Glasgow 42%
Isle of Man: 12% Ireland: 37% Netherlands: 31% Belgium: 54% Faroe Islands: 21%Water Pollution
Glasgow 17%
Isle of Man: 13% Ireland: 37% Netherlands: 17% Belgium: 42% Faroe Islands: 7.7%NO2 5 (Good)
nitrogen dioxide (NO2)O3 83 (Moderate)
ozone (O3)NO2 7 (Good)
nitrogen dioxide (NO2)PM10 4 (Good)
particulate matter (PM10) suspended dustPM2,5 2 (Good)
particulate matter (PM2.5) dustGlasgow Great Western Road
| index | 2024-04-16 | 2024-04-15 | 2024-04-14 | 2024-04-13 | 2024-04-12 | 2024-04-11 | 2024-04-10 |
|---|---|---|---|---|---|---|---|
| no2 | 6.5 | 13 | 5.3 | 6.5 | 7.9 | 8.5 | 12 |
Glasgow Townhead
| index | 2024-04-16 | 2024-04-15 | 2024-04-14 | 2024-04-13 | 2024-04-12 | 2024-04-11 | 2024-04-10 |
|---|---|---|---|---|---|---|---|
| pm10 | 4 | 5.9 | 9.3 | 6.9 | 7.1 | 7.4 | 6 |
| no2 | 8.5 | 10 | 7 | 7.7 | 8.6 | 8.4 | 7.4 |
| o3 | 84 | 85 | 82 | 74 | 61 | 70 | 59 |
| pm25 | 2 | 2.9 | 4.7 | 4 | 4.3 | 4.3 | 3 |
Glasgow Great Western Road
| index | 2020-05 | 2020-04 | 2020-03 | 2020-02 | 2020-01 | 2019-12 | 2019-11 | 2019-10 | 2019-09 | 2019-08 | 2019-07 | 2019-06 | 2019-05 | 2019-04 | 2019-03 | 2019-02 | 2019-01 | 2018-12 | 2018-11 | 2018-10 | 2018-09 | 2018-08 | 2018-07 | 2018-06 | 2018-05 | 2018-04 | 2018-03 | 2018-02 | 2018-01 | 2017-12 | 2017-11 | 2017-10 | 2017-09 | 2017-08 | 2017-07 | 2017-06 | 2017-05 | 2017-04 | 2017-03 | 2017-02 | 2017-01 | 2016-12 | 2016-11 | 2016-10 | 2016-09 | 2016-08 | 2016-07 | 2016-06 | 2016-05 | 2016-04 | 2016-03 | 2016-02 |
|---|---|---|---|---|---|---|---|---|---|---|---|---|---|---|---|---|---|---|---|---|---|---|---|---|---|---|---|---|---|---|---|---|---|---|---|---|---|---|---|---|---|---|---|---|---|---|---|---|---|---|---|---|
| no2 | 11 | 10 | 22 | 23 | 22 | 35 | 35 | 28 | 22 | 16 | 19 | 17 | 23 | 22 | 23 | 37 | 43 | 41 | 32 | 31 | 21 | 15 | 15 | 18 | 18 | 23 | 26 | 36 | 37 | 47 | 42 | 24 | 27 | 17 | 15 | 16 | 17 | 22 | 35 | 32 | 40 | 38 | 55 | 29 | 26 | 22 | 19 | 15 | 17 | 23 | 32 | 64 |
Glasgow Townhead

| index | 2020-05 | 2020-04 | 2020-03 | 2020-02 | 2020-01 | 2019-12 | 2019-11 | 2019-10 | 2019-09 | 2019-08 | 2019-07 | 2019-06 | 2019-05 | 2019-04 | 2019-03 | 2019-02 | 2019-01 | 2018-12 | 2018-11 | 2018-10 | 2018-09 | 2018-08 | 2018-07 | 2018-06 | 2018-05 | 2018-04 | 2018-03 | 2018-02 | 2018-01 | 2017-12 | 2017-11 | 2017-10 | 2017-09 | 2017-08 | 2017-07 | 2017-06 | 2017-05 | 2017-04 | 2017-03 | 2017-02 | 2017-01 | 2016-12 | 2016-11 | 2016-10 | 2016-09 | 2016-08 | 2016-07 | 2016-06 | 2016-05 | 2016-04 | 2016-03 | 2016-02 |
|---|---|---|---|---|---|---|---|---|---|---|---|---|---|---|---|---|---|---|---|---|---|---|---|---|---|---|---|---|---|---|---|---|---|---|---|---|---|---|---|---|---|---|---|---|---|---|---|---|---|---|---|---|
| pm25 | 4.7 | 6.7 | 5.8 | 5 | 5.8 | 5.8 | 8.9 | 4.5 | 4.9 | 4.9 | 4.5 | 4.5 | 4.6 | 14 | 6.2 | 12 | 7.1 | 7.4 | 6.7 | 5 | 7 | 6.6 | 8 | 11 | 12 | 9.6 | 11 | 11 | 10 | 9.8 | 8.6 | 7.4 | 6.7 | 6.1 | 5.5 | 5.1 | 8.9 | 6.5 | 9 | 9.1 | 11 | 8.6 | 9.9 | 6.8 | 5 | 6.7 | 5.2 | 7.2 | 8.2 | 5.8 | 6.6 | 15 |
| pm10 | 7.4 | 11 | 11 | 9.3 | 10 | 9.6 | 13 | 8.5 | 9.5 | 8.8 | 8.3 | 8.2 | 8.2 | 21 | 11 | 19 | 12 | 11 | 10 | 9.1 | 8.8 | 6.9 | 9.7 | 14 | 13 | 11 | 12 | 14 | 15 | 14 | 13 | 12 | 10 | 10 | 12 | 11 | 18 | 14 | 17 | 15 | 16 | 16 | 15 | 13 | 10 | 11 | 9.2 | 13 | 14 | 11 | 10 | 21 |
| o3 | 60 | 67 | 54 | 54 | 49 | 38 | 20 | 34 | 34 | 43 | 40 | 51 | 54 | 70 | 58 | 40 | 32 | 25 | 34 | 37 | 41 | 33 | 43 | 53 | 63 | 61 | 51 | 39 | 34 | 28 | 31 | 38 | 32 | 33 | 35 | 44 | 60 | 64 | 46 | 45 | 31 | 34 | 21 | 27 | 34 | 35 | 35 | 49 | 65 | 54 | 43 | 24 |
| no2 | 9.3 | 9.6 | 20 | 22 | 23 | 32 | 37 | 23 | 19 | 16 | 13 | 10 | 15 | 19 | 19 | 31 | 37 | 38 | 26 | 26 | 17 | 14 | 13 | 14 | 17 | 21 | 26 | 34 | 35 | 44 | 38 | 23 | 23 | 15 | 14 | 14 | 16 | 18 | 29 | 27 | 36 | 33 | 47 | 29 | 19 | 19 | 16 | 17 | 18 | 23 | 29 | 61 |