Air Pollution in Lancashire: Real-time Air Quality Index and smog alert.
Pollution and air quality forecast for Lancashire. Today is Tuesday, June 16, 2026. The following air pollution values have been recorded for Lancashire:- particulate matter (PM10) suspended dust - 15 (Good)
- ozone (O3) - 47 (Good)
- particulate matter (PM2.5) dust - 8 (Good)
- nitrogen dioxide (NO2) - 15 (Good)

What is the air quality in Lancashire today? Is the air polluted in Lancashire?. Is there smog?
What is the level of PM10 today in Lancashire? (particulate matter (PM10) suspended dust)
The current level of particulate matter PM10 in Lancashire is:
15 (Good)
The highest PM10 values usually occur in month: 19 (March 2020).
The lowest value of particulate matter PM10 pollution in Lancashire is usually recorded in: July (10).
How is the O3 level today in Lancashire? (ozone (O3))
47 (Good)
What is the current level of PM2.5 in Lancashire? (particulate matter (PM2.5) dust)
Today's PM2.5 level is:
8 (Good)
For comparison, the highest level of PM2.5 in Lancashire in the last 7 days was: 12 (Monday, February 5, 2024) and the lowest: 5 (Sunday, May 28, 2023).
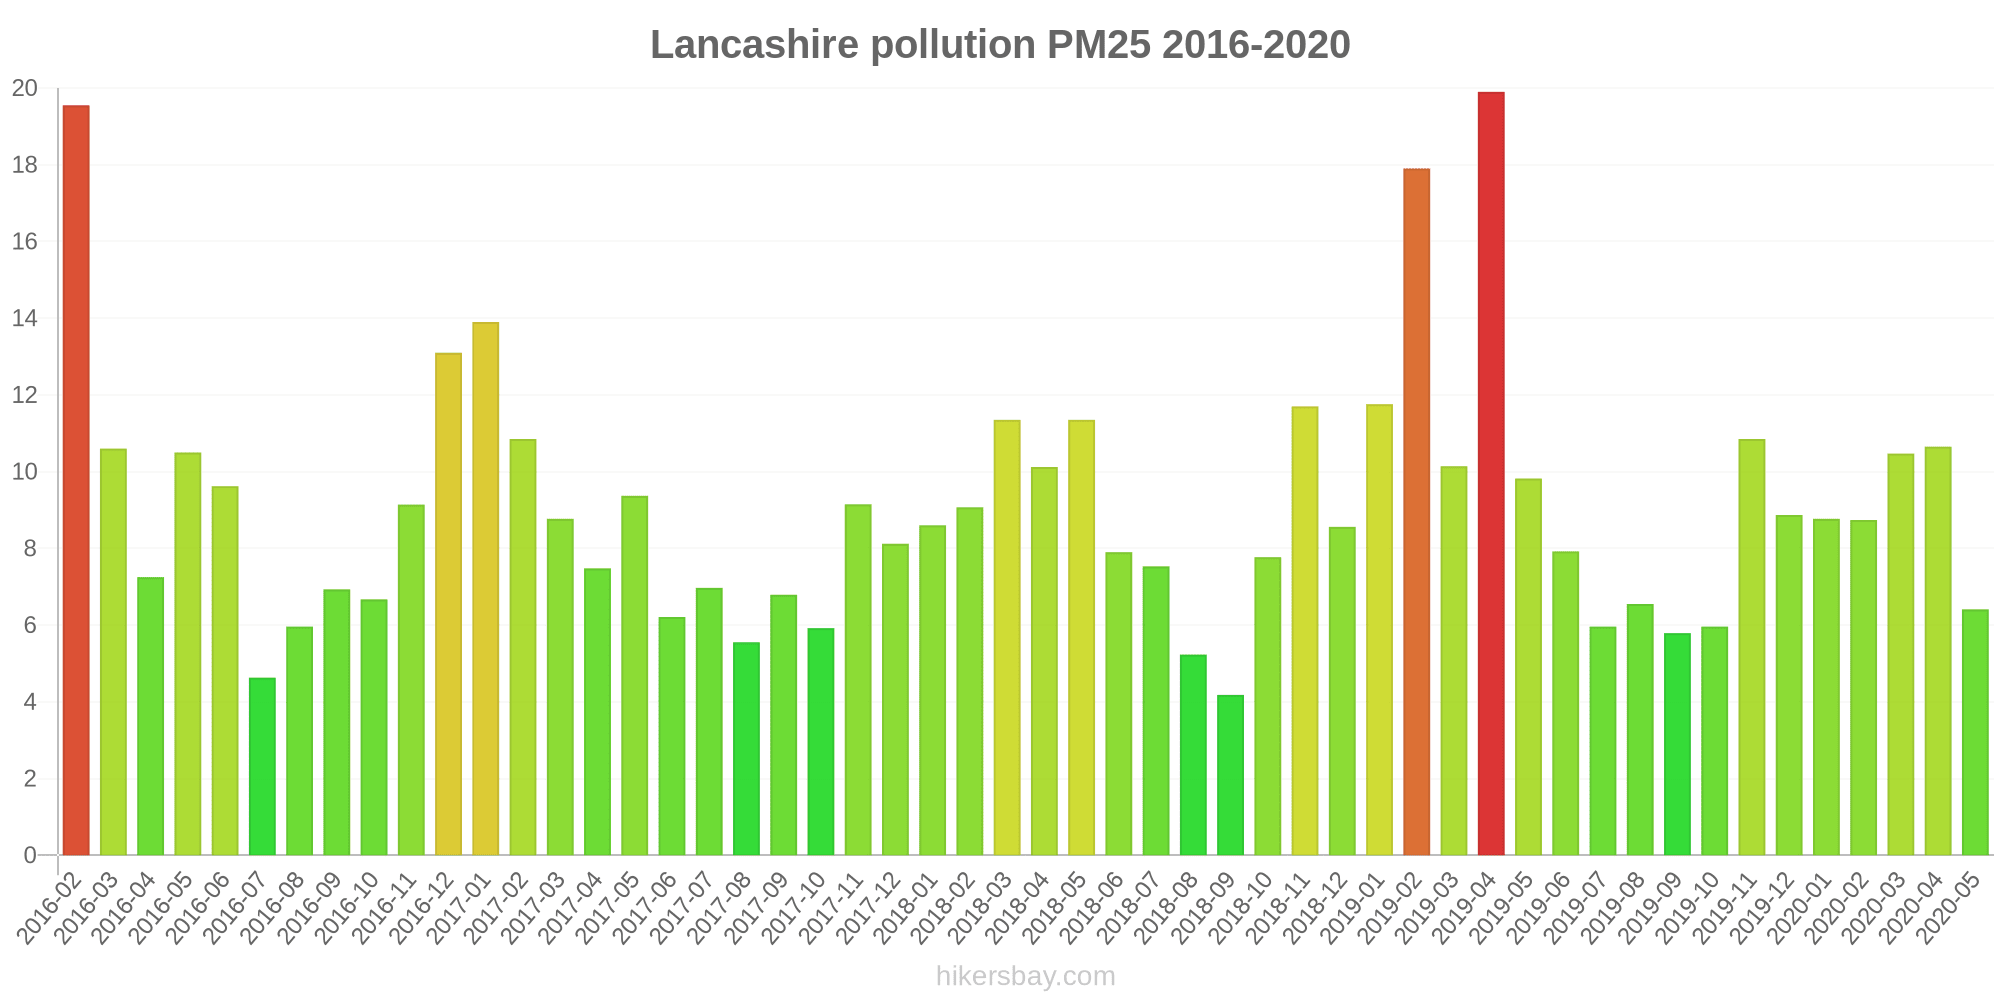
The highest PM2.5 values were recorded: 20 (April 2019).
The lowest level of particulate matter PM2.5 pollution occurs in month: September (4.2).
How high is the level of NO2? (nitrogen dioxide (NO2))
15 (Good)
Current data Wednesday, February 7, 2024, 7:00 AM
PM10 15 (Good)
O3 47 (Good)
PM2,5 8 (Good)
NO2 15 (Good)
Data on air pollution from recent days in Lancashire
index
2023-05-24
2023-05-25
2023-05-26
2023-05-28
2023-05-29
2023-05-30
2023-05-31
2024-01-31
2024-02-02
2024-02-03
2024-02-04
2024-02-05
2024-02-06
2024-02-07
pm25
8
Good
6
Good
10
Good
5
Good
6
Good
8
Good
8
Good
5
Good
5
Good
7
Good
8
Good
12
Good
7
Good
7
Good
pm10
14
Good
11
Good
17
Good
8
Good
12
Good
15
Good
14
Good
8
Good
10
Good
13
Good
16
Good
27
Moderate
15
Good
15
Good
o3
80
Moderate
68
Good
54
Good
63
Good
57
Good
63
Good
69
Good
51
Good
58
Good
63
Good
63
Good
65
Good
63
Good
24
Good
no2
2
Good
4
Good
6
Good
3
Good
5
Good
5
Good
2
Good
16
Good
11
Good
11
Good
6
Good
8
Good
19
Good
25
Good
data source »
Air pollution in Lancashire from February 2016 to May 2020

index
2020-05
2020-04
2020-03
2020-02
2020-01
2019-12
2019-11
2019-10
2019-09
2019-08
2019-07
2019-06
2019-05
2019-04
2019-03
2019-02
2019-01
2018-12
2018-11
2018-10
2018-09
2018-08
2018-07
2018-06
2018-05
2018-04
2018-03
2018-02
2018-01
2017-12
2017-11
2017-10
2017-09
2017-08
2017-07
2017-06
2017-05
2017-04
2017-03
2017-02
2017-01
2016-12
2016-11
2016-10
2016-09
2016-08
2016-07
2016-06
2016-05
2016-04
2016-03
2016-02
o3
67 (Good)
73 (Moderate)
61 (Good)
64 (Good)
46 (Good)
41 (Good)
29 (Good)
39 (Good)
41 (Good)
52 (Good)
47 (Good)
56 (Good)
66 (Good)
75 (Moderate)
68 (Good)
43 (Good)
38 (Good)
40 (Good)
39 (Good)
45 (Good)
49 (Good)
43 (Good)
57 (Good)
65 (Good)
74 (Moderate)
67 (Good)
59 (Good)
51 (Good)
49 (Good)
44 (Good)
47 (Good)
47 (Good)
42 (Good)
43 (Good)
47 (Good)
54 (Good)
64 (Good)
68 (Good)
56 (Good)
51 (Good)
36 (Good)
32 (Good)
33 (Good)
36 (Good)
41 (Good)
46 (Good)
46 (Good)
57 (Good)
71 (Moderate)
63 (Good)
56 (Good)
47 (Good)
no2
10 (Good)
10 (Good)
15 (Good)
14 (Good)
20 (Good)
23 (Good)
25 (Good)
18 (Good)
14 (Good)
9.7 (Good)
9.6 (Good)
10 (Good)
13 (Good)
16 (Good)
15 (Good)
28 (Good)
33 (Good)
25 (Good)
20 (Good)
19 (Good)
15 (Good)
11 (Good)
12 (Good)
12 (Good)
14 (Good)
17 (Good)
21 (Good)
25 (Good)
23 (Good)
28 (Good)
23 (Good)
16 (Good)
16 (Good)
13 (Good)
10 (Good)
11 (Good)
13 (Good)
14 (Good)
19 (Good)
21 (Good)
30 (Good)
31 (Good)
33 (Good)
20 (Good)
16 (Good)
12 (Good)
8.2 (Good)
13 (Good)
14 (Good)
17 (Good)
23 (Good)
29 (Good)
pm25
6.4 (Good)
11 (Good)
10 (Good)
8.7 (Good)
8.8 (Good)
8.9 (Good)
11 (Good)
6 (Good)
5.8 (Good)
6.5 (Good)
6 (Good)
7.9 (Good)
9.8 (Good)
20 (Moderate)
10 (Good)
18 (Moderate)
12 (Good)
8.6 (Good)
12 (Good)
7.8 (Good)
4.2 (Good)
5.2 (Good)
7.5 (Good)
7.9 (Good)
11 (Good)
10 (Good)
11 (Good)
9.1 (Good)
8.6 (Good)
8.1 (Good)
9.2 (Good)
5.9 (Good)
6.8 (Good)
5.5 (Good)
7 (Good)
6.2 (Good)
9.4 (Good)
7.5 (Good)
8.8 (Good)
11 (Good)
14 (Moderate)
13 (Moderate)
9.1 (Good)
6.7 (Good)
6.9 (Good)
6 (Good)
4.6 (Good)
9.6 (Good)
11 (Good)
7.3 (Good)
11 (Good)
20 (Moderate)
pm10
11 (Good)
17 (Good)
19 (Good)
18 (Good)
15 (Good)
15 (Good)
15 (Good)
11 (Good)
12 (Good)
13 (Good)
10 (Good)
15 (Good)
- (Good)
- (Good)
- (Good)
- (Good)
- (Good)
- (Good)
- (Good)
- (Good)
- (Good)
- (Good)
- (Good)
- (Good)
- (Good)
- (Good)
- (Good)
- (Good)
- (Good)
- (Good)
- (Good)
- (Good)
- (Good)
- (Good)
- (Good)
- (Good)
- (Good)
- (Good)
- (Good)
- (Good)
- (Good)
- (Good)
- (Good)
- (Good)
- (Good)
- (Good)
- (Good)
- (Good)
- (Good)
- (Good)
- (Good)
- (Good)
data source »
Quality of life in Lancashire
Green and Parks in the City
Lancashire
81%
Isle of Man: 78%
Ireland: 72%
Netherlands: 82%
Belgium: 64%
Faroe Islands: 87%
particulate matter PM2.5
Lancashire
10 (Good)
Pleasure of spending time in the city
Lancashire
96%
Isle of Man: 83%
Ireland: 78%
Netherlands: 88%
Belgium: 64%
Faroe Islands: 100%
particulate matter PM10
Lancashire
14 (Good)
Air Pollution
Lancashire
16%
Isle of Man: 13%
Ireland: 24%
Netherlands: 21%
Belgium: 45%
Faroe Islands: 0%
Garbage Disposal
Lancashire
75%
Isle of Man: 78%
Ireland: 61%
Netherlands: 79%
Belgium: 54%
Faroe Islands: 88%
Availability and quality of drinking water
Lancashire
100%
Isle of Man: 88%
Ireland: 72%
Netherlands: 92%
Belgium: 70%
Faroe Islands: 98%
Cleanliness and tidiness
Lancashire
63%
Isle of Man: 69%
Ireland: 52%
Netherlands: 77%
Belgium: 46%
Faroe Islands: 94%
Noise and Light pollution
Lancashire
13%
Isle of Man: 12%
Ireland: 37%
Netherlands: 31%
Belgium: 54%
Faroe Islands: 21%
Water Pollution
Lancashire
19%
Isle of Man: 13%
Ireland: 37%
Netherlands: 17%
Belgium: 42%
Faroe Islands: 7.7%
Source: Numbeo
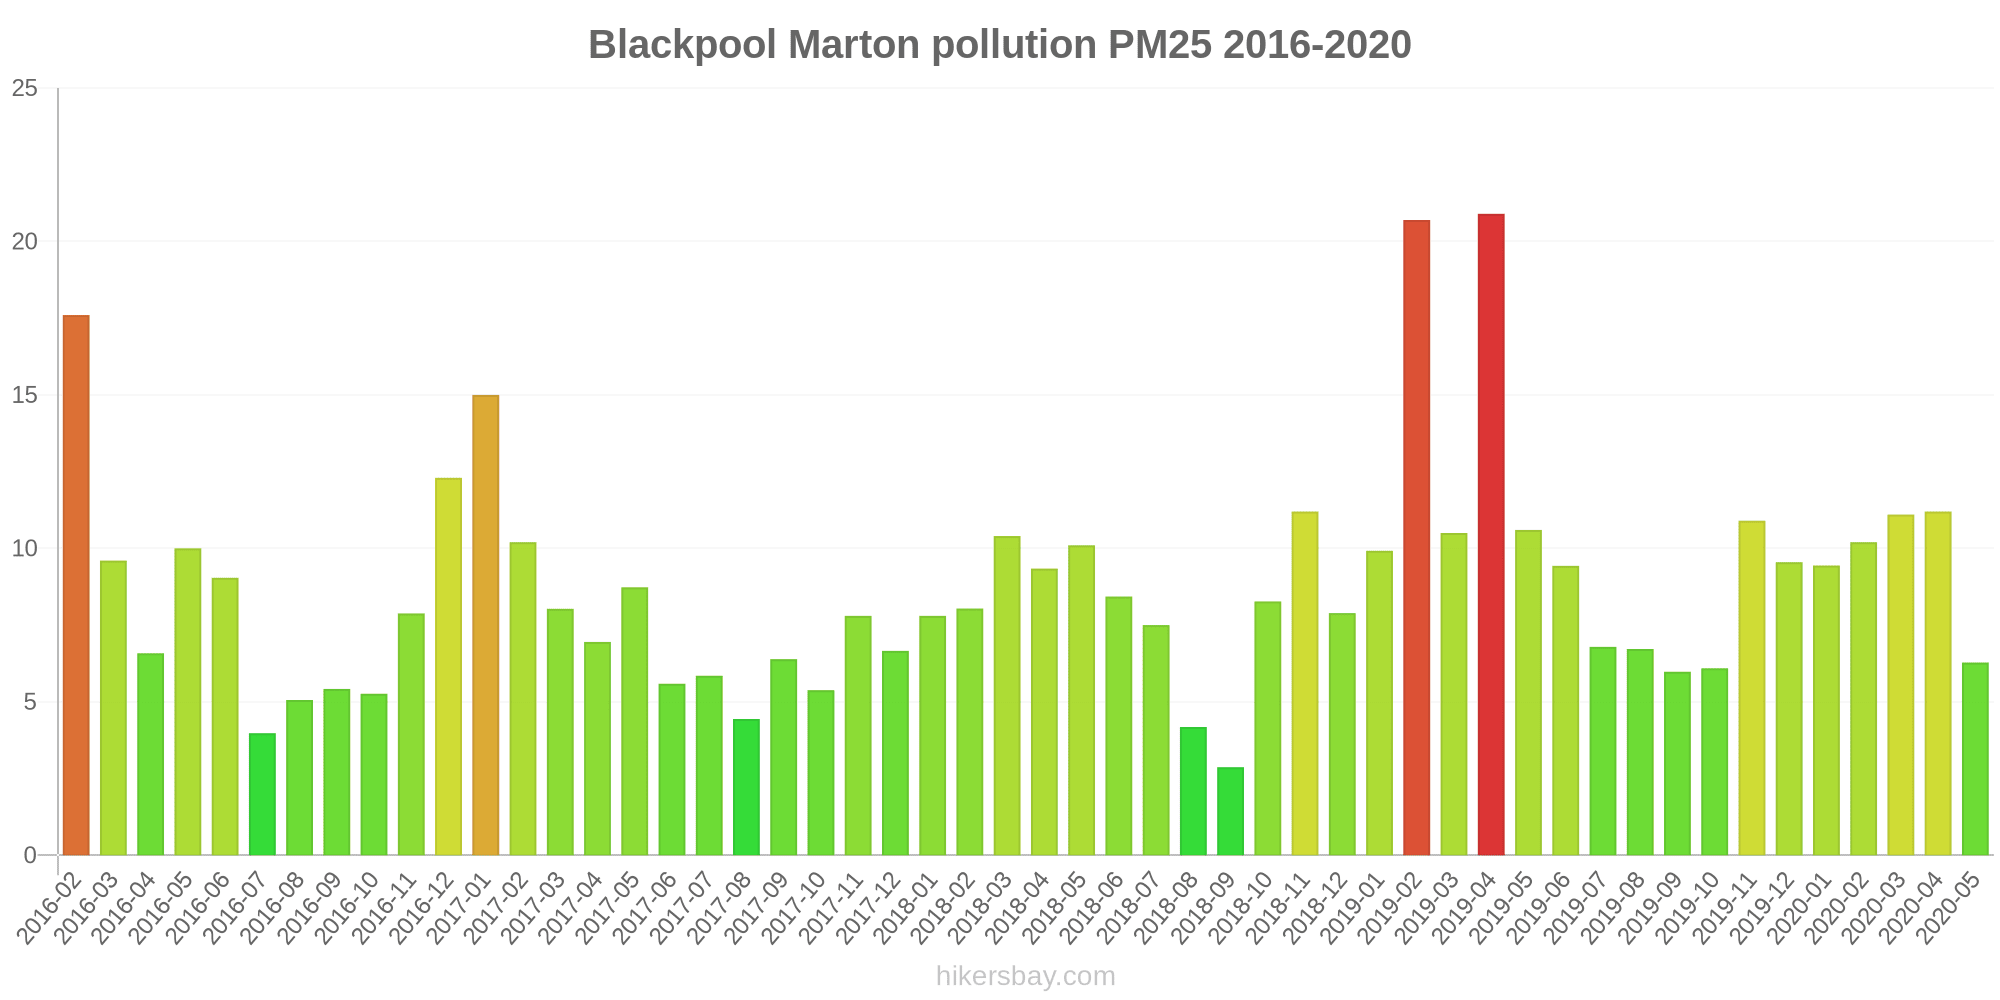
Blackpool Marton
Wednesday, May 31, 2023, 12:00 AM
PM10 14 (Good)
particulate matter (PM10) suspended dust
O3 69 (Good)
ozone (O3)
PM2,5 8 (Good)
particulate matter (PM2.5) dust
NO2 2 (Good)
nitrogen dioxide (NO2)
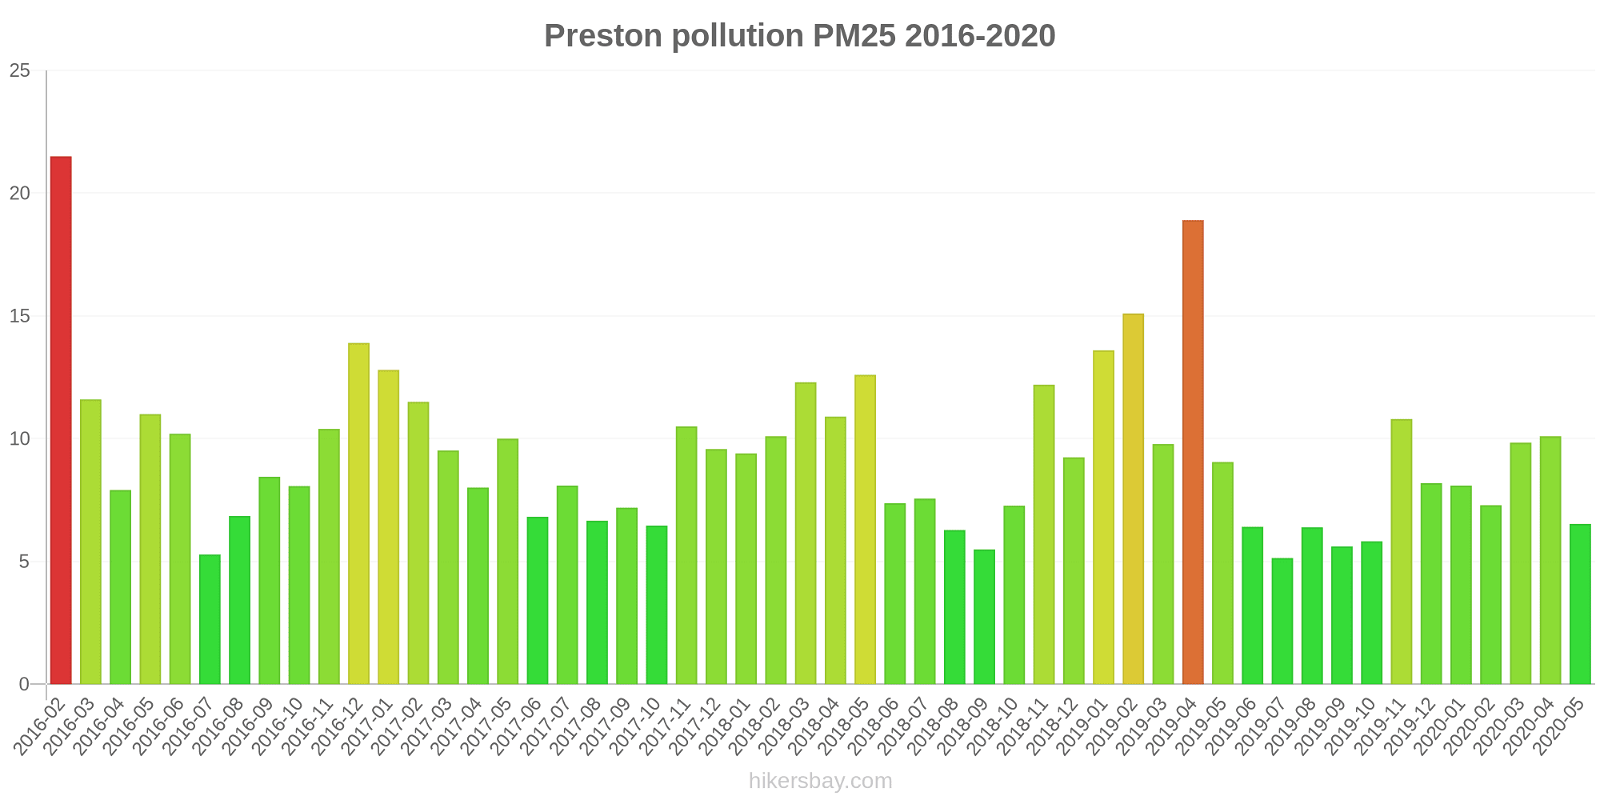
Preston
Wednesday, February 7, 2024, 7:00 AM
PM2,5 8 (Good)
particulate matter (PM2.5) dust
PM10 15 (Good)
particulate matter (PM10) suspended dust
O3 25 (Good)
ozone (O3)
NO2 28 (Good)
nitrogen dioxide (NO2)
Blackpool Marton
index
2023-05-31
2023-05-30
2023-05-29
2023-05-28
2023-05-26
2023-05-25
2023-05-24
pm25
8
7.8
6.5
4.7
10
5.8
7.7
pm10
14
15
12
8.2
17
11
14
o3
69
63
57
63
54
68
80
no2
2
5.1
5.5
3.2
6.3
3.9
2.2
Preston
index
2024-02-07
2024-02-06
2024-02-05
2024-02-04
2024-02-03
2024-02-02
2024-01-31
o3
24
63
65
63
63
58
51
pm10
15
15
27
16
13
9.6
8.5
no2
25
19
7.7
6.2
11
11
16
pm25
7.3
7.1
12
7.8
7.1
5.3
4.7
Blackpool Marton
2016-02 2020-05

index
2020-05
2020-04
2020-03
2020-02
2020-01
2019-12
2019-11
2019-10
2019-09
2019-08
2019-07
2019-06
2019-05
2019-04
2019-03
2019-02
2019-01
2018-12
2018-11
2018-10
2018-09
2018-08
2018-07
2018-06
2018-05
2018-04
2018-03
2018-02
2018-01
2017-12
2017-11
2017-10
2017-09
2017-08
2017-07
2017-06
2017-05
2017-04
2017-03
2017-02
2017-01
2016-12
2016-11
2016-10
2016-09
2016-08
2016-07
2016-06
2016-05
2016-04
2016-03
2016-02
pm25
6.3
11
11
10
9.4
9.6
11
6.1
6
6.7
6.8
9.4
11
21
11
21
9.9
7.9
11
8.3
2.9
4.2
7.5
8.4
10
9.3
10
8
7.8
6.7
7.8
5.4
6.4
4.4
5.8
5.6
8.7
7
8
10
15
12
7.9
5.3
5.4
5.1
4
9
10
6.6
9.6
18
o3
70
74
65
70
55
48
35
46
48
57
52
61
71
77
74
48
45
46
42
50
55
49
61
69
77
69
62
55
53
52
56
54
48
50
52
60
69
74
60
55
40
35
39
39
45
49
50
60
74
65
58
50
no2
5.9
7.4
11
8.9
15
17
19
12
8.3
6.1
6
6.8
7.5
12
9.9
22
27
20
16
13
9.5
7
9.2
9.7
11
14
17
19
19
19
16
13
12
9.7
7.7
7.3
9.1
10
16
18
26
28
26
16
12
9.2
5.2
9.2
11
13
19
22
pm10
11
18
19
21
17
17
15
12
12
13
11
-
-
-
-
-
-
-
-
-
-
-
-
-
-
-
-
-
-
-
-
-
-
-
-
-
-
-
-
-
-
-
-
-
-
-
-
-
-
-
-
-
Preston
2016-02 2020-05
index
2020-05
2020-04
2020-03
2020-02
2020-01
2019-12
2019-11
2019-10
2019-09
2019-08
2019-07
2019-06
2019-05
2019-04
2019-03
2019-02
2019-01
2018-12
2018-11
2018-10
2018-09
2018-08
2018-07
2018-06
2018-05
2018-04
2018-03
2018-02
2018-01
2017-12
2017-11
2017-10
2017-09
2017-08
2017-07
2017-06
2017-05
2017-04
2017-03
2017-02
2017-01
2016-12
2016-11
2016-10
2016-09
2016-08
2016-07
2016-06
2016-05
2016-04
2016-03
2016-02
pm25
6.5
10
9.8
7.3
8.1
8.2
11
5.8
5.6
6.4
5.1
6.4
9.1
19
9.8
15
14
9.2
12
7.3
5.5
6.3
7.6
7.4
13
11
12
10
9.4
9.6
11
6.5
7.2
6.7
8.1
6.8
10
8
9.5
12
13
14
10
8.1
8.4
6.8
5.3
10
11
7.9
12
22
o3
63
72
57
58
37
34
24
33
35
48
43
51
61
74
62
37
32
35
36
39
43
38
53
61
71
64
56
46
46
37
39
40
36
37
42
49
60
63
52
47
32
29
27
33
37
42
42
55
68
62
55
45
no2
14
13
19
20
25
28
31
24
19
13
13
14
19
21
20
34
40
30
24
24
20
15
15
14
17
20
26
31
28
36
31
20
20
17
13
14
16
18
23
25
33
35
41
24
19
14
11
16
17
20
28
37
pm10
11
17
18
14
13
13
15
11
11
12
10
15
-
-
-
-
-
-
-
-
-
-
-
-
-
-
-
-
-
-
-
-
-
-
-
-
-
-
-
-
-
-
-
-
-
-
-
-
-
-
-
-
* Pollution data source:
https://openaq.org
(DEFRA)
The data is licensed under CC-By 4.0
PM10 15 (Good)
O3 47 (Good)
PM2,5 8 (Good)
NO2 15 (Good)
Data on air pollution from recent days in Lancashire
| index | 2023-05-24 | 2023-05-25 | 2023-05-26 | 2023-05-28 | 2023-05-29 | 2023-05-30 | 2023-05-31 | 2024-01-31 | 2024-02-02 | 2024-02-03 | 2024-02-04 | 2024-02-05 | 2024-02-06 | 2024-02-07 |
|---|---|---|---|---|---|---|---|---|---|---|---|---|---|---|
| pm25 | 8 Good |
6 Good |
10 Good |
5 Good |
6 Good |
8 Good |
8 Good |
5 Good |
5 Good |
7 Good |
8 Good |
12 Good |
7 Good |
7 Good |
| pm10 | 14 Good |
11 Good |
17 Good |
8 Good |
12 Good |
15 Good |
14 Good |
8 Good |
10 Good |
13 Good |
16 Good |
27 Moderate |
15 Good |
15 Good |
| o3 | 80 Moderate |
68 Good |
54 Good |
63 Good |
57 Good |
63 Good |
69 Good |
51 Good |
58 Good |
63 Good |
63 Good |
65 Good |
63 Good |
24 Good |
| no2 | 2 Good |
4 Good |
6 Good |
3 Good |
5 Good |
5 Good |
2 Good |
16 Good |
11 Good |
11 Good |
6 Good |
8 Good |
19 Good |
25 Good |
| index | 2020-05 | 2020-04 | 2020-03 | 2020-02 | 2020-01 | 2019-12 | 2019-11 | 2019-10 | 2019-09 | 2019-08 | 2019-07 | 2019-06 | 2019-05 | 2019-04 | 2019-03 | 2019-02 | 2019-01 | 2018-12 | 2018-11 | 2018-10 | 2018-09 | 2018-08 | 2018-07 | 2018-06 | 2018-05 | 2018-04 | 2018-03 | 2018-02 | 2018-01 | 2017-12 | 2017-11 | 2017-10 | 2017-09 | 2017-08 | 2017-07 | 2017-06 | 2017-05 | 2017-04 | 2017-03 | 2017-02 | 2017-01 | 2016-12 | 2016-11 | 2016-10 | 2016-09 | 2016-08 | 2016-07 | 2016-06 | 2016-05 | 2016-04 | 2016-03 | 2016-02 |
|---|---|---|---|---|---|---|---|---|---|---|---|---|---|---|---|---|---|---|---|---|---|---|---|---|---|---|---|---|---|---|---|---|---|---|---|---|---|---|---|---|---|---|---|---|---|---|---|---|---|---|---|---|
| o3 | 67 (Good) | 73 (Moderate) | 61 (Good) | 64 (Good) | 46 (Good) | 41 (Good) | 29 (Good) | 39 (Good) | 41 (Good) | 52 (Good) | 47 (Good) | 56 (Good) | 66 (Good) | 75 (Moderate) | 68 (Good) | 43 (Good) | 38 (Good) | 40 (Good) | 39 (Good) | 45 (Good) | 49 (Good) | 43 (Good) | 57 (Good) | 65 (Good) | 74 (Moderate) | 67 (Good) | 59 (Good) | 51 (Good) | 49 (Good) | 44 (Good) | 47 (Good) | 47 (Good) | 42 (Good) | 43 (Good) | 47 (Good) | 54 (Good) | 64 (Good) | 68 (Good) | 56 (Good) | 51 (Good) | 36 (Good) | 32 (Good) | 33 (Good) | 36 (Good) | 41 (Good) | 46 (Good) | 46 (Good) | 57 (Good) | 71 (Moderate) | 63 (Good) | 56 (Good) | 47 (Good) |
| no2 | 10 (Good) | 10 (Good) | 15 (Good) | 14 (Good) | 20 (Good) | 23 (Good) | 25 (Good) | 18 (Good) | 14 (Good) | 9.7 (Good) | 9.6 (Good) | 10 (Good) | 13 (Good) | 16 (Good) | 15 (Good) | 28 (Good) | 33 (Good) | 25 (Good) | 20 (Good) | 19 (Good) | 15 (Good) | 11 (Good) | 12 (Good) | 12 (Good) | 14 (Good) | 17 (Good) | 21 (Good) | 25 (Good) | 23 (Good) | 28 (Good) | 23 (Good) | 16 (Good) | 16 (Good) | 13 (Good) | 10 (Good) | 11 (Good) | 13 (Good) | 14 (Good) | 19 (Good) | 21 (Good) | 30 (Good) | 31 (Good) | 33 (Good) | 20 (Good) | 16 (Good) | 12 (Good) | 8.2 (Good) | 13 (Good) | 14 (Good) | 17 (Good) | 23 (Good) | 29 (Good) |
| pm25 | 6.4 (Good) | 11 (Good) | 10 (Good) | 8.7 (Good) | 8.8 (Good) | 8.9 (Good) | 11 (Good) | 6 (Good) | 5.8 (Good) | 6.5 (Good) | 6 (Good) | 7.9 (Good) | 9.8 (Good) | 20 (Moderate) | 10 (Good) | 18 (Moderate) | 12 (Good) | 8.6 (Good) | 12 (Good) | 7.8 (Good) | 4.2 (Good) | 5.2 (Good) | 7.5 (Good) | 7.9 (Good) | 11 (Good) | 10 (Good) | 11 (Good) | 9.1 (Good) | 8.6 (Good) | 8.1 (Good) | 9.2 (Good) | 5.9 (Good) | 6.8 (Good) | 5.5 (Good) | 7 (Good) | 6.2 (Good) | 9.4 (Good) | 7.5 (Good) | 8.8 (Good) | 11 (Good) | 14 (Moderate) | 13 (Moderate) | 9.1 (Good) | 6.7 (Good) | 6.9 (Good) | 6 (Good) | 4.6 (Good) | 9.6 (Good) | 11 (Good) | 7.3 (Good) | 11 (Good) | 20 (Moderate) |
| pm10 | 11 (Good) | 17 (Good) | 19 (Good) | 18 (Good) | 15 (Good) | 15 (Good) | 15 (Good) | 11 (Good) | 12 (Good) | 13 (Good) | 10 (Good) | 15 (Good) | - (Good) | - (Good) | - (Good) | - (Good) | - (Good) | - (Good) | - (Good) | - (Good) | - (Good) | - (Good) | - (Good) | - (Good) | - (Good) | - (Good) | - (Good) | - (Good) | - (Good) | - (Good) | - (Good) | - (Good) | - (Good) | - (Good) | - (Good) | - (Good) | - (Good) | - (Good) | - (Good) | - (Good) | - (Good) | - (Good) | - (Good) | - (Good) | - (Good) | - (Good) | - (Good) | - (Good) | - (Good) | - (Good) | - (Good) | - (Good) |
Green and Parks in the City
Lancashire 81%
Isle of Man: 78% Ireland: 72% Netherlands: 82% Belgium: 64% Faroe Islands: 87%particulate matter PM2.5
Lancashire 10 (Good)
Pleasure of spending time in the city
Lancashire 96%
Isle of Man: 83% Ireland: 78% Netherlands: 88% Belgium: 64% Faroe Islands: 100%particulate matter PM10
Lancashire 14 (Good)
Air Pollution
Lancashire 16%
Isle of Man: 13% Ireland: 24% Netherlands: 21% Belgium: 45% Faroe Islands: 0%Garbage Disposal
Lancashire 75%
Isle of Man: 78% Ireland: 61% Netherlands: 79% Belgium: 54% Faroe Islands: 88%Availability and quality of drinking water
Lancashire 100%
Isle of Man: 88% Ireland: 72% Netherlands: 92% Belgium: 70% Faroe Islands: 98%Cleanliness and tidiness
Lancashire 63%
Isle of Man: 69% Ireland: 52% Netherlands: 77% Belgium: 46% Faroe Islands: 94%Noise and Light pollution
Lancashire 13%
Isle of Man: 12% Ireland: 37% Netherlands: 31% Belgium: 54% Faroe Islands: 21%Water Pollution
Lancashire 19%
Isle of Man: 13% Ireland: 37% Netherlands: 17% Belgium: 42% Faroe Islands: 7.7%PM10 14 (Good)
particulate matter (PM10) suspended dustO3 69 (Good)
ozone (O3)PM2,5 8 (Good)
particulate matter (PM2.5) dustNO2 2 (Good)
nitrogen dioxide (NO2)PM2,5 8 (Good)
particulate matter (PM2.5) dustPM10 15 (Good)
particulate matter (PM10) suspended dustO3 25 (Good)
ozone (O3)NO2 28 (Good)
nitrogen dioxide (NO2)Blackpool Marton
| index | 2023-05-31 | 2023-05-30 | 2023-05-29 | 2023-05-28 | 2023-05-26 | 2023-05-25 | 2023-05-24 |
|---|---|---|---|---|---|---|---|
| pm25 | 8 | 7.8 | 6.5 | 4.7 | 10 | 5.8 | 7.7 |
| pm10 | 14 | 15 | 12 | 8.2 | 17 | 11 | 14 |
| o3 | 69 | 63 | 57 | 63 | 54 | 68 | 80 |
| no2 | 2 | 5.1 | 5.5 | 3.2 | 6.3 | 3.9 | 2.2 |
Preston
| index | 2024-02-07 | 2024-02-06 | 2024-02-05 | 2024-02-04 | 2024-02-03 | 2024-02-02 | 2024-01-31 |
|---|---|---|---|---|---|---|---|
| o3 | 24 | 63 | 65 | 63 | 63 | 58 | 51 |
| pm10 | 15 | 15 | 27 | 16 | 13 | 9.6 | 8.5 |
| no2 | 25 | 19 | 7.7 | 6.2 | 11 | 11 | 16 |
| pm25 | 7.3 | 7.1 | 12 | 7.8 | 7.1 | 5.3 | 4.7 |
Blackpool Marton
| index | 2020-05 | 2020-04 | 2020-03 | 2020-02 | 2020-01 | 2019-12 | 2019-11 | 2019-10 | 2019-09 | 2019-08 | 2019-07 | 2019-06 | 2019-05 | 2019-04 | 2019-03 | 2019-02 | 2019-01 | 2018-12 | 2018-11 | 2018-10 | 2018-09 | 2018-08 | 2018-07 | 2018-06 | 2018-05 | 2018-04 | 2018-03 | 2018-02 | 2018-01 | 2017-12 | 2017-11 | 2017-10 | 2017-09 | 2017-08 | 2017-07 | 2017-06 | 2017-05 | 2017-04 | 2017-03 | 2017-02 | 2017-01 | 2016-12 | 2016-11 | 2016-10 | 2016-09 | 2016-08 | 2016-07 | 2016-06 | 2016-05 | 2016-04 | 2016-03 | 2016-02 |
|---|---|---|---|---|---|---|---|---|---|---|---|---|---|---|---|---|---|---|---|---|---|---|---|---|---|---|---|---|---|---|---|---|---|---|---|---|---|---|---|---|---|---|---|---|---|---|---|---|---|---|---|---|
| pm25 | 6.3 | 11 | 11 | 10 | 9.4 | 9.6 | 11 | 6.1 | 6 | 6.7 | 6.8 | 9.4 | 11 | 21 | 11 | 21 | 9.9 | 7.9 | 11 | 8.3 | 2.9 | 4.2 | 7.5 | 8.4 | 10 | 9.3 | 10 | 8 | 7.8 | 6.7 | 7.8 | 5.4 | 6.4 | 4.4 | 5.8 | 5.6 | 8.7 | 7 | 8 | 10 | 15 | 12 | 7.9 | 5.3 | 5.4 | 5.1 | 4 | 9 | 10 | 6.6 | 9.6 | 18 |
| o3 | 70 | 74 | 65 | 70 | 55 | 48 | 35 | 46 | 48 | 57 | 52 | 61 | 71 | 77 | 74 | 48 | 45 | 46 | 42 | 50 | 55 | 49 | 61 | 69 | 77 | 69 | 62 | 55 | 53 | 52 | 56 | 54 | 48 | 50 | 52 | 60 | 69 | 74 | 60 | 55 | 40 | 35 | 39 | 39 | 45 | 49 | 50 | 60 | 74 | 65 | 58 | 50 |
| no2 | 5.9 | 7.4 | 11 | 8.9 | 15 | 17 | 19 | 12 | 8.3 | 6.1 | 6 | 6.8 | 7.5 | 12 | 9.9 | 22 | 27 | 20 | 16 | 13 | 9.5 | 7 | 9.2 | 9.7 | 11 | 14 | 17 | 19 | 19 | 19 | 16 | 13 | 12 | 9.7 | 7.7 | 7.3 | 9.1 | 10 | 16 | 18 | 26 | 28 | 26 | 16 | 12 | 9.2 | 5.2 | 9.2 | 11 | 13 | 19 | 22 |
| pm10 | 11 | 18 | 19 | 21 | 17 | 17 | 15 | 12 | 12 | 13 | 11 | - | - | - | - | - | - | - | - | - | - | - | - | - | - | - | - | - | - | - | - | - | - | - | - | - | - | - | - | - | - | - | - | - | - | - | - | - | - | - | - | - |
Preston

| index | 2020-05 | 2020-04 | 2020-03 | 2020-02 | 2020-01 | 2019-12 | 2019-11 | 2019-10 | 2019-09 | 2019-08 | 2019-07 | 2019-06 | 2019-05 | 2019-04 | 2019-03 | 2019-02 | 2019-01 | 2018-12 | 2018-11 | 2018-10 | 2018-09 | 2018-08 | 2018-07 | 2018-06 | 2018-05 | 2018-04 | 2018-03 | 2018-02 | 2018-01 | 2017-12 | 2017-11 | 2017-10 | 2017-09 | 2017-08 | 2017-07 | 2017-06 | 2017-05 | 2017-04 | 2017-03 | 2017-02 | 2017-01 | 2016-12 | 2016-11 | 2016-10 | 2016-09 | 2016-08 | 2016-07 | 2016-06 | 2016-05 | 2016-04 | 2016-03 | 2016-02 |
|---|---|---|---|---|---|---|---|---|---|---|---|---|---|---|---|---|---|---|---|---|---|---|---|---|---|---|---|---|---|---|---|---|---|---|---|---|---|---|---|---|---|---|---|---|---|---|---|---|---|---|---|---|
| pm25 | 6.5 | 10 | 9.8 | 7.3 | 8.1 | 8.2 | 11 | 5.8 | 5.6 | 6.4 | 5.1 | 6.4 | 9.1 | 19 | 9.8 | 15 | 14 | 9.2 | 12 | 7.3 | 5.5 | 6.3 | 7.6 | 7.4 | 13 | 11 | 12 | 10 | 9.4 | 9.6 | 11 | 6.5 | 7.2 | 6.7 | 8.1 | 6.8 | 10 | 8 | 9.5 | 12 | 13 | 14 | 10 | 8.1 | 8.4 | 6.8 | 5.3 | 10 | 11 | 7.9 | 12 | 22 |
| o3 | 63 | 72 | 57 | 58 | 37 | 34 | 24 | 33 | 35 | 48 | 43 | 51 | 61 | 74 | 62 | 37 | 32 | 35 | 36 | 39 | 43 | 38 | 53 | 61 | 71 | 64 | 56 | 46 | 46 | 37 | 39 | 40 | 36 | 37 | 42 | 49 | 60 | 63 | 52 | 47 | 32 | 29 | 27 | 33 | 37 | 42 | 42 | 55 | 68 | 62 | 55 | 45 |
| no2 | 14 | 13 | 19 | 20 | 25 | 28 | 31 | 24 | 19 | 13 | 13 | 14 | 19 | 21 | 20 | 34 | 40 | 30 | 24 | 24 | 20 | 15 | 15 | 14 | 17 | 20 | 26 | 31 | 28 | 36 | 31 | 20 | 20 | 17 | 13 | 14 | 16 | 18 | 23 | 25 | 33 | 35 | 41 | 24 | 19 | 14 | 11 | 16 | 17 | 20 | 28 | 37 |
| pm10 | 11 | 17 | 18 | 14 | 13 | 13 | 15 | 11 | 11 | 12 | 10 | 15 | - | - | - | - | - | - | - | - | - | - | - | - | - | - | - | - | - | - | - | - | - | - | - | - | - | - | - | - | - | - | - | - | - | - | - | - | - | - | - | - |