Air Pollution in Oxfordshire: Real-time Air Quality Index and smog alert.
Pollution and air quality forecast for Oxfordshire. Today is Thursday, June 18, 2026. The following air pollution values have been recorded for Oxfordshire:- nitrogen dioxide (NO2) - 2 (Good)
- particulate matter (PM10) suspended dust - 7 (Good)
- particulate matter (PM2.5) dust - 3 (Good)

What is the air quality in Oxfordshire today? Is the air polluted in Oxfordshire?. Is there smog?
How high is the level of NO2? (nitrogen dioxide (NO2))
2 (Good)
What is the level of PM10 today in Oxfordshire? (particulate matter (PM10) suspended dust)
The current level of particulate matter PM10 in Oxfordshire is:
7 (Good)
The highest PM10 values usually occur in month: 33 (April 2019).
The lowest value of particulate matter PM10 pollution in Oxfordshire is usually recorded in: August (7.1).
What is the current level of PM2.5 in Oxfordshire? (particulate matter (PM2.5) dust)
Today's PM2.5 level is:
3 (Good)
For comparison, the highest level of PM2.5 in Oxfordshire in the last 7 days was: 4 (Saturday, April 13, 2024) and the lowest: 1 (Thursday, April 11, 2024).
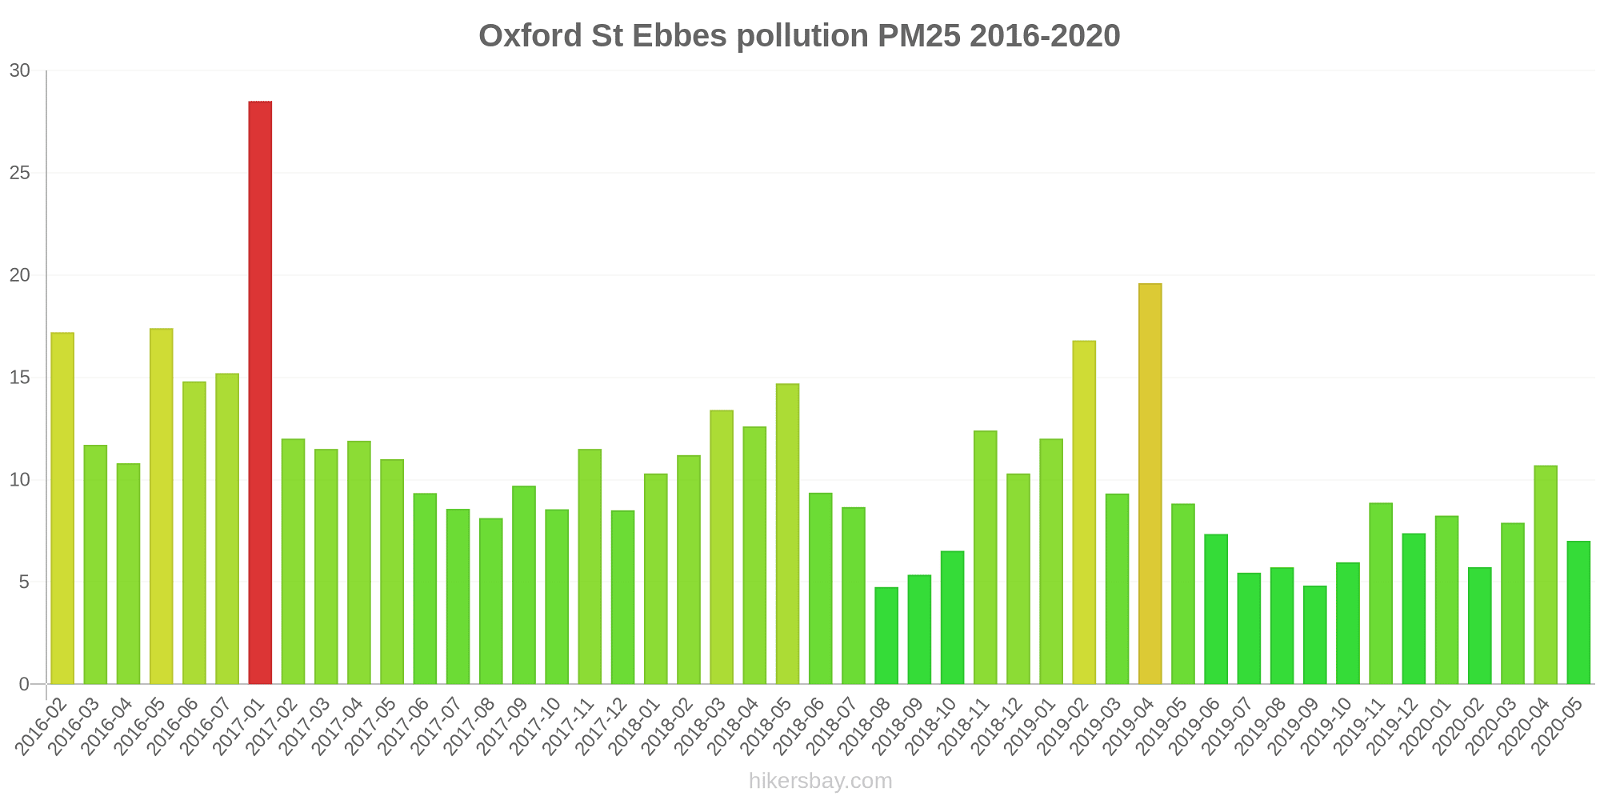
The highest PM2.5 values were recorded: 29 (January 2017).
The lowest level of particulate matter PM2.5 pollution occurs in month: August (4.8).
Current data Tuesday, April 16, 2024, 1:00 AM
NO2 2 (Good)
PM10 7 (Good)
PM2,5 3 (Good)
Data on air pollution from recent days in Oxfordshire
index
2024-04-10
2024-04-11
2024-04-12
2024-04-13
2024-04-14
2024-04-15
2024-04-16
no2
7
Good
14
Good
15
Good
14
Good
9
Good
6
Good
2
Good
pm25
-
Good
1
Good
3
Good
4
Good
4
Good
3
Good
3
Good
pm10
-
Good
2
Good
5
Good
7
Good
7
Good
7
Good
7
Good
data source »
Air pollution in Oxfordshire from February 2016 to May 2020

index
2020-05
2020-04
2020-03
2020-02
2020-01
2019-12
2019-11
2019-10
2019-09
2019-08
2019-07
2019-06
2019-05
2019-04
2019-03
2019-02
2019-01
2018-12
2018-11
2018-10
2018-09
2018-08
2018-07
2018-06
2018-05
2018-04
2018-03
2018-02
2018-01
2017-12
2017-11
2017-10
2017-09
2017-08
2017-07
2017-06
2017-05
2017-04
2017-03
2017-02
2017-01
2016-12
2016-11
2016-10
2016-09
2016-08
2016-07
2016-06
2016-05
2016-04
2016-03
2016-02
no2
14 (Good)
12 (Good)
20 (Good)
18 (Good)
27 (Good)
28 (Good)
35 (Good)
27 (Good)
24 (Good)
19 (Good)
22 (Good)
26 (Good)
26 (Good)
32 (Good)
22 (Good)
39 (Good)
30 (Good)
25 (Good)
30 (Good)
24 (Good)
21 (Good)
18 (Good)
23 (Good)
20 (Good)
24 (Good)
25 (Good)
26 (Good)
29 (Good)
26 (Good)
25 (Good)
28 (Good)
23 (Good)
25 (Good)
24 (Good)
19 (Good)
22 (Good)
27 (Good)
29 (Good)
26 (Good)
29 (Good)
37 (Good)
37 (Good)
38 (Good)
37 (Good)
33 (Good)
24 (Good)
17 (Good)
26 (Good)
33 (Good)
31 (Good)
33 (Good)
19 (Good)
pm25
7 (Good)
11 (Good)
7.9 (Good)
5.7 (Good)
8.2 (Good)
7.4 (Good)
8.9 (Good)
6 (Good)
4.8 (Good)
5.7 (Good)
5.5 (Good)
7.3 (Good)
8.8 (Good)
20 (Moderate)
9.3 (Good)
17 (Moderate)
12 (Good)
10 (Good)
12 (Good)
6.5 (Good)
5.3 (Good)
4.8 (Good)
8.7 (Good)
9.4 (Good)
15 (Moderate)
13 (Good)
13 (Moderate)
11 (Good)
10 (Good)
8.5 (Good)
12 (Good)
8.6 (Good)
9.7 (Good)
8.1 (Good)
8.6 (Good)
9.3 (Good)
11 (Good)
12 (Good)
12 (Good)
12 (Good)
29 (Moderate)
- (Good)
- (Good)
- (Good)
- (Good)
- (Good)
15 (Moderate)
15 (Moderate)
17 (Moderate)
11 (Good)
12 (Good)
17 (Moderate)
pm10
11 (Good)
16 (Good)
12 (Good)
9.8 (Good)
12 (Good)
10 (Good)
12 (Good)
10 (Good)
9.4 (Good)
11 (Good)
11 (Good)
12 (Good)
14 (Good)
33 (Moderate)
18 (Good)
23 (Moderate)
17 (Good)
13 (Good)
13 (Good)
11 (Good)
8.4 (Good)
7.1 (Good)
12 (Good)
11 (Good)
17 (Good)
14 (Good)
16 (Good)
13 (Good)
13 (Good)
9.8 (Good)
12 (Good)
11 (Good)
11 (Good)
9.9 (Good)
10 (Good)
11 (Good)
13 (Good)
15 (Good)
14 (Good)
15 (Good)
32 (Moderate)
- (Good)
- (Good)
- (Good)
- (Good)
18 (Good)
13 (Good)
13 (Good)
17 (Good)
12 (Good)
16 (Good)
20 (Moderate)
data source »
Quality of life in Oxfordshire
Green and Parks in the City
Oxfordshire
88%
Isle of Man: 78%
Ireland: 72%
Netherlands: 82%
Belgium: 64%
Faroe Islands: 87%
particulate matter PM2.5
Oxfordshire
10 (Good)
Pleasure of spending time in the city
Oxfordshire
83%
Isle of Man: 83%
Ireland: 78%
Netherlands: 88%
Belgium: 64%
Faroe Islands: 100%
particulate matter PM10
Oxfordshire
15 (Good)
Air Pollution
Oxfordshire
20%
Isle of Man: 13%
Ireland: 24%
Netherlands: 21%
Belgium: 45%
Faroe Islands: 0%
Garbage Disposal
Oxfordshire
68%
Isle of Man: 78%
Ireland: 61%
Netherlands: 79%
Belgium: 54%
Faroe Islands: 88%
Availability and quality of drinking water
Oxfordshire
79%
Isle of Man: 88%
Ireland: 72%
Netherlands: 92%
Belgium: 70%
Faroe Islands: 98%
Cleanliness and tidiness
Oxfordshire
70%
Isle of Man: 69%
Ireland: 52%
Netherlands: 77%
Belgium: 46%
Faroe Islands: 94%
Noise and Light pollution
Oxfordshire
33%
Isle of Man: 12%
Ireland: 37%
Netherlands: 31%
Belgium: 54%
Faroe Islands: 21%
Water Pollution
Oxfordshire
22%
Isle of Man: 13%
Ireland: 37%
Netherlands: 17%
Belgium: 42%
Faroe Islands: 7.7%
Source: Numbeo
Oxford Centre Roadside
Tuesday, April 16, 2024, 12:00 AM
NO2 2 (Good)
nitrogen dioxide (NO2)
Oxford St Ebbes
Tuesday, April 16, 2024, 1:00 AM
PM10 7 (Good)
particulate matter (PM10) suspended dust
PM2,5 3 (Good)
particulate matter (PM2.5) dust
Oxford Centre Roadside
index
2024-04-16
2024-04-15
2024-04-14
2024-04-13
2024-04-12
2024-04-11
2024-04-10
no2
2
5.7
9
14
15
14
6.5
Oxford St Ebbes
index
2024-04-16
2024-04-15
2024-04-14
2024-04-13
2024-04-12
2024-04-11
pm25
3
3.1
4.4
4.4
3.3
1.4
pm10
7
6.8
7
7
5.1
2.4
Oxford Centre Roadside
index
2020-05
2020-04
2020-03
2020-02
2020-01
2019-12
2019-11
2019-10
2019-09
2019-08
2019-07
2019-06
2019-05
2019-04
2019-03
2019-02
2019-01
2018-12
2018-11
2018-10
2018-09
2018-08
2018-07
2018-06
2018-05
2018-04
2018-03
2018-02
2018-01
2017-12
2017-11
2017-10
2017-09
2017-08
2017-07
2017-06
2017-05
2017-04
2017-03
2017-02
2017-01
2016-12
2016-11
2016-10
2016-09
2016-08
2016-07
2016-06
2016-05
2016-04
2016-03
no2
18
15
29
27
37
39
49
40
35
29
29
39
38
49
32
56
42
36
44
36
31
26
38
34
37
39
38
41
36
33
39
35
38
35
30
36
44
42
40
42
49
53
57
57
52
38
27
41
51
46
44
Oxford St Ebbes
2016-02 2020-05
index
2020-05
2020-04
2020-03
2020-02
2020-01
2019-12
2019-11
2019-10
2019-09
2019-08
2019-07
2019-06
2019-05
2019-04
2019-03
2019-02
2019-01
2018-12
2018-11
2018-10
2018-09
2018-08
2018-07
2018-06
2018-05
2018-04
2018-03
2018-02
2018-01
2017-12
2017-11
2017-10
2017-09
2017-08
2017-07
2017-06
2017-05
2017-04
2017-03
2017-02
2017-01
2016-12
2016-11
2016-10
2016-09
2016-08
2016-07
2016-06
2016-05
2016-04
2016-03
2016-02
pm25
7
11
7.9
5.7
8.2
7.4
8.9
6
4.8
5.7
5.5
7.3
8.8
20
9.3
17
12
10
12
6.5
5.3
4.8
8.7
9.4
15
13
13
11
10
8.5
12
8.6
9.7
8.1
8.6
9.3
11
12
12
12
29
-
-
-
-
-
15
15
17
11
12
17
no2
10
9.4
11
10
16
17
21
13
12
10
14
13
15
15
11
21
18
14
15
12
11
9
7.7
7.2
11
12
14
17
16
18
18
11
12
13
7.5
7.7
10
16
12
17
25
21
19
17
13
10
7.5
11
14
16
22
19
pm10
11
16
12
9.8
12
10
12
10
9.4
11
11
12
14
33
18
23
17
13
13
11
8.4
7.1
12
11
17
14
16
13
13
9.8
12
11
11
9.9
10
11
13
15
14
15
32
-
-
-
-
18
13
13
17
12
16
20
* Pollution data source:
https://openaq.org
(DEFRA)
The data is licensed under CC-By 4.0
NO2 2 (Good)
PM10 7 (Good)
PM2,5 3 (Good)
Data on air pollution from recent days in Oxfordshire
| index | 2024-04-10 | 2024-04-11 | 2024-04-12 | 2024-04-13 | 2024-04-14 | 2024-04-15 | 2024-04-16 |
|---|---|---|---|---|---|---|---|
| no2 | 7 Good |
14 Good |
15 Good |
14 Good |
9 Good |
6 Good |
2 Good |
| pm25 | - Good |
1 Good |
3 Good |
4 Good |
4 Good |
3 Good |
3 Good |
| pm10 | - Good |
2 Good |
5 Good |
7 Good |
7 Good |
7 Good |
7 Good |

| index | 2020-05 | 2020-04 | 2020-03 | 2020-02 | 2020-01 | 2019-12 | 2019-11 | 2019-10 | 2019-09 | 2019-08 | 2019-07 | 2019-06 | 2019-05 | 2019-04 | 2019-03 | 2019-02 | 2019-01 | 2018-12 | 2018-11 | 2018-10 | 2018-09 | 2018-08 | 2018-07 | 2018-06 | 2018-05 | 2018-04 | 2018-03 | 2018-02 | 2018-01 | 2017-12 | 2017-11 | 2017-10 | 2017-09 | 2017-08 | 2017-07 | 2017-06 | 2017-05 | 2017-04 | 2017-03 | 2017-02 | 2017-01 | 2016-12 | 2016-11 | 2016-10 | 2016-09 | 2016-08 | 2016-07 | 2016-06 | 2016-05 | 2016-04 | 2016-03 | 2016-02 |
|---|---|---|---|---|---|---|---|---|---|---|---|---|---|---|---|---|---|---|---|---|---|---|---|---|---|---|---|---|---|---|---|---|---|---|---|---|---|---|---|---|---|---|---|---|---|---|---|---|---|---|---|---|
| no2 | 14 (Good) | 12 (Good) | 20 (Good) | 18 (Good) | 27 (Good) | 28 (Good) | 35 (Good) | 27 (Good) | 24 (Good) | 19 (Good) | 22 (Good) | 26 (Good) | 26 (Good) | 32 (Good) | 22 (Good) | 39 (Good) | 30 (Good) | 25 (Good) | 30 (Good) | 24 (Good) | 21 (Good) | 18 (Good) | 23 (Good) | 20 (Good) | 24 (Good) | 25 (Good) | 26 (Good) | 29 (Good) | 26 (Good) | 25 (Good) | 28 (Good) | 23 (Good) | 25 (Good) | 24 (Good) | 19 (Good) | 22 (Good) | 27 (Good) | 29 (Good) | 26 (Good) | 29 (Good) | 37 (Good) | 37 (Good) | 38 (Good) | 37 (Good) | 33 (Good) | 24 (Good) | 17 (Good) | 26 (Good) | 33 (Good) | 31 (Good) | 33 (Good) | 19 (Good) |
| pm25 | 7 (Good) | 11 (Good) | 7.9 (Good) | 5.7 (Good) | 8.2 (Good) | 7.4 (Good) | 8.9 (Good) | 6 (Good) | 4.8 (Good) | 5.7 (Good) | 5.5 (Good) | 7.3 (Good) | 8.8 (Good) | 20 (Moderate) | 9.3 (Good) | 17 (Moderate) | 12 (Good) | 10 (Good) | 12 (Good) | 6.5 (Good) | 5.3 (Good) | 4.8 (Good) | 8.7 (Good) | 9.4 (Good) | 15 (Moderate) | 13 (Good) | 13 (Moderate) | 11 (Good) | 10 (Good) | 8.5 (Good) | 12 (Good) | 8.6 (Good) | 9.7 (Good) | 8.1 (Good) | 8.6 (Good) | 9.3 (Good) | 11 (Good) | 12 (Good) | 12 (Good) | 12 (Good) | 29 (Moderate) | - (Good) | - (Good) | - (Good) | - (Good) | - (Good) | 15 (Moderate) | 15 (Moderate) | 17 (Moderate) | 11 (Good) | 12 (Good) | 17 (Moderate) |
| pm10 | 11 (Good) | 16 (Good) | 12 (Good) | 9.8 (Good) | 12 (Good) | 10 (Good) | 12 (Good) | 10 (Good) | 9.4 (Good) | 11 (Good) | 11 (Good) | 12 (Good) | 14 (Good) | 33 (Moderate) | 18 (Good) | 23 (Moderate) | 17 (Good) | 13 (Good) | 13 (Good) | 11 (Good) | 8.4 (Good) | 7.1 (Good) | 12 (Good) | 11 (Good) | 17 (Good) | 14 (Good) | 16 (Good) | 13 (Good) | 13 (Good) | 9.8 (Good) | 12 (Good) | 11 (Good) | 11 (Good) | 9.9 (Good) | 10 (Good) | 11 (Good) | 13 (Good) | 15 (Good) | 14 (Good) | 15 (Good) | 32 (Moderate) | - (Good) | - (Good) | - (Good) | - (Good) | 18 (Good) | 13 (Good) | 13 (Good) | 17 (Good) | 12 (Good) | 16 (Good) | 20 (Moderate) |
Green and Parks in the City
Oxfordshire 88%
Isle of Man: 78% Ireland: 72% Netherlands: 82% Belgium: 64% Faroe Islands: 87%particulate matter PM2.5
Oxfordshire 10 (Good)
Pleasure of spending time in the city
Oxfordshire 83%
Isle of Man: 83% Ireland: 78% Netherlands: 88% Belgium: 64% Faroe Islands: 100%particulate matter PM10
Oxfordshire 15 (Good)
Air Pollution
Oxfordshire 20%
Isle of Man: 13% Ireland: 24% Netherlands: 21% Belgium: 45% Faroe Islands: 0%Garbage Disposal
Oxfordshire 68%
Isle of Man: 78% Ireland: 61% Netherlands: 79% Belgium: 54% Faroe Islands: 88%Availability and quality of drinking water
Oxfordshire 79%
Isle of Man: 88% Ireland: 72% Netherlands: 92% Belgium: 70% Faroe Islands: 98%Cleanliness and tidiness
Oxfordshire 70%
Isle of Man: 69% Ireland: 52% Netherlands: 77% Belgium: 46% Faroe Islands: 94%Noise and Light pollution
Oxfordshire 33%
Isle of Man: 12% Ireland: 37% Netherlands: 31% Belgium: 54% Faroe Islands: 21%Water Pollution
Oxfordshire 22%
Isle of Man: 13% Ireland: 37% Netherlands: 17% Belgium: 42% Faroe Islands: 7.7%NO2 2 (Good)
nitrogen dioxide (NO2)PM10 7 (Good)
particulate matter (PM10) suspended dustPM2,5 3 (Good)
particulate matter (PM2.5) dustOxford Centre Roadside
| index | 2024-04-16 | 2024-04-15 | 2024-04-14 | 2024-04-13 | 2024-04-12 | 2024-04-11 | 2024-04-10 |
|---|---|---|---|---|---|---|---|
| no2 | 2 | 5.7 | 9 | 14 | 15 | 14 | 6.5 |
Oxford St Ebbes
| index | 2024-04-16 | 2024-04-15 | 2024-04-14 | 2024-04-13 | 2024-04-12 | 2024-04-11 |
|---|---|---|---|---|---|---|
| pm25 | 3 | 3.1 | 4.4 | 4.4 | 3.3 | 1.4 |
| pm10 | 7 | 6.8 | 7 | 7 | 5.1 | 2.4 |
Oxford Centre Roadside
| index | 2020-05 | 2020-04 | 2020-03 | 2020-02 | 2020-01 | 2019-12 | 2019-11 | 2019-10 | 2019-09 | 2019-08 | 2019-07 | 2019-06 | 2019-05 | 2019-04 | 2019-03 | 2019-02 | 2019-01 | 2018-12 | 2018-11 | 2018-10 | 2018-09 | 2018-08 | 2018-07 | 2018-06 | 2018-05 | 2018-04 | 2018-03 | 2018-02 | 2018-01 | 2017-12 | 2017-11 | 2017-10 | 2017-09 | 2017-08 | 2017-07 | 2017-06 | 2017-05 | 2017-04 | 2017-03 | 2017-02 | 2017-01 | 2016-12 | 2016-11 | 2016-10 | 2016-09 | 2016-08 | 2016-07 | 2016-06 | 2016-05 | 2016-04 | 2016-03 |
|---|---|---|---|---|---|---|---|---|---|---|---|---|---|---|---|---|---|---|---|---|---|---|---|---|---|---|---|---|---|---|---|---|---|---|---|---|---|---|---|---|---|---|---|---|---|---|---|---|---|---|---|
| no2 | 18 | 15 | 29 | 27 | 37 | 39 | 49 | 40 | 35 | 29 | 29 | 39 | 38 | 49 | 32 | 56 | 42 | 36 | 44 | 36 | 31 | 26 | 38 | 34 | 37 | 39 | 38 | 41 | 36 | 33 | 39 | 35 | 38 | 35 | 30 | 36 | 44 | 42 | 40 | 42 | 49 | 53 | 57 | 57 | 52 | 38 | 27 | 41 | 51 | 46 | 44 |
Oxford St Ebbes

| index | 2020-05 | 2020-04 | 2020-03 | 2020-02 | 2020-01 | 2019-12 | 2019-11 | 2019-10 | 2019-09 | 2019-08 | 2019-07 | 2019-06 | 2019-05 | 2019-04 | 2019-03 | 2019-02 | 2019-01 | 2018-12 | 2018-11 | 2018-10 | 2018-09 | 2018-08 | 2018-07 | 2018-06 | 2018-05 | 2018-04 | 2018-03 | 2018-02 | 2018-01 | 2017-12 | 2017-11 | 2017-10 | 2017-09 | 2017-08 | 2017-07 | 2017-06 | 2017-05 | 2017-04 | 2017-03 | 2017-02 | 2017-01 | 2016-12 | 2016-11 | 2016-10 | 2016-09 | 2016-08 | 2016-07 | 2016-06 | 2016-05 | 2016-04 | 2016-03 | 2016-02 |
|---|---|---|---|---|---|---|---|---|---|---|---|---|---|---|---|---|---|---|---|---|---|---|---|---|---|---|---|---|---|---|---|---|---|---|---|---|---|---|---|---|---|---|---|---|---|---|---|---|---|---|---|---|
| pm25 | 7 | 11 | 7.9 | 5.7 | 8.2 | 7.4 | 8.9 | 6 | 4.8 | 5.7 | 5.5 | 7.3 | 8.8 | 20 | 9.3 | 17 | 12 | 10 | 12 | 6.5 | 5.3 | 4.8 | 8.7 | 9.4 | 15 | 13 | 13 | 11 | 10 | 8.5 | 12 | 8.6 | 9.7 | 8.1 | 8.6 | 9.3 | 11 | 12 | 12 | 12 | 29 | - | - | - | - | - | 15 | 15 | 17 | 11 | 12 | 17 |
| no2 | 10 | 9.4 | 11 | 10 | 16 | 17 | 21 | 13 | 12 | 10 | 14 | 13 | 15 | 15 | 11 | 21 | 18 | 14 | 15 | 12 | 11 | 9 | 7.7 | 7.2 | 11 | 12 | 14 | 17 | 16 | 18 | 18 | 11 | 12 | 13 | 7.5 | 7.7 | 10 | 16 | 12 | 17 | 25 | 21 | 19 | 17 | 13 | 10 | 7.5 | 11 | 14 | 16 | 22 | 19 |
| pm10 | 11 | 16 | 12 | 9.8 | 12 | 10 | 12 | 10 | 9.4 | 11 | 11 | 12 | 14 | 33 | 18 | 23 | 17 | 13 | 13 | 11 | 8.4 | 7.1 | 12 | 11 | 17 | 14 | 16 | 13 | 13 | 9.8 | 12 | 11 | 11 | 9.9 | 10 | 11 | 13 | 15 | 14 | 15 | 32 | - | - | - | - | 18 | 13 | 13 | 17 | 12 | 16 | 20 |