Air Pollution in Ontinyent: Real-time Air Quality Index and smog alert.
Pollution and air quality forecast for Ontinyent. Today is Wednesday, June 24, 2026. The following air pollution values have been recorded for Ontinyent:- particulate matter (PM10) suspended dust - 3 (Good)
- particulate matter (PM2.5) dust - 2 (Good)
- ozone (O3) - 86 (Moderate)
- carbon monoxide (CO) - 100 (Good)
- sulfur dioxide (SO2) - 3 (Good)
- nitrogen dioxide (NO2) - 1 (Good)

What is the air quality in Ontinyent today? Is the air polluted in Ontinyent?. Is there smog?
What is the level of PM10 today in Ontinyent? (particulate matter (PM10) suspended dust)
The current level of particulate matter PM10 in Ontinyent is:
3 (Good)
The highest PM10 values usually occur in month: 23 (February 2019).
The lowest value of particulate matter PM10 pollution in Ontinyent is usually recorded in: November (0.18).
What is the current level of PM2.5 in Ontinyent? (particulate matter (PM2.5) dust)
Today's PM2.5 level is:
2 (Good)
For comparison, the highest level of PM2.5 in Ontinyent in the last 7 days was: 3 (Sunday, January 14, 2024) and the lowest: 1 (Thursday, January 11, 2024).
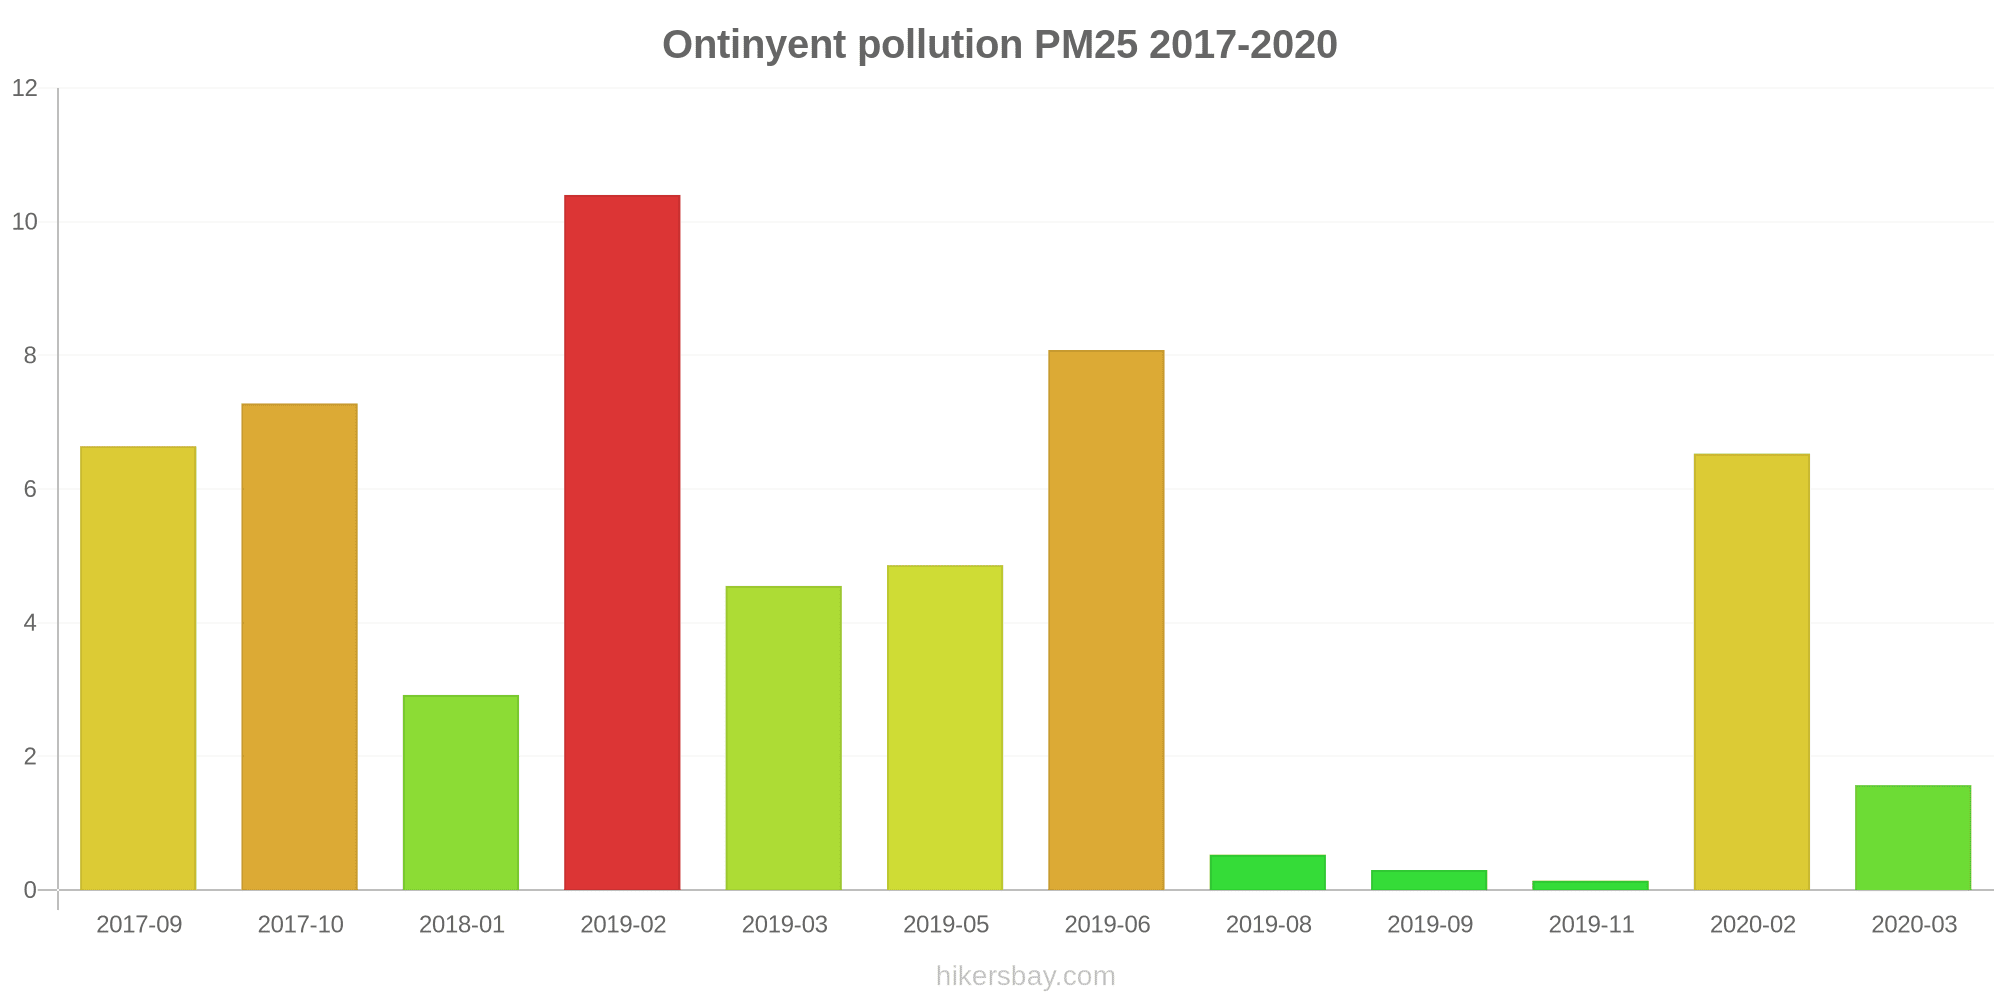
The highest PM2.5 values were recorded: 10 (February 2019).
The lowest level of particulate matter PM2.5 pollution occurs in month: November (0.14).
How is the O3 level today in Ontinyent? (ozone (O3))
86 (Moderate)
How high is the CO level? (carbon monoxide (CO))
100 (Good)
What is the level of SO2 pollution? (sulfur dioxide (SO2))
3 (Good)
How high is the level of NO2? (nitrogen dioxide (NO2))
1 (Good)
Current data Wednesday, January 17, 2024, 9:00 AM
PM10 3 (Good)
PM2,5 2 (Good)
O3 86 (Moderate)
CO 100 (Good)
SO2 3 (Good)
NO2 1 (Good)
1 (Good)
Data on air pollution from recent days in Ontinyent
index
2024-01-10
2024-01-11
2024-01-12
2024-01-13
2024-01-14
2024-01-15
2024-01-16
2024-01-17
no2
1
Good
2
Good
1
Good
2
Good
1
Good
1
Good
1
Good
1
Good
pm10
2
Good
2
Good
2
Good
3
Good
9
Good
4
Good
5
Good
4
Good
so2
3
Good
4
Good
3
Good
3
Good
3
Good
3
Good
3
Good
3
Good
co
100
Good
100
Good
100
Good
100
Good
100
Good
100
Good
100
Good
100
Good
o3
52
Good
54
Good
54
Good
52
Good
62
Good
64
Good
70
Moderate
78
Moderate
pm25
2
Good
1
Good
1
Good
2
Good
3
Good
2
Good
2
Good
2
Good
no
-
Good
-
Good
-
Good
-
Good
-
Good
1
Good
1
Good
-
Good
data source »
Air pollution in Ontinyent from September 2017 to May 2020

index
2020-05
2020-04
2020-03
2020-02
2020-01
2019-12
2019-11
2019-10
2019-09
2019-08
2019-07
2019-06
2019-05
2019-04
2019-03
2019-02
2019-01
2018-01
2017-11
2017-10
2017-09
o3
69 (Good)
74 (Moderate)
69 (Good)
67 (Good)
58 (Good)
15 (Good)
5.7 (Good)
14 (Good)
17 (Good)
3.4 (Good)
14 (Good)
79 (Moderate)
78 (Moderate)
81 (Moderate)
87 (Moderate)
80 (Moderate)
66 (Good)
62 (Good)
60 (Good)
74 (Moderate)
84 (Moderate)
co
- (Good)
- (Good)
100 (Good)
100 (Good)
- (Good)
- (Good)
5.9 (Good)
- (Good)
5.2 (Good)
5.6 (Good)
- (Good)
100 (Good)
100 (Good)
- (Good)
102 (Good)
100 (Good)
- (Good)
101 (Good)
- (Good)
124 (Good)
162 (Good)
pm25
- (Good)
- (Good)
1.6 (Good)
6.5 (Good)
- (Good)
- (Good)
0.14 (Good)
- (Good)
0.3 (Good)
0.53 (Good)
- (Good)
8.1 (Good)
4.9 (Good)
- (Good)
4.5 (Good)
10 (Good)
- (Good)
2.9 (Good)
- (Good)
7.3 (Good)
6.6 (Good)
pm10
- (Good)
- (Good)
3.4 (Good)
7.9 (Good)
- (Good)
- (Good)
0.18 (Good)
- (Good)
0.59 (Good)
1.3 (Good)
- (Good)
19 (Good)
13 (Good)
- (Good)
15 (Good)
23 (Moderate)
- (Good)
4.7 (Good)
- (Good)
17 (Good)
15 (Good)
so2
- (Good)
- (Good)
3 (Good)
3.9 (Good)
- (Good)
- (Good)
- (Good)
- (Good)
- (Good)
- (Good)
- (Good)
- (Good)
- (Good)
- (Good)
- (Good)
- (Good)
- (Good)
3.1 (Good)
- (Good)
3.3 (Good)
3.5 (Good)
no2
- (Good)
- (Good)
1.1 (Good)
5.2 (Good)
- (Good)
- (Good)
0.13 (Good)
- (Good)
0.04 (Good)
0.09 (Good)
- (Good)
5.1 (Good)
3.9 (Good)
- (Good)
2.4 (Good)
4.3 (Good)
- (Good)
2.4 (Good)
- (Good)
3.1 (Good)
4.1 (Good)
data source »
Quality of life in Ontinyent
Green and Parks in the City
Ontinyent
50%
Andorra: 69%
France: 61%
Italy: 53%
Switzerland: 76%
San Marino: 75%
particulate matter PM2.5
Ontinyent
7 (Good)
Pleasure of spending time in the city
Ontinyent
67%
Andorra: 84%
France: 68%
Italy: 56%
Switzerland: 84%
San Marino: 100%
particulate matter PM10
Ontinyent
12 (Good)
Air Pollution
Ontinyent
15%
Andorra: 29%
France: 36%
Italy: 50%
Switzerland: 20%
San Marino: 6.8%
Garbage Disposal
Ontinyent
25%
Andorra: 89%
France: 59%
Italy: 51%
Switzerland: 82%
Availability and quality of drinking water
Ontinyent
25%
Andorra: 100%
France: 73%
Italy: 69%
Switzerland: 90%
San Marino: 100%
Cleanliness and tidiness
Ontinyent
0%
Andorra: 75%
France: 48%
Italy: 45%
Switzerland: 82%
San Marino: 75%
Noise and Light pollution
Ontinyent
100%
Andorra: 29%
France: 54%
Italy: 48%
Switzerland: 38%
San Marino: 75%
Water Pollution
Ontinyent
50%
Andorra: 19%
France: 39%
Italy: 41%
Switzerland: 19%
San Marino: 0%
Source: Numbeo
ONTINYENT
Wednesday, January 17, 2024, 9:00 AM
PM10 3 (Good)
particulate matter (PM10) suspended dust
PM2,5 2 (Good)
particulate matter (PM2.5) dust
O3 86 (Moderate)
ozone (O3)
CO 100 (Good)
carbon monoxide (CO)
SO2 3 (Good)
sulfur dioxide (SO2)
NO2 1 (Good)
nitrogen dioxide (NO2)
1 (Good)
index_name_no
ONTINYENT
index
2024-01-17
2024-01-16
2024-01-15
2024-01-14
2024-01-13
2024-01-12
2024-01-11
2024-01-10
no2
1
1.2
1
1.2
1.6
1.3
1.6
1.2
pm10
3.7
5
4.3
8.8
2.7
1.8
1.9
2
so2
3
3
3
3
3
3
4
3
co
100
100
100
100
100
100
100
100
o3
78
70
64
62
52
54
54
52
pm25
1.6
2
1.8
3.1
2.3
1.5
1.5
1.7
no
-
1
1
-
-
-
-
-
ES1711A
2017-09 2020-05

index
2020-05
2020-04
2020-03
2020-02
2020-01
2019-12
2019-11
2019-10
2019-09
2019-08
2019-07
2019-06
2019-05
2019-04
2019-03
2019-02
2019-01
2018-01
2017-11
2017-10
2017-09
pm25
-
-
1.6
6.5
-
-
0.14
-
0.3
0.53
-
8.1
4.9
-
4.5
10
-
2.9
-
7.3
6.6
pm10
-
-
3.4
7.9
-
-
0.18
-
0.59
1.3
-
19
13
-
15
23
-
4.7
-
17
15
co
-
-
100
100
-
-
5.9
-
5.2
5.6
-
100
100
-
102
100
-
101
-
124
162
so2
-
-
3
3.9
-
-
-
-
-
-
-
-
-
-
-
-
-
3.1
-
3.3
3.5
no2
-
-
1.1
5.2
-
-
0.13
-
0.04
0.09
-
5.1
3.9
-
2.4
4.3
-
2.4
-
3.1
4.1
o3
69
74
69
67
58
15
5.7
14
17
3.4
14
79
78
81
87
80
66
62
60
74
84
* Pollution data source:
https://openaq.org
(EEA Spain)
The data is licensed under CC-By 4.0
PM10 3 (Good)
PM2,5 2 (Good)
O3 86 (Moderate)
CO 100 (Good)
SO2 3 (Good)
NO2 1 (Good)
1 (Good)
Data on air pollution from recent days in Ontinyent
| index | 2024-01-10 | 2024-01-11 | 2024-01-12 | 2024-01-13 | 2024-01-14 | 2024-01-15 | 2024-01-16 | 2024-01-17 |
|---|---|---|---|---|---|---|---|---|
| no2 | 1 Good |
2 Good |
1 Good |
2 Good |
1 Good |
1 Good |
1 Good |
1 Good |
| pm10 | 2 Good |
2 Good |
2 Good |
3 Good |
9 Good |
4 Good |
5 Good |
4 Good |
| so2 | 3 Good |
4 Good |
3 Good |
3 Good |
3 Good |
3 Good |
3 Good |
3 Good |
| co | 100 Good |
100 Good |
100 Good |
100 Good |
100 Good |
100 Good |
100 Good |
100 Good |
| o3 | 52 Good |
54 Good |
54 Good |
52 Good |
62 Good |
64 Good |
70 Moderate |
78 Moderate |
| pm25 | 2 Good |
1 Good |
1 Good |
2 Good |
3 Good |
2 Good |
2 Good |
2 Good |
| no | - Good |
- Good |
- Good |
- Good |
- Good |
1 Good |
1 Good |
- Good |
| index | 2020-05 | 2020-04 | 2020-03 | 2020-02 | 2020-01 | 2019-12 | 2019-11 | 2019-10 | 2019-09 | 2019-08 | 2019-07 | 2019-06 | 2019-05 | 2019-04 | 2019-03 | 2019-02 | 2019-01 | 2018-01 | 2017-11 | 2017-10 | 2017-09 |
|---|---|---|---|---|---|---|---|---|---|---|---|---|---|---|---|---|---|---|---|---|---|
| o3 | 69 (Good) | 74 (Moderate) | 69 (Good) | 67 (Good) | 58 (Good) | 15 (Good) | 5.7 (Good) | 14 (Good) | 17 (Good) | 3.4 (Good) | 14 (Good) | 79 (Moderate) | 78 (Moderate) | 81 (Moderate) | 87 (Moderate) | 80 (Moderate) | 66 (Good) | 62 (Good) | 60 (Good) | 74 (Moderate) | 84 (Moderate) |
| co | - (Good) | - (Good) | 100 (Good) | 100 (Good) | - (Good) | - (Good) | 5.9 (Good) | - (Good) | 5.2 (Good) | 5.6 (Good) | - (Good) | 100 (Good) | 100 (Good) | - (Good) | 102 (Good) | 100 (Good) | - (Good) | 101 (Good) | - (Good) | 124 (Good) | 162 (Good) |
| pm25 | - (Good) | - (Good) | 1.6 (Good) | 6.5 (Good) | - (Good) | - (Good) | 0.14 (Good) | - (Good) | 0.3 (Good) | 0.53 (Good) | - (Good) | 8.1 (Good) | 4.9 (Good) | - (Good) | 4.5 (Good) | 10 (Good) | - (Good) | 2.9 (Good) | - (Good) | 7.3 (Good) | 6.6 (Good) |
| pm10 | - (Good) | - (Good) | 3.4 (Good) | 7.9 (Good) | - (Good) | - (Good) | 0.18 (Good) | - (Good) | 0.59 (Good) | 1.3 (Good) | - (Good) | 19 (Good) | 13 (Good) | - (Good) | 15 (Good) | 23 (Moderate) | - (Good) | 4.7 (Good) | - (Good) | 17 (Good) | 15 (Good) |
| so2 | - (Good) | - (Good) | 3 (Good) | 3.9 (Good) | - (Good) | - (Good) | - (Good) | - (Good) | - (Good) | - (Good) | - (Good) | - (Good) | - (Good) | - (Good) | - (Good) | - (Good) | - (Good) | 3.1 (Good) | - (Good) | 3.3 (Good) | 3.5 (Good) |
| no2 | - (Good) | - (Good) | 1.1 (Good) | 5.2 (Good) | - (Good) | - (Good) | 0.13 (Good) | - (Good) | 0.04 (Good) | 0.09 (Good) | - (Good) | 5.1 (Good) | 3.9 (Good) | - (Good) | 2.4 (Good) | 4.3 (Good) | - (Good) | 2.4 (Good) | - (Good) | 3.1 (Good) | 4.1 (Good) |
Green and Parks in the City
Ontinyent 50%
Andorra: 69% France: 61% Italy: 53% Switzerland: 76% San Marino: 75%particulate matter PM2.5
Ontinyent 7 (Good)
Pleasure of spending time in the city
Ontinyent 67%
Andorra: 84% France: 68% Italy: 56% Switzerland: 84% San Marino: 100%particulate matter PM10
Ontinyent 12 (Good)
Air Pollution
Ontinyent 15%
Andorra: 29% France: 36% Italy: 50% Switzerland: 20% San Marino: 6.8%Garbage Disposal
Ontinyent 25%
Andorra: 89% France: 59% Italy: 51% Switzerland: 82%Availability and quality of drinking water
Ontinyent 25%
Andorra: 100% France: 73% Italy: 69% Switzerland: 90% San Marino: 100%Cleanliness and tidiness
Ontinyent 0%
Andorra: 75% France: 48% Italy: 45% Switzerland: 82% San Marino: 75%Noise and Light pollution
Ontinyent 100%
Andorra: 29% France: 54% Italy: 48% Switzerland: 38% San Marino: 75%Water Pollution
Ontinyent 50%
Andorra: 19% France: 39% Italy: 41% Switzerland: 19% San Marino: 0%PM10 3 (Good)
particulate matter (PM10) suspended dustPM2,5 2 (Good)
particulate matter (PM2.5) dustO3 86 (Moderate)
ozone (O3)CO 100 (Good)
carbon monoxide (CO)SO2 3 (Good)
sulfur dioxide (SO2)NO2 1 (Good)
nitrogen dioxide (NO2)1 (Good)
index_name_noONTINYENT
| index | 2024-01-17 | 2024-01-16 | 2024-01-15 | 2024-01-14 | 2024-01-13 | 2024-01-12 | 2024-01-11 | 2024-01-10 |
|---|---|---|---|---|---|---|---|---|
| no2 | 1 | 1.2 | 1 | 1.2 | 1.6 | 1.3 | 1.6 | 1.2 |
| pm10 | 3.7 | 5 | 4.3 | 8.8 | 2.7 | 1.8 | 1.9 | 2 |
| so2 | 3 | 3 | 3 | 3 | 3 | 3 | 4 | 3 |
| co | 100 | 100 | 100 | 100 | 100 | 100 | 100 | 100 |
| o3 | 78 | 70 | 64 | 62 | 52 | 54 | 54 | 52 |
| pm25 | 1.6 | 2 | 1.8 | 3.1 | 2.3 | 1.5 | 1.5 | 1.7 |
| no | - | 1 | 1 | - | - | - | - | - |
ES1711A

| index | 2020-05 | 2020-04 | 2020-03 | 2020-02 | 2020-01 | 2019-12 | 2019-11 | 2019-10 | 2019-09 | 2019-08 | 2019-07 | 2019-06 | 2019-05 | 2019-04 | 2019-03 | 2019-02 | 2019-01 | 2018-01 | 2017-11 | 2017-10 | 2017-09 |
|---|---|---|---|---|---|---|---|---|---|---|---|---|---|---|---|---|---|---|---|---|---|
| pm25 | - | - | 1.6 | 6.5 | - | - | 0.14 | - | 0.3 | 0.53 | - | 8.1 | 4.9 | - | 4.5 | 10 | - | 2.9 | - | 7.3 | 6.6 |
| pm10 | - | - | 3.4 | 7.9 | - | - | 0.18 | - | 0.59 | 1.3 | - | 19 | 13 | - | 15 | 23 | - | 4.7 | - | 17 | 15 |
| co | - | - | 100 | 100 | - | - | 5.9 | - | 5.2 | 5.6 | - | 100 | 100 | - | 102 | 100 | - | 101 | - | 124 | 162 |
| so2 | - | - | 3 | 3.9 | - | - | - | - | - | - | - | - | - | - | - | - | - | 3.1 | - | 3.3 | 3.5 |
| no2 | - | - | 1.1 | 5.2 | - | - | 0.13 | - | 0.04 | 0.09 | - | 5.1 | 3.9 | - | 2.4 | 4.3 | - | 2.4 | - | 3.1 | 4.1 |
| o3 | 69 | 74 | 69 | 67 | 58 | 15 | 5.7 | 14 | 17 | 3.4 | 14 | 79 | 78 | 81 | 87 | 80 | 66 | 62 | 60 | 74 | 84 |