Air Pollution in Porsgrunn: Real-time Air Quality Index and smog alert.
Pollution and air quality forecast for Porsgrunn. Today is Tuesday, June 23, 2026. The following air pollution values have been recorded for Porsgrunn:- sulfur dioxide (SO2) - -1 (Good)
- nitrogen dioxide (NO2) - 16 (Good)
- particulate matter (PM10) suspended dust - 29 (Moderate)
- particulate matter (PM2.5) dust - 7 (Good)

What is the air quality in Porsgrunn today? Is the air polluted in Porsgrunn?. Is there smog?
What is the level of SO2 pollution? (sulfur dioxide (SO2))
-1 (Good)
How high is the level of NO2? (nitrogen dioxide (NO2))
16 (Good)
What is the level of PM10 today in Porsgrunn? (particulate matter (PM10) suspended dust)
The current level of particulate matter PM10 in Porsgrunn is:
29 (Moderate)
The highest PM10 values usually occur in month: 30 (April 2019).
The lowest value of particulate matter PM10 pollution in Porsgrunn is usually recorded in: November (8.3).
What is the current level of PM2.5 in Porsgrunn? (particulate matter (PM2.5) dust)
Today's PM2.5 level is:
7 (Good)
For comparison, the highest level of PM2.5 in Porsgrunn in the last 7 days was: 17 (Monday, April 8, 2024) and the lowest: 1 (Sunday, April 14, 2024).
The highest PM2.5 values were recorded: 16 (February 2018).
The lowest level of particulate matter PM2.5 pollution occurs in month: September (3.4).
Current data Monday, April 15, 2024, 8:00 AM
SO2 -1 (Good)
NO2 16 (Good)
PM10 29 (Moderate)
PM2,5 7 (Good)
Data on air pollution from recent days in Porsgrunn
index
2023-05-24
2023-05-25
2023-05-26
2023-05-28
2023-05-29
2023-05-30
2024-04-08
2024-04-09
2024-04-10
2024-04-11
2024-04-12
2024-04-13
2024-04-14
2024-04-15
so2
30
Good
19
Good
20
Good
28
Good
8
Good
-1
Good
-
Good
-
Good
-
Good
-
Good
-
Good
-
Good
-
Good
-
Good
pm25
6
Good
7
Good
3
Good
3
Good
6
Good
3
Good
17
Moderate
8
Good
4
Good
6
Good
9
Good
4
Good
1
Good
3
Good
no2
29
Good
23
Good
25
Good
26
Good
19
Good
5
Good
14
Good
13
Good
9
Good
11
Good
16
Good
10
Good
2
Good
8
Good
pm10
15
Good
16
Good
11
Good
11
Good
12
Good
9
Good
34
Moderate
18
Good
13
Good
19
Good
24
Moderate
11
Good
6
Good
18
Good
data source »
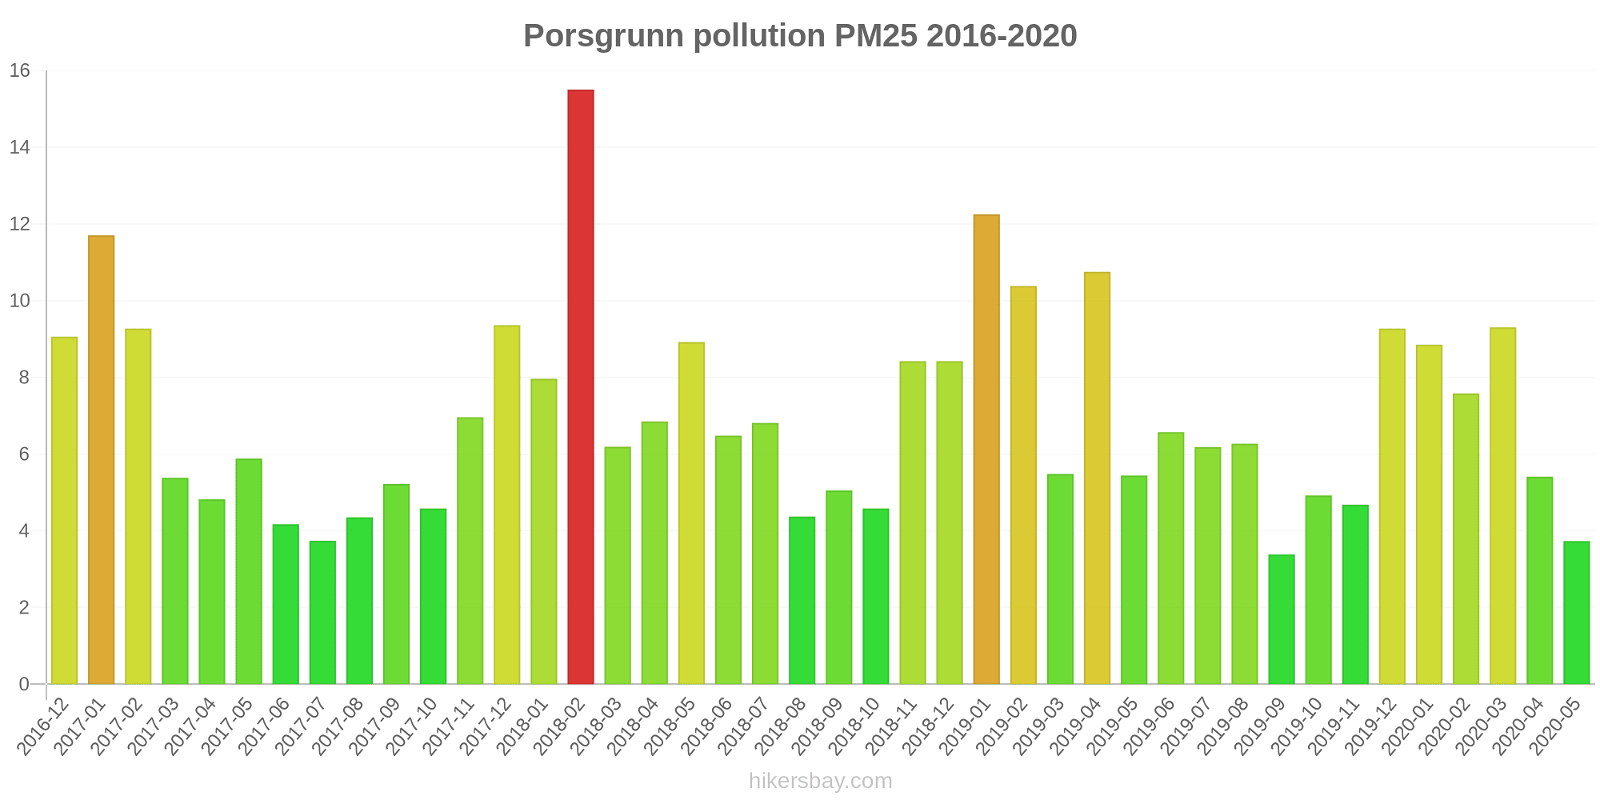
Air pollution in Porsgrunn from December 2016 to May 2020
index
2020-05
2020-04
2020-03
2020-02
2020-01
2019-12
2019-11
2019-10
2019-09
2019-08
2019-07
2019-06
2019-05
2019-04
2019-03
2019-02
2019-01
2018-12
2018-11
2018-10
2018-09
2018-08
2018-07
2018-06
2018-05
2018-04
2018-03
2018-02
2018-01
2017-12
2017-11
2017-10
2017-09
2017-08
2017-07
2017-06
2017-05
2017-04
2017-03
2017-02
2017-01
2016-12
so2
15 (Good)
- (Good)
2.4 (Good)
10 (Good)
6.1 (Good)
4.5 (Good)
6.7 (Good)
3 (Good)
8.9 (Good)
2.3 (Good)
9.2 (Good)
2.8 (Good)
4.1 (Good)
4.5 (Good)
6.3 (Good)
11 (Good)
11 (Good)
2.3 (Good)
- (Good)
- (Good)
- (Good)
- (Good)
- (Good)
- (Good)
- (Good)
6.9 (Good)
7.8 (Good)
6.6 (Good)
5.5 (Good)
4.5 (Good)
7.2 (Good)
8.8 (Good)
3.5 (Good)
8.4 (Good)
- (Good)
2.1 (Good)
7.1 (Good)
2.8 (Good)
2.3 (Good)
2.8 (Good)
6 (Good)
5.1 (Good)
pm10
9.6 (Good)
15 (Good)
19 (Good)
16 (Good)
15 (Good)
13 (Good)
8.3 (Good)
12 (Good)
9.2 (Good)
13 (Good)
12 (Good)
13 (Good)
14 (Good)
30 (Moderate)
21 (Moderate)
18 (Good)
19 (Good)
13 (Good)
16 (Good)
11 (Good)
12 (Good)
11 (Good)
15 (Good)
14 (Good)
23 (Moderate)
28 (Moderate)
18 (Good)
17 (Good)
12 (Good)
18 (Good)
15 (Good)
13 (Good)
12 (Good)
11 (Good)
9.7 (Good)
11 (Good)
14 (Good)
17 (Good)
22 (Moderate)
15 (Good)
25 (Moderate)
20 (Good)
pm25
3.7 (Good)
5.4 (Good)
9.3 (Good)
7.6 (Good)
8.8 (Good)
9.3 (Good)
4.7 (Good)
4.9 (Good)
3.4 (Good)
6.3 (Good)
6.2 (Good)
6.6 (Good)
5.4 (Good)
11 (Good)
5.5 (Good)
10 (Good)
12 (Good)
8.4 (Good)
8.4 (Good)
4.6 (Good)
5 (Good)
4.4 (Good)
6.8 (Good)
6.5 (Good)
8.9 (Good)
6.8 (Good)
6.2 (Good)
16 (Moderate)
8 (Good)
9.4 (Good)
7 (Good)
4.6 (Good)
5.2 (Good)
4.3 (Good)
3.7 (Good)
4.2 (Good)
5.9 (Good)
4.8 (Good)
5.4 (Good)
9.3 (Good)
12 (Good)
9.1 (Good)
no2
9.3 (Good)
9.7 (Good)
9.8 (Good)
14 (Good)
16 (Good)
18 (Good)
10 (Good)
11 (Good)
7.8 (Good)
9 (Good)
8.6 (Good)
11 (Good)
10 (Good)
12 (Good)
12 (Good)
23 (Good)
25 (Good)
18 (Good)
14 (Good)
15 (Good)
11 (Good)
11 (Good)
9 (Good)
11 (Good)
14 (Good)
15 (Good)
16 (Good)
21 (Good)
21 (Good)
26 (Good)
23 (Good)
17 (Good)
9 (Good)
11 (Good)
9.6 (Good)
11 (Good)
13 (Good)
13 (Good)
17 (Good)
18 (Good)
28 (Good)
25 (Good)
data source »
Quality of life in Porsgrunn
Green and Parks in the City
Porsgrunn
63%
Denmark: 78%
Sweden: 84%
Aland Islands: 75%
Faroe Islands: 87%
United Kingdom: 75%
particulate matter PM2.5
Porsgrunn
7.8 (Good)
Pleasure of spending time in the city
Porsgrunn
83%
Denmark: 86%
Sweden: 88%
Aland Islands: 92%
Faroe Islands: 100%
United Kingdom: 70%
particulate matter PM10
Porsgrunn
20 (Good)
Air Pollution
Porsgrunn
13%
Denmark: 18%
Sweden: 15%
Aland Islands: 17%
Faroe Islands: 0%
United Kingdom: 37%
Garbage Disposal
Porsgrunn
94%
Denmark: 80%
Sweden: 83%
Aland Islands: 88%
Faroe Islands: 88%
United Kingdom: 60%
Availability and quality of drinking water
Porsgrunn
100%
Denmark: 87%
Sweden: 92%
Aland Islands: 96%
Faroe Islands: 98%
United Kingdom: 75%
Cleanliness and tidiness
Porsgrunn
56%
Denmark: 75%
Sweden: 76%
Aland Islands: 83%
Faroe Islands: 94%
United Kingdom: 53%
Noise and Light pollution
Porsgrunn
44%
Denmark: 32%
Sweden: 26%
Aland Islands: 46%
Faroe Islands: 21%
United Kingdom: 47%
Water Pollution
Porsgrunn
6.3%
Denmark: 19%
Sweden: 15%
Aland Islands: 10%
Faroe Islands: 7.7%
United Kingdom: 31%
Source: Numbeo
Furulund
Tuesday, May 30, 2023, 11:00 PM
SO2 -1.38 (Good)
sulfur dioxide (SO2)
NO2 20 (Good)
nitrogen dioxide (NO2)
PM10 13 (Good)
particulate matter (PM10) suspended dust
PM2,5 5.4 (Good)
particulate matter (PM2.5) dust
Knarrdalstranda
Monday, April 15, 2024, 8:00 AM
PM2,5 8.6 (Good)
particulate matter (PM2.5) dust
PM10 55 (Unhealthy for Sensitive Groups)
particulate matter (PM10) suspended dust
NO2 18 (Good)
nitrogen dioxide (NO2)
Sverresgate
Monday, April 15, 2024, 8:00 AM
PM10 17 (Good)
particulate matter (PM10) suspended dust
NO2 9.3 (Good)
nitrogen dioxide (NO2)
Furulund
index
2023-05-30
2023-05-29
2023-05-28
2023-05-26
2023-05-25
2023-05-24
so2
-0.88
7.8
28
20
19
30
pm25
2.7
5.8
3.1
2.6
6.8
5.7
no2
5.2
19
26
25
23
29
pm10
9.2
12
11
11
16
15
Knarrdalstranda
index
2024-04-15
2024-04-14
2024-04-13
2024-04-12
2024-04-11
2024-04-10
2024-04-09
2024-04-08
pm10
19
3
8.7
22
19
8.4
21
33
pm25
3.5
1
4.3
9.2
5.7
4.3
8.3
17
no2
8.3
2
11
16
13
11
16
17
Sverresgate
index
2024-04-15
2024-04-14
2024-04-13
2024-04-12
2024-04-11
2024-04-10
2024-04-09
2024-04-08
pm10
17
8.1
13
26
18
17
15
36
no2
8.5
2.6
8.4
16
8.2
7.9
9.8
9.8
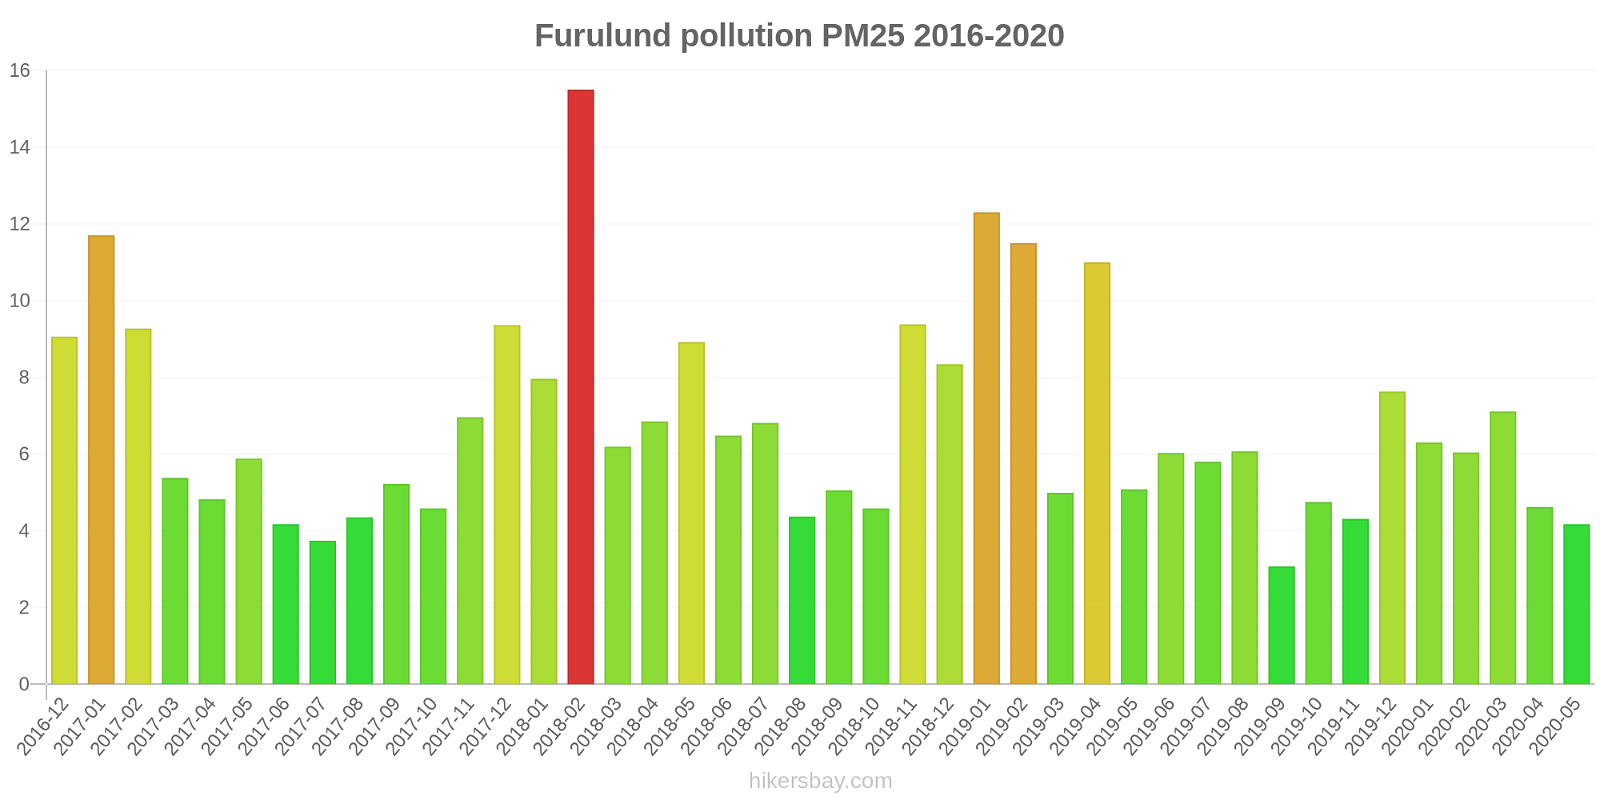
Furulund
2016-12 2020-05
index
2020-05
2020-04
2020-03
2020-02
2020-01
2019-12
2019-11
2019-10
2019-09
2019-08
2019-07
2019-06
2019-05
2019-04
2019-03
2019-02
2019-01
2018-12
2018-11
2018-10
2018-09
2018-08
2018-07
2018-06
2018-05
2018-04
2018-03
2018-02
2018-01
2017-12
2017-11
2017-10
2017-09
2017-08
2017-07
2017-06
2017-05
2017-04
2017-03
2017-02
2017-01
2016-12
no2
18
13
7.4
13
12
17
12
11
7.8
7.4
10
8.8
12
12
11
22
24
19
14
15
8.6
10
9.4
11
13
15
13
18
17
24
19
17
7.7
10
12
11
12
15
12
15
26
22
pm10
10
9.9
12
10
9.7
11
7.5
9.8
7.1
10
11
11
10
22
12
19
19
13
15
9
9.9
9.7
13
12
18
17
14
20
11
15
12
10
12
9.3
8.5
9.8
12
11
13
13
20
15
so2
15
-
2.4
10
6.1
4.5
6.7
3
8.9
2.3
9.2
2.8
4.1
4.5
6.3
11
11
2.3
-
-
-
-
-
-
-
6.9
7.8
6.6
5.5
4.5
7.2
8.8
3.5
8.4
-
2.1
7.1
2.8
2.3
2.8
6
5.1
pm25
4.2
4.6
7.1
6
6.3
7.6
4.3
4.8
3.1
6.1
5.8
6
5.1
11
5
12
12
8.3
9.4
4.6
5
4.4
6.8
6.5
8.9
6.8
6.2
16
8
9.4
7
4.6
5.2
4.3
3.7
4.2
5.9
4.8
5.4
9.3
12
9.1
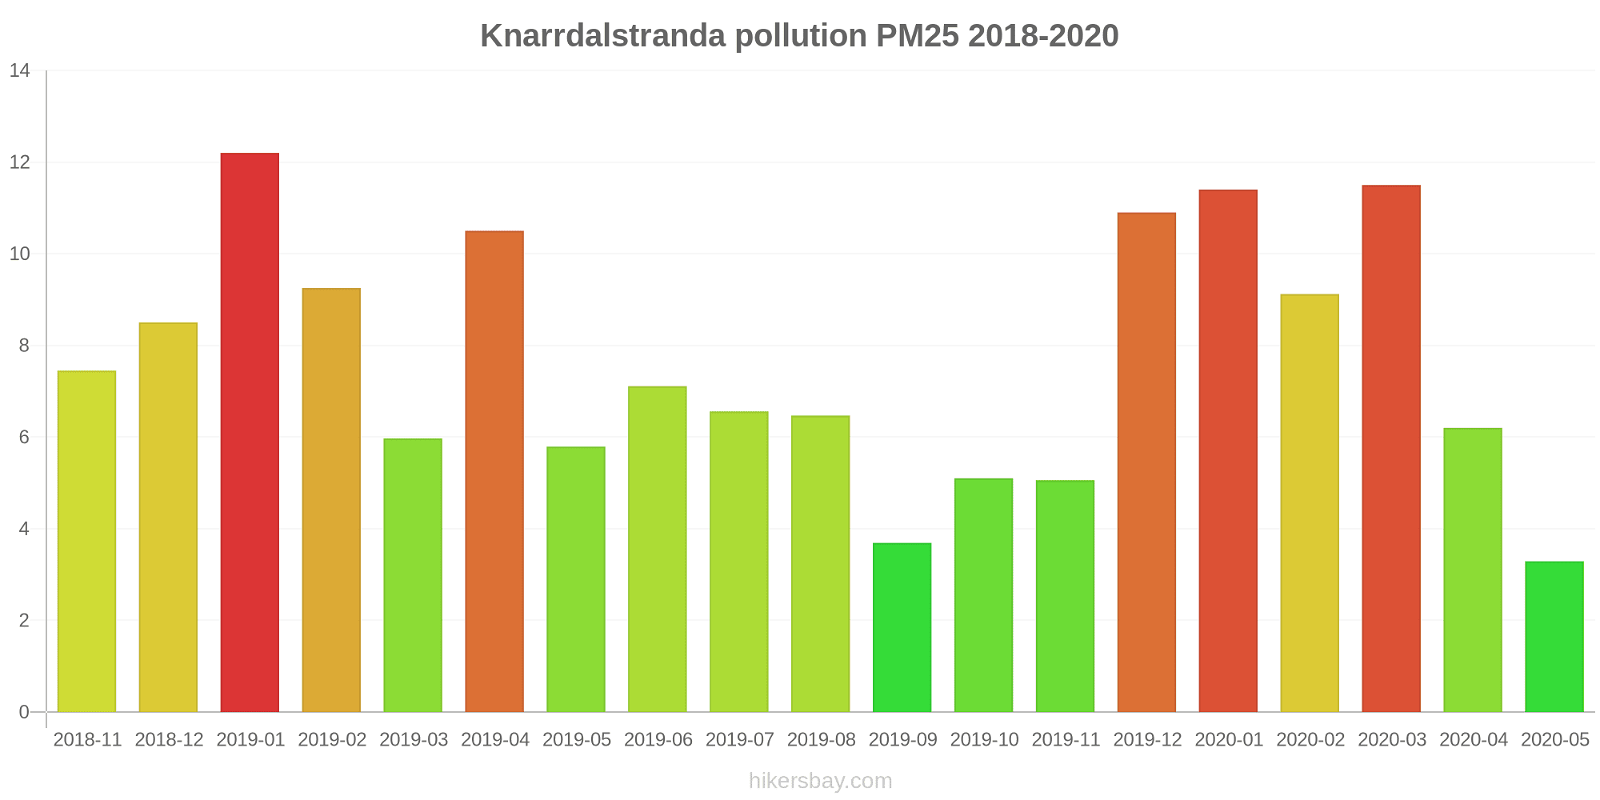
Knarrdalstranda
2018-11 2020-05
index
2020-05
2020-04
2020-03
2020-02
2020-01
2019-12
2019-11
2019-10
2019-09
2019-08
2019-07
2019-06
2019-05
2019-04
2019-03
2019-02
2019-01
2018-12
2018-11
no2
4.4
8.3
11
9.7
12
14
8.4
7.6
4.2
8.3
6.7
9.6
7.9
11
9.8
20
19
14
12
pm10
7.9
17
23
17
17
13
8.2
9.7
9.8
15
13
15
17
36
23
19
19
13
16
pm25
3.3
6.2
12
9.1
11
11
5.1
5.1
3.7
6.5
6.6
7.1
5.8
11
6
9.3
12
8.5
7.5
Sverresgate
index
2018-04
2018-03
2018-02
2018-01
2017-12
2017-11
2017-10
2017-09
2017-08
2017-07
2017-06
2017-05
2017-04
2017-03
2017-02
2017-01
2016-12
no2
15
19
23
25
28
26
18
10
12
7.2
11
13
12
21
22
31
29
pm10
40
21
14
12
21
18
16
13
12
11
12
16
24
31
18
29
25
Sverresgate
index
2020-05
2020-04
2020-03
2020-02
2020-01
2019-12
2019-11
2019-10
2019-09
2019-08
2019-07
2019-06
2019-05
2019-04
2019-03
2019-02
2019-01
2018-12
2018-11
2018-10
2018-09
2018-08
2018-07
2018-06
2018-05
2018-04
pm10
11
17
21
21
20
14
9.1
15
11
14
12
14
14
33
27
18
20
14
16
13
13
12
16
16
27
29
no2
5.5
7.8
11
18
23
22
11
16
12
11
8.8
13
11
14
16
29
33
22
17
16
13
11
8.7
11
14
14
* Pollution data source:
https://openaq.org
(Norway)
The data is licensed under CC-By 4.0
SO2 -1 (Good)
NO2 16 (Good)
PM10 29 (Moderate)
PM2,5 7 (Good)
Data on air pollution from recent days in Porsgrunn
| index | 2023-05-24 | 2023-05-25 | 2023-05-26 | 2023-05-28 | 2023-05-29 | 2023-05-30 | 2024-04-08 | 2024-04-09 | 2024-04-10 | 2024-04-11 | 2024-04-12 | 2024-04-13 | 2024-04-14 | 2024-04-15 |
|---|---|---|---|---|---|---|---|---|---|---|---|---|---|---|
| so2 | 30 Good |
19 Good |
20 Good |
28 Good |
8 Good |
-1 Good |
- Good |
- Good |
- Good |
- Good |
- Good |
- Good |
- Good |
- Good |
| pm25 | 6 Good |
7 Good |
3 Good |
3 Good |
6 Good |
3 Good |
17 Moderate |
8 Good |
4 Good |
6 Good |
9 Good |
4 Good |
1 Good |
3 Good |
| no2 | 29 Good |
23 Good |
25 Good |
26 Good |
19 Good |
5 Good |
14 Good |
13 Good |
9 Good |
11 Good |
16 Good |
10 Good |
2 Good |
8 Good |
| pm10 | 15 Good |
16 Good |
11 Good |
11 Good |
12 Good |
9 Good |
34 Moderate |
18 Good |
13 Good |
19 Good |
24 Moderate |
11 Good |
6 Good |
18 Good |

| index | 2020-05 | 2020-04 | 2020-03 | 2020-02 | 2020-01 | 2019-12 | 2019-11 | 2019-10 | 2019-09 | 2019-08 | 2019-07 | 2019-06 | 2019-05 | 2019-04 | 2019-03 | 2019-02 | 2019-01 | 2018-12 | 2018-11 | 2018-10 | 2018-09 | 2018-08 | 2018-07 | 2018-06 | 2018-05 | 2018-04 | 2018-03 | 2018-02 | 2018-01 | 2017-12 | 2017-11 | 2017-10 | 2017-09 | 2017-08 | 2017-07 | 2017-06 | 2017-05 | 2017-04 | 2017-03 | 2017-02 | 2017-01 | 2016-12 |
|---|---|---|---|---|---|---|---|---|---|---|---|---|---|---|---|---|---|---|---|---|---|---|---|---|---|---|---|---|---|---|---|---|---|---|---|---|---|---|---|---|---|---|
| so2 | 15 (Good) | - (Good) | 2.4 (Good) | 10 (Good) | 6.1 (Good) | 4.5 (Good) | 6.7 (Good) | 3 (Good) | 8.9 (Good) | 2.3 (Good) | 9.2 (Good) | 2.8 (Good) | 4.1 (Good) | 4.5 (Good) | 6.3 (Good) | 11 (Good) | 11 (Good) | 2.3 (Good) | - (Good) | - (Good) | - (Good) | - (Good) | - (Good) | - (Good) | - (Good) | 6.9 (Good) | 7.8 (Good) | 6.6 (Good) | 5.5 (Good) | 4.5 (Good) | 7.2 (Good) | 8.8 (Good) | 3.5 (Good) | 8.4 (Good) | - (Good) | 2.1 (Good) | 7.1 (Good) | 2.8 (Good) | 2.3 (Good) | 2.8 (Good) | 6 (Good) | 5.1 (Good) |
| pm10 | 9.6 (Good) | 15 (Good) | 19 (Good) | 16 (Good) | 15 (Good) | 13 (Good) | 8.3 (Good) | 12 (Good) | 9.2 (Good) | 13 (Good) | 12 (Good) | 13 (Good) | 14 (Good) | 30 (Moderate) | 21 (Moderate) | 18 (Good) | 19 (Good) | 13 (Good) | 16 (Good) | 11 (Good) | 12 (Good) | 11 (Good) | 15 (Good) | 14 (Good) | 23 (Moderate) | 28 (Moderate) | 18 (Good) | 17 (Good) | 12 (Good) | 18 (Good) | 15 (Good) | 13 (Good) | 12 (Good) | 11 (Good) | 9.7 (Good) | 11 (Good) | 14 (Good) | 17 (Good) | 22 (Moderate) | 15 (Good) | 25 (Moderate) | 20 (Good) |
| pm25 | 3.7 (Good) | 5.4 (Good) | 9.3 (Good) | 7.6 (Good) | 8.8 (Good) | 9.3 (Good) | 4.7 (Good) | 4.9 (Good) | 3.4 (Good) | 6.3 (Good) | 6.2 (Good) | 6.6 (Good) | 5.4 (Good) | 11 (Good) | 5.5 (Good) | 10 (Good) | 12 (Good) | 8.4 (Good) | 8.4 (Good) | 4.6 (Good) | 5 (Good) | 4.4 (Good) | 6.8 (Good) | 6.5 (Good) | 8.9 (Good) | 6.8 (Good) | 6.2 (Good) | 16 (Moderate) | 8 (Good) | 9.4 (Good) | 7 (Good) | 4.6 (Good) | 5.2 (Good) | 4.3 (Good) | 3.7 (Good) | 4.2 (Good) | 5.9 (Good) | 4.8 (Good) | 5.4 (Good) | 9.3 (Good) | 12 (Good) | 9.1 (Good) |
| no2 | 9.3 (Good) | 9.7 (Good) | 9.8 (Good) | 14 (Good) | 16 (Good) | 18 (Good) | 10 (Good) | 11 (Good) | 7.8 (Good) | 9 (Good) | 8.6 (Good) | 11 (Good) | 10 (Good) | 12 (Good) | 12 (Good) | 23 (Good) | 25 (Good) | 18 (Good) | 14 (Good) | 15 (Good) | 11 (Good) | 11 (Good) | 9 (Good) | 11 (Good) | 14 (Good) | 15 (Good) | 16 (Good) | 21 (Good) | 21 (Good) | 26 (Good) | 23 (Good) | 17 (Good) | 9 (Good) | 11 (Good) | 9.6 (Good) | 11 (Good) | 13 (Good) | 13 (Good) | 17 (Good) | 18 (Good) | 28 (Good) | 25 (Good) |
Green and Parks in the City
Porsgrunn 63%
Denmark: 78% Sweden: 84% Aland Islands: 75% Faroe Islands: 87% United Kingdom: 75%particulate matter PM2.5
Porsgrunn 7.8 (Good)
Pleasure of spending time in the city
Porsgrunn 83%
Denmark: 86% Sweden: 88% Aland Islands: 92% Faroe Islands: 100% United Kingdom: 70%particulate matter PM10
Porsgrunn 20 (Good)
Air Pollution
Porsgrunn 13%
Denmark: 18% Sweden: 15% Aland Islands: 17% Faroe Islands: 0% United Kingdom: 37%Garbage Disposal
Porsgrunn 94%
Denmark: 80% Sweden: 83% Aland Islands: 88% Faroe Islands: 88% United Kingdom: 60%Availability and quality of drinking water
Porsgrunn 100%
Denmark: 87% Sweden: 92% Aland Islands: 96% Faroe Islands: 98% United Kingdom: 75%Cleanliness and tidiness
Porsgrunn 56%
Denmark: 75% Sweden: 76% Aland Islands: 83% Faroe Islands: 94% United Kingdom: 53%Noise and Light pollution
Porsgrunn 44%
Denmark: 32% Sweden: 26% Aland Islands: 46% Faroe Islands: 21% United Kingdom: 47%Water Pollution
Porsgrunn 6.3%
Denmark: 19% Sweden: 15% Aland Islands: 10% Faroe Islands: 7.7% United Kingdom: 31%SO2 -1.38 (Good)
sulfur dioxide (SO2)NO2 20 (Good)
nitrogen dioxide (NO2)PM10 13 (Good)
particulate matter (PM10) suspended dustPM2,5 5.4 (Good)
particulate matter (PM2.5) dustPM2,5 8.6 (Good)
particulate matter (PM2.5) dustPM10 55 (Unhealthy for Sensitive Groups)
particulate matter (PM10) suspended dustNO2 18 (Good)
nitrogen dioxide (NO2)PM10 17 (Good)
particulate matter (PM10) suspended dustNO2 9.3 (Good)
nitrogen dioxide (NO2)Furulund
| index | 2023-05-30 | 2023-05-29 | 2023-05-28 | 2023-05-26 | 2023-05-25 | 2023-05-24 |
|---|---|---|---|---|---|---|
| so2 | -0.88 | 7.8 | 28 | 20 | 19 | 30 |
| pm25 | 2.7 | 5.8 | 3.1 | 2.6 | 6.8 | 5.7 |
| no2 | 5.2 | 19 | 26 | 25 | 23 | 29 |
| pm10 | 9.2 | 12 | 11 | 11 | 16 | 15 |
Knarrdalstranda
| index | 2024-04-15 | 2024-04-14 | 2024-04-13 | 2024-04-12 | 2024-04-11 | 2024-04-10 | 2024-04-09 | 2024-04-08 |
|---|---|---|---|---|---|---|---|---|
| pm10 | 19 | 3 | 8.7 | 22 | 19 | 8.4 | 21 | 33 |
| pm25 | 3.5 | 1 | 4.3 | 9.2 | 5.7 | 4.3 | 8.3 | 17 |
| no2 | 8.3 | 2 | 11 | 16 | 13 | 11 | 16 | 17 |
Sverresgate
| index | 2024-04-15 | 2024-04-14 | 2024-04-13 | 2024-04-12 | 2024-04-11 | 2024-04-10 | 2024-04-09 | 2024-04-08 |
|---|---|---|---|---|---|---|---|---|
| pm10 | 17 | 8.1 | 13 | 26 | 18 | 17 | 15 | 36 |
| no2 | 8.5 | 2.6 | 8.4 | 16 | 8.2 | 7.9 | 9.8 | 9.8 |
Furulund

| index | 2020-05 | 2020-04 | 2020-03 | 2020-02 | 2020-01 | 2019-12 | 2019-11 | 2019-10 | 2019-09 | 2019-08 | 2019-07 | 2019-06 | 2019-05 | 2019-04 | 2019-03 | 2019-02 | 2019-01 | 2018-12 | 2018-11 | 2018-10 | 2018-09 | 2018-08 | 2018-07 | 2018-06 | 2018-05 | 2018-04 | 2018-03 | 2018-02 | 2018-01 | 2017-12 | 2017-11 | 2017-10 | 2017-09 | 2017-08 | 2017-07 | 2017-06 | 2017-05 | 2017-04 | 2017-03 | 2017-02 | 2017-01 | 2016-12 |
|---|---|---|---|---|---|---|---|---|---|---|---|---|---|---|---|---|---|---|---|---|---|---|---|---|---|---|---|---|---|---|---|---|---|---|---|---|---|---|---|---|---|---|
| no2 | 18 | 13 | 7.4 | 13 | 12 | 17 | 12 | 11 | 7.8 | 7.4 | 10 | 8.8 | 12 | 12 | 11 | 22 | 24 | 19 | 14 | 15 | 8.6 | 10 | 9.4 | 11 | 13 | 15 | 13 | 18 | 17 | 24 | 19 | 17 | 7.7 | 10 | 12 | 11 | 12 | 15 | 12 | 15 | 26 | 22 |
| pm10 | 10 | 9.9 | 12 | 10 | 9.7 | 11 | 7.5 | 9.8 | 7.1 | 10 | 11 | 11 | 10 | 22 | 12 | 19 | 19 | 13 | 15 | 9 | 9.9 | 9.7 | 13 | 12 | 18 | 17 | 14 | 20 | 11 | 15 | 12 | 10 | 12 | 9.3 | 8.5 | 9.8 | 12 | 11 | 13 | 13 | 20 | 15 |
| so2 | 15 | - | 2.4 | 10 | 6.1 | 4.5 | 6.7 | 3 | 8.9 | 2.3 | 9.2 | 2.8 | 4.1 | 4.5 | 6.3 | 11 | 11 | 2.3 | - | - | - | - | - | - | - | 6.9 | 7.8 | 6.6 | 5.5 | 4.5 | 7.2 | 8.8 | 3.5 | 8.4 | - | 2.1 | 7.1 | 2.8 | 2.3 | 2.8 | 6 | 5.1 |
| pm25 | 4.2 | 4.6 | 7.1 | 6 | 6.3 | 7.6 | 4.3 | 4.8 | 3.1 | 6.1 | 5.8 | 6 | 5.1 | 11 | 5 | 12 | 12 | 8.3 | 9.4 | 4.6 | 5 | 4.4 | 6.8 | 6.5 | 8.9 | 6.8 | 6.2 | 16 | 8 | 9.4 | 7 | 4.6 | 5.2 | 4.3 | 3.7 | 4.2 | 5.9 | 4.8 | 5.4 | 9.3 | 12 | 9.1 |
Knarrdalstranda

| index | 2020-05 | 2020-04 | 2020-03 | 2020-02 | 2020-01 | 2019-12 | 2019-11 | 2019-10 | 2019-09 | 2019-08 | 2019-07 | 2019-06 | 2019-05 | 2019-04 | 2019-03 | 2019-02 | 2019-01 | 2018-12 | 2018-11 |
|---|---|---|---|---|---|---|---|---|---|---|---|---|---|---|---|---|---|---|---|
| no2 | 4.4 | 8.3 | 11 | 9.7 | 12 | 14 | 8.4 | 7.6 | 4.2 | 8.3 | 6.7 | 9.6 | 7.9 | 11 | 9.8 | 20 | 19 | 14 | 12 |
| pm10 | 7.9 | 17 | 23 | 17 | 17 | 13 | 8.2 | 9.7 | 9.8 | 15 | 13 | 15 | 17 | 36 | 23 | 19 | 19 | 13 | 16 |
| pm25 | 3.3 | 6.2 | 12 | 9.1 | 11 | 11 | 5.1 | 5.1 | 3.7 | 6.5 | 6.6 | 7.1 | 5.8 | 11 | 6 | 9.3 | 12 | 8.5 | 7.5 |
Sverresgate
| index | 2018-04 | 2018-03 | 2018-02 | 2018-01 | 2017-12 | 2017-11 | 2017-10 | 2017-09 | 2017-08 | 2017-07 | 2017-06 | 2017-05 | 2017-04 | 2017-03 | 2017-02 | 2017-01 | 2016-12 |
|---|---|---|---|---|---|---|---|---|---|---|---|---|---|---|---|---|---|
| no2 | 15 | 19 | 23 | 25 | 28 | 26 | 18 | 10 | 12 | 7.2 | 11 | 13 | 12 | 21 | 22 | 31 | 29 |
| pm10 | 40 | 21 | 14 | 12 | 21 | 18 | 16 | 13 | 12 | 11 | 12 | 16 | 24 | 31 | 18 | 29 | 25 |
Sverresgate
| index | 2020-05 | 2020-04 | 2020-03 | 2020-02 | 2020-01 | 2019-12 | 2019-11 | 2019-10 | 2019-09 | 2019-08 | 2019-07 | 2019-06 | 2019-05 | 2019-04 | 2019-03 | 2019-02 | 2019-01 | 2018-12 | 2018-11 | 2018-10 | 2018-09 | 2018-08 | 2018-07 | 2018-06 | 2018-05 | 2018-04 |
|---|---|---|---|---|---|---|---|---|---|---|---|---|---|---|---|---|---|---|---|---|---|---|---|---|---|---|
| pm10 | 11 | 17 | 21 | 21 | 20 | 14 | 9.1 | 15 | 11 | 14 | 12 | 14 | 14 | 33 | 27 | 18 | 20 | 14 | 16 | 13 | 13 | 12 | 16 | 16 | 27 | 29 |
| no2 | 5.5 | 7.8 | 11 | 18 | 23 | 22 | 11 | 16 | 12 | 11 | 8.8 | 13 | 11 | 14 | 16 | 29 | 33 | 22 | 17 | 16 | 13 | 11 | 8.7 | 11 | 14 | 14 |