Air Pollution in Tromsø: Real-time Air Quality Index and smog alert.
Pollution and air quality forecast for Tromsø. Today is Tuesday, June 23, 2026. The following air pollution values have been recorded for Tromsø:- nitrogen dioxide (NO2) - 35 (Good)
- particulate matter (PM10) suspended dust - 7 (Good)
- particulate matter (PM2.5) dust - 8 (Good)

What is the air quality in Tromsø today? Is the air polluted in Tromsø?. Is there smog?
How high is the level of NO2? (nitrogen dioxide (NO2))
35 (Good)
What is the level of PM10 today in Tromsø? (particulate matter (PM10) suspended dust)
The current level of particulate matter PM10 in Tromsø is:
7 (Good)
The highest PM10 values usually occur in month: 31 (April 2017).
The lowest value of particulate matter PM10 pollution in Tromsø is usually recorded in: December (6.9).
What is the current level of PM2.5 in Tromsø? (particulate matter (PM2.5) dust)
Today's PM2.5 level is:
8 (Good)
For comparison, the highest level of PM2.5 in Tromsø in the last 7 days was: 8 (Friday, April 12, 2024) and the lowest: 3 (Saturday, April 13, 2024).
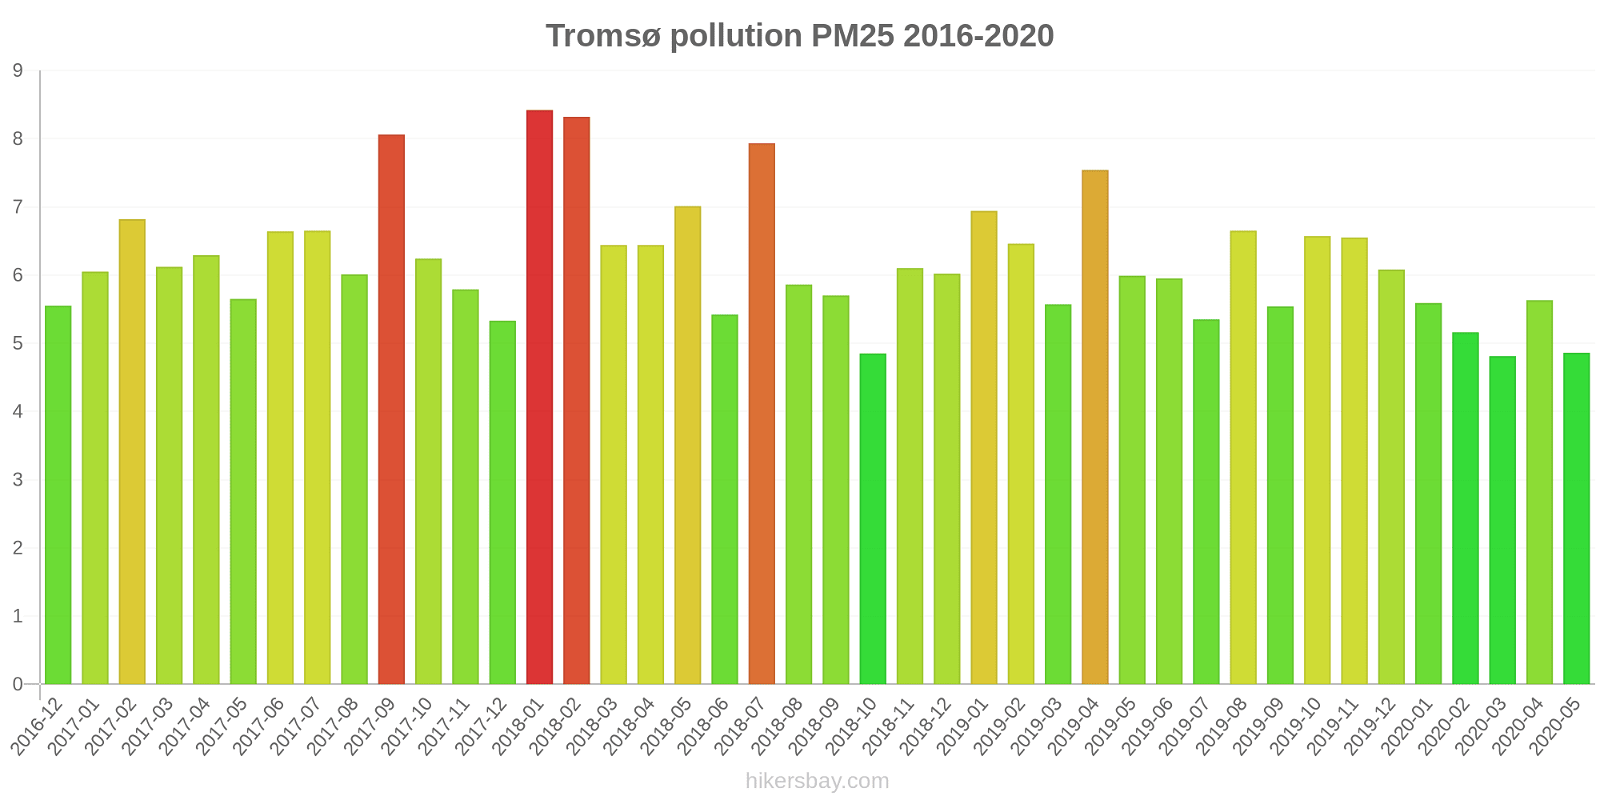
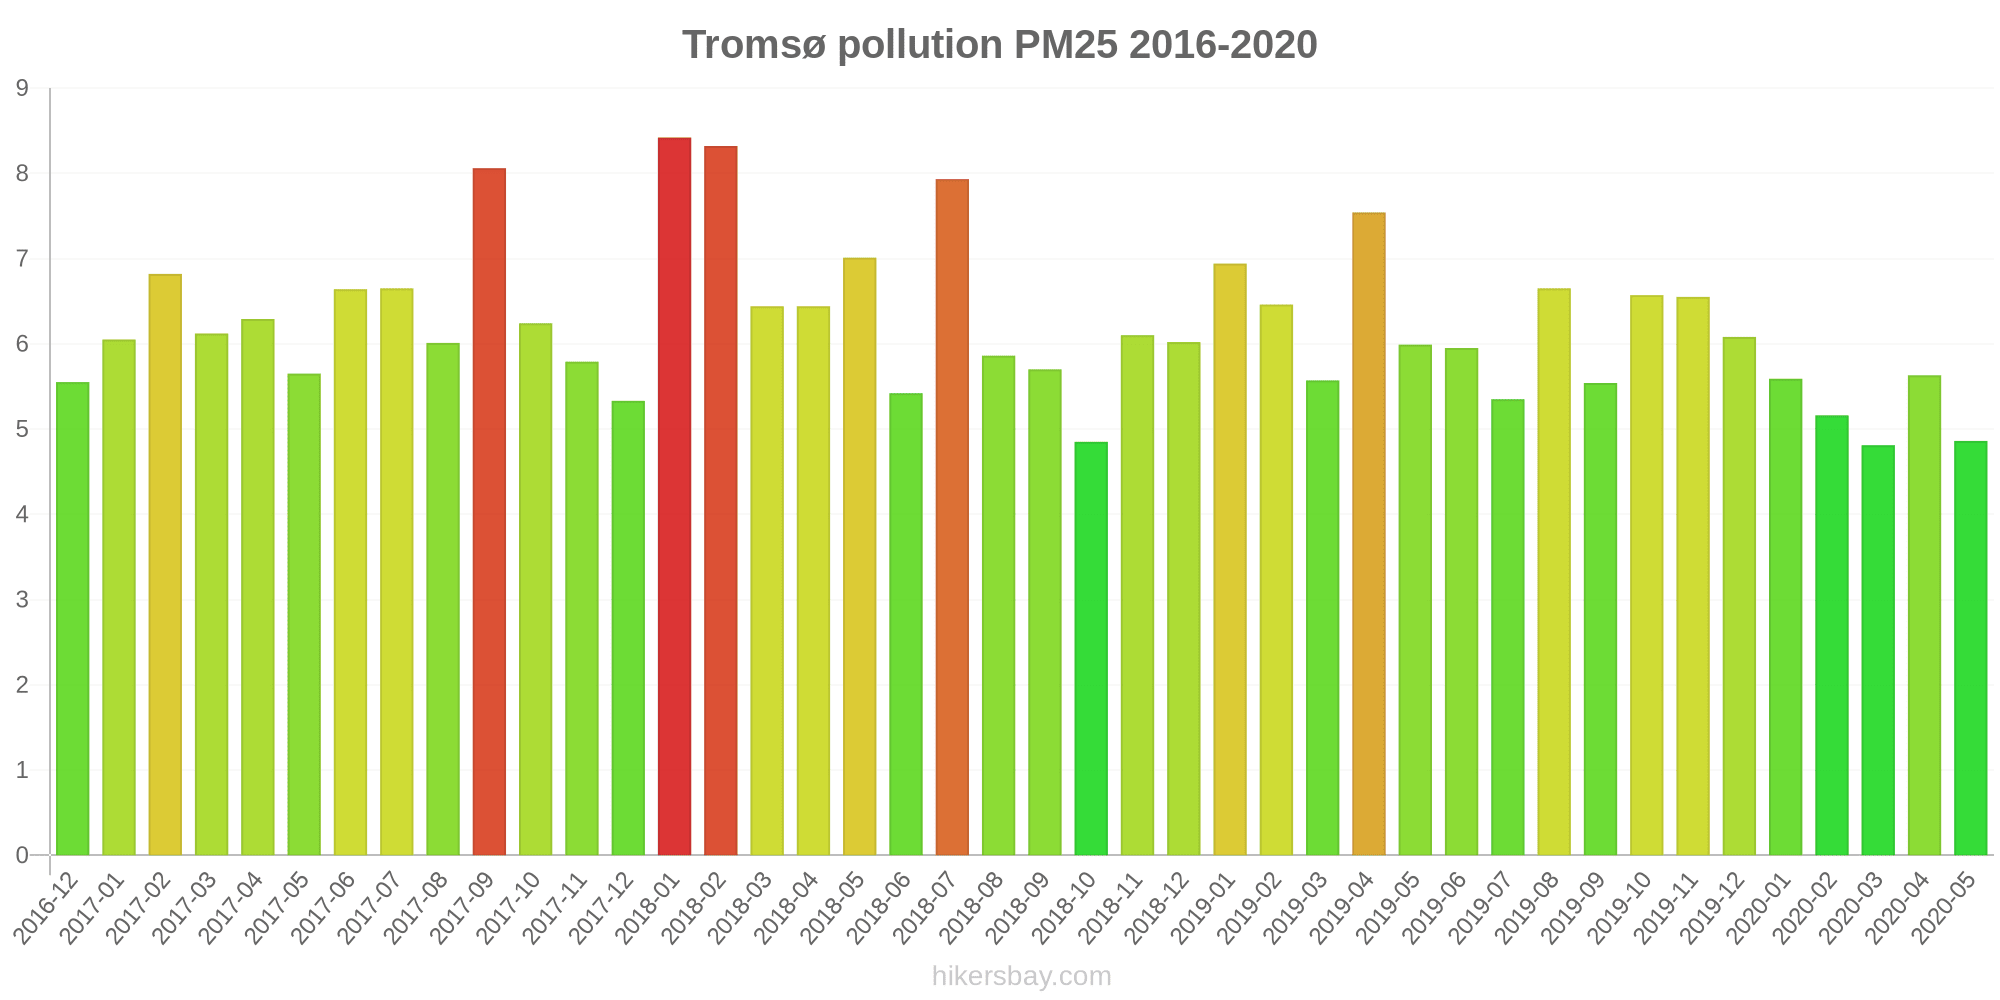
The highest PM2.5 values were recorded: 8.4 (January 2018).
The lowest level of particulate matter PM2.5 pollution occurs in month: March (4.8).
Current data Friday, April 12, 2024, 11:00 PM
NO2 35 (Good)
PM10 7 (Good)
PM2,5 8 (Good)
Data on air pollution from recent days in Tromsø
index
2024-04-08
2024-04-09
2024-04-10
2024-04-11
2024-04-12
2024-04-13
2024-04-14
2024-04-15
pm10
6
Good
4
Good
6
Good
8
Good
21
Moderate
4
Good
10
Good
9
Good
no2
22
Good
26
Good
49
Moderate
32
Good
15
Good
18
Good
10
Good
15
Good
pm25
4
Good
4
Good
4
Good
6
Good
8
Good
3
Good
6
Good
6
Good
data source »
Air pollution in Tromsø from December 2016 to May 2020
index
2020-05
2020-04
2020-03
2020-02
2020-01
2019-12
2019-11
2019-10
2019-09
2019-08
2019-07
2019-06
2019-05
2019-04
2019-03
2019-02
2019-01
2018-12
2018-11
2018-10
2018-09
2018-08
2018-07
2018-06
2018-05
2018-04
2018-03
2018-02
2018-01
2017-12
2017-11
2017-10
2017-09
2017-08
2017-07
2017-06
2017-05
2017-04
2017-03
2017-02
2017-01
2016-12
pm10
20 (Good)
18 (Good)
8.8 (Good)
8.3 (Good)
9.7 (Good)
9.7 (Good)
8.7 (Good)
21 (Moderate)
13 (Good)
18 (Good)
16 (Good)
16 (Good)
23 (Moderate)
31 (Moderate)
9.6 (Good)
10 (Good)
12 (Good)
15 (Good)
12 (Good)
16 (Good)
13 (Good)
14 (Good)
19 (Good)
13 (Good)
29 (Moderate)
19 (Good)
9.6 (Good)
14 (Good)
14 (Good)
6.9 (Good)
14 (Good)
20 (Moderate)
23 (Moderate)
15 (Good)
14 (Good)
20 (Good)
22 (Moderate)
31 (Moderate)
10 (Good)
13 (Good)
11 (Good)
11 (Good)
pm25
4.9 (Good)
5.6 (Good)
4.8 (Good)
5.2 (Good)
5.6 (Good)
6.1 (Good)
6.5 (Good)
6.6 (Good)
5.5 (Good)
6.7 (Good)
5.3 (Good)
6 (Good)
6 (Good)
7.5 (Good)
5.6 (Good)
6.5 (Good)
6.9 (Good)
6 (Good)
6.1 (Good)
4.8 (Good)
5.7 (Good)
5.9 (Good)
7.9 (Good)
5.4 (Good)
7 (Good)
6.4 (Good)
6.4 (Good)
8.3 (Good)
8.4 (Good)
5.3 (Good)
5.8 (Good)
6.2 (Good)
8.1 (Good)
6 (Good)
6.7 (Good)
6.6 (Good)
5.7 (Good)
6.3 (Good)
6.1 (Good)
6.8 (Good)
6 (Good)
5.5 (Good)
no2
15 (Good)
18 (Good)
20 (Good)
31 (Good)
31 (Good)
34 (Good)
43 (Moderate)
36 (Good)
29 (Good)
50 (Moderate)
20 (Good)
23 (Good)
20 (Good)
29 (Good)
32 (Good)
38 (Good)
39 (Good)
34 (Good)
34 (Good)
26 (Good)
28 (Good)
25 (Good)
24 (Good)
20 (Good)
27 (Good)
38 (Good)
40 (Good)
39 (Good)
44 (Moderate)
35 (Good)
35 (Good)
34 (Good)
35 (Good)
27 (Good)
23 (Good)
18 (Good)
22 (Good)
29 (Good)
41 (Moderate)
48 (Moderate)
38 (Good)
31 (Good)
data source »
Quality of life in Tromsø
Green and Parks in the City
Tromsø
75%
Denmark: 78%
Sweden: 84%
Aland Islands: 75%
Faroe Islands: 87%
United Kingdom: 75%
particulate matter PM2.5
Tromsø
7 (Good)
Pleasure of spending time in the city
Tromsø
96%
Denmark: 86%
Sweden: 88%
Aland Islands: 92%
Faroe Islands: 100%
United Kingdom: 70%
particulate matter PM10
Tromsø
20 (Moderate)
Air Pollution
Tromsø
15%
Denmark: 18%
Sweden: 15%
Aland Islands: 17%
Faroe Islands: 0%
United Kingdom: 37%
Garbage Disposal
Tromsø
89%
Denmark: 80%
Sweden: 83%
Aland Islands: 88%
Faroe Islands: 88%
United Kingdom: 60%
Availability and quality of drinking water
Tromsø
98%
Denmark: 87%
Sweden: 92%
Aland Islands: 96%
Faroe Islands: 98%
United Kingdom: 75%
Cleanliness and tidiness
Tromsø
75%
Denmark: 75%
Sweden: 76%
Aland Islands: 83%
Faroe Islands: 94%
United Kingdom: 53%
Noise and Light pollution
Tromsø
39%
Denmark: 32%
Sweden: 26%
Aland Islands: 46%
Faroe Islands: 21%
United Kingdom: 47%
Water Pollution
Tromsø
18%
Denmark: 19%
Sweden: 15%
Aland Islands: 10%
Faroe Islands: 7.7%
United Kingdom: 31%
Source: Numbeo
Hansjordnesbukta
Monday, April 15, 2024, 8:00 AM
NO2 35 (Good)
nitrogen dioxide (NO2)
PM10 12 (Good)
particulate matter (PM10) suspended dust
PM2,5 8.2 (Good)
particulate matter (PM2.5) dust
Rambergan
Friday, April 12, 2024, 11:00 PM
PM10 2.4 (Good)
particulate matter (PM10) suspended dust
Hansjordnesbukta
index
2024-04-15
2024-04-14
2024-04-13
2024-04-12
2024-04-11
2024-04-10
2024-04-09
2024-04-08
pm10
9.2
9.7
4
30
9.5
7.6
5.2
6.4
no2
15
10
18
15
32
49
26
22
pm25
6.4
5.9
3.3
8
6.3
4.3
4
4.3
Rambergan
index
2024-04-12
2024-04-11
2024-04-10
2024-04-09
2024-04-08
pm10
13
7.3
5.2
3.5
4.7
Hansjordnesbukta
2016-12 2020-05

index
2020-05
2020-04
2020-03
2020-02
2020-01
2019-12
2019-11
2019-10
2019-09
2019-08
2019-07
2019-06
2019-05
2019-04
2019-03
2019-02
2019-01
2018-12
2018-11
2018-10
2018-09
2018-08
2018-07
2018-06
2018-05
2018-04
2018-03
2018-02
2018-01
2017-12
2017-11
2017-10
2017-09
2017-08
2017-07
2017-06
2017-05
2017-04
2017-03
2017-02
2017-01
2016-12
pm25
4.9
5.6
4.8
5.2
5.6
6.1
6.5
6.6
5.5
6.7
5.3
6
6
7.5
5.6
6.5
6.9
6
6.1
4.8
5.7
5.9
7.9
5.4
7
6.4
6.4
8.3
8.4
5.3
5.8
6.2
8.1
6
6.7
6.6
5.7
6.3
6.1
6.8
6
5.5
pm10
26
22
9.7
9.4
11
11
10
30
17
21
18
19
29
38
11
12
16
19
14
22
15
17
22
16
36
24
11
18
16
9.6
15
23
30
19
17
25
26
37
11
13
12
13
no2
15
18
20
31
31
34
43
36
29
50
20
23
20
29
32
38
39
34
34
26
28
25
24
20
27
38
40
39
44
35
35
34
35
27
23
18
22
29
41
48
38
31
Rambergan
index
2020-05
2020-04
2020-03
2020-02
2020-01
2019-12
2019-11
2019-10
2019-09
2019-08
2019-07
2019-06
2019-05
2019-04
2019-03
2019-02
2019-01
2018-12
2018-11
2018-10
2018-09
2018-08
2018-07
2018-06
2018-05
2018-04
2018-03
2018-02
2018-01
2017-12
pm10
13
14
7.8
7.1
8.5
7.9
7.3
13
9.6
15
14
14
17
23
8.4
8.8
8.8
12
8.8
9.7
9.8
11
16
9.4
22
14
8
11
11
4.5
Tverrforbindelsen
index
2017-12
2017-11
2017-10
2017-09
2017-08
2017-07
2017-06
2017-05
2017-04
2017-03
2017-01
2016-12
pm10
6.6
13
18
17
10
10
14
17
26
8.9
10
9.3
* Pollution data source:
https://openaq.org
(Norway)
The data is licensed under CC-By 4.0
NO2 35 (Good)
PM10 7 (Good)
PM2,5 8 (Good)
Data on air pollution from recent days in Tromsø
| index | 2024-04-08 | 2024-04-09 | 2024-04-10 | 2024-04-11 | 2024-04-12 | 2024-04-13 | 2024-04-14 | 2024-04-15 |
|---|---|---|---|---|---|---|---|---|
| pm10 | 6 Good |
4 Good |
6 Good |
8 Good |
21 Moderate |
4 Good |
10 Good |
9 Good |
| no2 | 22 Good |
26 Good |
49 Moderate |
32 Good |
15 Good |
18 Good |
10 Good |
15 Good |
| pm25 | 4 Good |
4 Good |
4 Good |
6 Good |
8 Good |
3 Good |
6 Good |
6 Good |
| index | 2020-05 | 2020-04 | 2020-03 | 2020-02 | 2020-01 | 2019-12 | 2019-11 | 2019-10 | 2019-09 | 2019-08 | 2019-07 | 2019-06 | 2019-05 | 2019-04 | 2019-03 | 2019-02 | 2019-01 | 2018-12 | 2018-11 | 2018-10 | 2018-09 | 2018-08 | 2018-07 | 2018-06 | 2018-05 | 2018-04 | 2018-03 | 2018-02 | 2018-01 | 2017-12 | 2017-11 | 2017-10 | 2017-09 | 2017-08 | 2017-07 | 2017-06 | 2017-05 | 2017-04 | 2017-03 | 2017-02 | 2017-01 | 2016-12 |
|---|---|---|---|---|---|---|---|---|---|---|---|---|---|---|---|---|---|---|---|---|---|---|---|---|---|---|---|---|---|---|---|---|---|---|---|---|---|---|---|---|---|---|
| pm10 | 20 (Good) | 18 (Good) | 8.8 (Good) | 8.3 (Good) | 9.7 (Good) | 9.7 (Good) | 8.7 (Good) | 21 (Moderate) | 13 (Good) | 18 (Good) | 16 (Good) | 16 (Good) | 23 (Moderate) | 31 (Moderate) | 9.6 (Good) | 10 (Good) | 12 (Good) | 15 (Good) | 12 (Good) | 16 (Good) | 13 (Good) | 14 (Good) | 19 (Good) | 13 (Good) | 29 (Moderate) | 19 (Good) | 9.6 (Good) | 14 (Good) | 14 (Good) | 6.9 (Good) | 14 (Good) | 20 (Moderate) | 23 (Moderate) | 15 (Good) | 14 (Good) | 20 (Good) | 22 (Moderate) | 31 (Moderate) | 10 (Good) | 13 (Good) | 11 (Good) | 11 (Good) |
| pm25 | 4.9 (Good) | 5.6 (Good) | 4.8 (Good) | 5.2 (Good) | 5.6 (Good) | 6.1 (Good) | 6.5 (Good) | 6.6 (Good) | 5.5 (Good) | 6.7 (Good) | 5.3 (Good) | 6 (Good) | 6 (Good) | 7.5 (Good) | 5.6 (Good) | 6.5 (Good) | 6.9 (Good) | 6 (Good) | 6.1 (Good) | 4.8 (Good) | 5.7 (Good) | 5.9 (Good) | 7.9 (Good) | 5.4 (Good) | 7 (Good) | 6.4 (Good) | 6.4 (Good) | 8.3 (Good) | 8.4 (Good) | 5.3 (Good) | 5.8 (Good) | 6.2 (Good) | 8.1 (Good) | 6 (Good) | 6.7 (Good) | 6.6 (Good) | 5.7 (Good) | 6.3 (Good) | 6.1 (Good) | 6.8 (Good) | 6 (Good) | 5.5 (Good) |
| no2 | 15 (Good) | 18 (Good) | 20 (Good) | 31 (Good) | 31 (Good) | 34 (Good) | 43 (Moderate) | 36 (Good) | 29 (Good) | 50 (Moderate) | 20 (Good) | 23 (Good) | 20 (Good) | 29 (Good) | 32 (Good) | 38 (Good) | 39 (Good) | 34 (Good) | 34 (Good) | 26 (Good) | 28 (Good) | 25 (Good) | 24 (Good) | 20 (Good) | 27 (Good) | 38 (Good) | 40 (Good) | 39 (Good) | 44 (Moderate) | 35 (Good) | 35 (Good) | 34 (Good) | 35 (Good) | 27 (Good) | 23 (Good) | 18 (Good) | 22 (Good) | 29 (Good) | 41 (Moderate) | 48 (Moderate) | 38 (Good) | 31 (Good) |
Green and Parks in the City
Tromsø 75%
Denmark: 78% Sweden: 84% Aland Islands: 75% Faroe Islands: 87% United Kingdom: 75%particulate matter PM2.5
Tromsø 7 (Good)
Pleasure of spending time in the city
Tromsø 96%
Denmark: 86% Sweden: 88% Aland Islands: 92% Faroe Islands: 100% United Kingdom: 70%particulate matter PM10
Tromsø 20 (Moderate)
Air Pollution
Tromsø 15%
Denmark: 18% Sweden: 15% Aland Islands: 17% Faroe Islands: 0% United Kingdom: 37%Garbage Disposal
Tromsø 89%
Denmark: 80% Sweden: 83% Aland Islands: 88% Faroe Islands: 88% United Kingdom: 60%Availability and quality of drinking water
Tromsø 98%
Denmark: 87% Sweden: 92% Aland Islands: 96% Faroe Islands: 98% United Kingdom: 75%Cleanliness and tidiness
Tromsø 75%
Denmark: 75% Sweden: 76% Aland Islands: 83% Faroe Islands: 94% United Kingdom: 53%Noise and Light pollution
Tromsø 39%
Denmark: 32% Sweden: 26% Aland Islands: 46% Faroe Islands: 21% United Kingdom: 47%Water Pollution
Tromsø 18%
Denmark: 19% Sweden: 15% Aland Islands: 10% Faroe Islands: 7.7% United Kingdom: 31%NO2 35 (Good)
nitrogen dioxide (NO2)PM10 12 (Good)
particulate matter (PM10) suspended dustPM2,5 8.2 (Good)
particulate matter (PM2.5) dustPM10 2.4 (Good)
particulate matter (PM10) suspended dustHansjordnesbukta
| index | 2024-04-15 | 2024-04-14 | 2024-04-13 | 2024-04-12 | 2024-04-11 | 2024-04-10 | 2024-04-09 | 2024-04-08 |
|---|---|---|---|---|---|---|---|---|
| pm10 | 9.2 | 9.7 | 4 | 30 | 9.5 | 7.6 | 5.2 | 6.4 |
| no2 | 15 | 10 | 18 | 15 | 32 | 49 | 26 | 22 |
| pm25 | 6.4 | 5.9 | 3.3 | 8 | 6.3 | 4.3 | 4 | 4.3 |
Rambergan
| index | 2024-04-12 | 2024-04-11 | 2024-04-10 | 2024-04-09 | 2024-04-08 |
|---|---|---|---|---|---|
| pm10 | 13 | 7.3 | 5.2 | 3.5 | 4.7 |
Hansjordnesbukta

| index | 2020-05 | 2020-04 | 2020-03 | 2020-02 | 2020-01 | 2019-12 | 2019-11 | 2019-10 | 2019-09 | 2019-08 | 2019-07 | 2019-06 | 2019-05 | 2019-04 | 2019-03 | 2019-02 | 2019-01 | 2018-12 | 2018-11 | 2018-10 | 2018-09 | 2018-08 | 2018-07 | 2018-06 | 2018-05 | 2018-04 | 2018-03 | 2018-02 | 2018-01 | 2017-12 | 2017-11 | 2017-10 | 2017-09 | 2017-08 | 2017-07 | 2017-06 | 2017-05 | 2017-04 | 2017-03 | 2017-02 | 2017-01 | 2016-12 |
|---|---|---|---|---|---|---|---|---|---|---|---|---|---|---|---|---|---|---|---|---|---|---|---|---|---|---|---|---|---|---|---|---|---|---|---|---|---|---|---|---|---|---|
| pm25 | 4.9 | 5.6 | 4.8 | 5.2 | 5.6 | 6.1 | 6.5 | 6.6 | 5.5 | 6.7 | 5.3 | 6 | 6 | 7.5 | 5.6 | 6.5 | 6.9 | 6 | 6.1 | 4.8 | 5.7 | 5.9 | 7.9 | 5.4 | 7 | 6.4 | 6.4 | 8.3 | 8.4 | 5.3 | 5.8 | 6.2 | 8.1 | 6 | 6.7 | 6.6 | 5.7 | 6.3 | 6.1 | 6.8 | 6 | 5.5 |
| pm10 | 26 | 22 | 9.7 | 9.4 | 11 | 11 | 10 | 30 | 17 | 21 | 18 | 19 | 29 | 38 | 11 | 12 | 16 | 19 | 14 | 22 | 15 | 17 | 22 | 16 | 36 | 24 | 11 | 18 | 16 | 9.6 | 15 | 23 | 30 | 19 | 17 | 25 | 26 | 37 | 11 | 13 | 12 | 13 |
| no2 | 15 | 18 | 20 | 31 | 31 | 34 | 43 | 36 | 29 | 50 | 20 | 23 | 20 | 29 | 32 | 38 | 39 | 34 | 34 | 26 | 28 | 25 | 24 | 20 | 27 | 38 | 40 | 39 | 44 | 35 | 35 | 34 | 35 | 27 | 23 | 18 | 22 | 29 | 41 | 48 | 38 | 31 |
Rambergan
| index | 2020-05 | 2020-04 | 2020-03 | 2020-02 | 2020-01 | 2019-12 | 2019-11 | 2019-10 | 2019-09 | 2019-08 | 2019-07 | 2019-06 | 2019-05 | 2019-04 | 2019-03 | 2019-02 | 2019-01 | 2018-12 | 2018-11 | 2018-10 | 2018-09 | 2018-08 | 2018-07 | 2018-06 | 2018-05 | 2018-04 | 2018-03 | 2018-02 | 2018-01 | 2017-12 |
|---|---|---|---|---|---|---|---|---|---|---|---|---|---|---|---|---|---|---|---|---|---|---|---|---|---|---|---|---|---|---|
| pm10 | 13 | 14 | 7.8 | 7.1 | 8.5 | 7.9 | 7.3 | 13 | 9.6 | 15 | 14 | 14 | 17 | 23 | 8.4 | 8.8 | 8.8 | 12 | 8.8 | 9.7 | 9.8 | 11 | 16 | 9.4 | 22 | 14 | 8 | 11 | 11 | 4.5 |
Tverrforbindelsen
| index | 2017-12 | 2017-11 | 2017-10 | 2017-09 | 2017-08 | 2017-07 | 2017-06 | 2017-05 | 2017-04 | 2017-03 | 2017-01 | 2016-12 |
|---|---|---|---|---|---|---|---|---|---|---|---|---|
| pm10 | 6.6 | 13 | 18 | 17 | 10 | 10 | 14 | 17 | 26 | 8.9 | 10 | 9.3 |