Air Pollution in Lindenheuvel: Real-time Air Quality Index and smog alert.
Pollution and air quality forecast for Lindenheuvel. Today is Sunday, June 21, 2026. The following air pollution values have been recorded for Lindenheuvel:- ozone (O3) - -1 (Good)
- particulate matter (PM2.5) dust - 31 (Moderate)
- particulate matter (PM10) suspended dust - 141 (Very Unhealthy)
- sulfur dioxide (SO2) - 7 (Good)
- nitrogen dioxide (NO2) - 89 (Moderate)
- carbon monoxide (CO) - 1700 (Good)
- black carbon (BC) - 1 (Good)

What is the air quality in Lindenheuvel today? Is the air polluted in Lindenheuvel?. Is there smog?
How is the O3 level today in Lindenheuvel? (ozone (O3))
-1 (Good)
What is the current level of PM2.5 in Lindenheuvel? (particulate matter (PM2.5) dust)
Today's PM2.5 level is:
31 (Moderate)
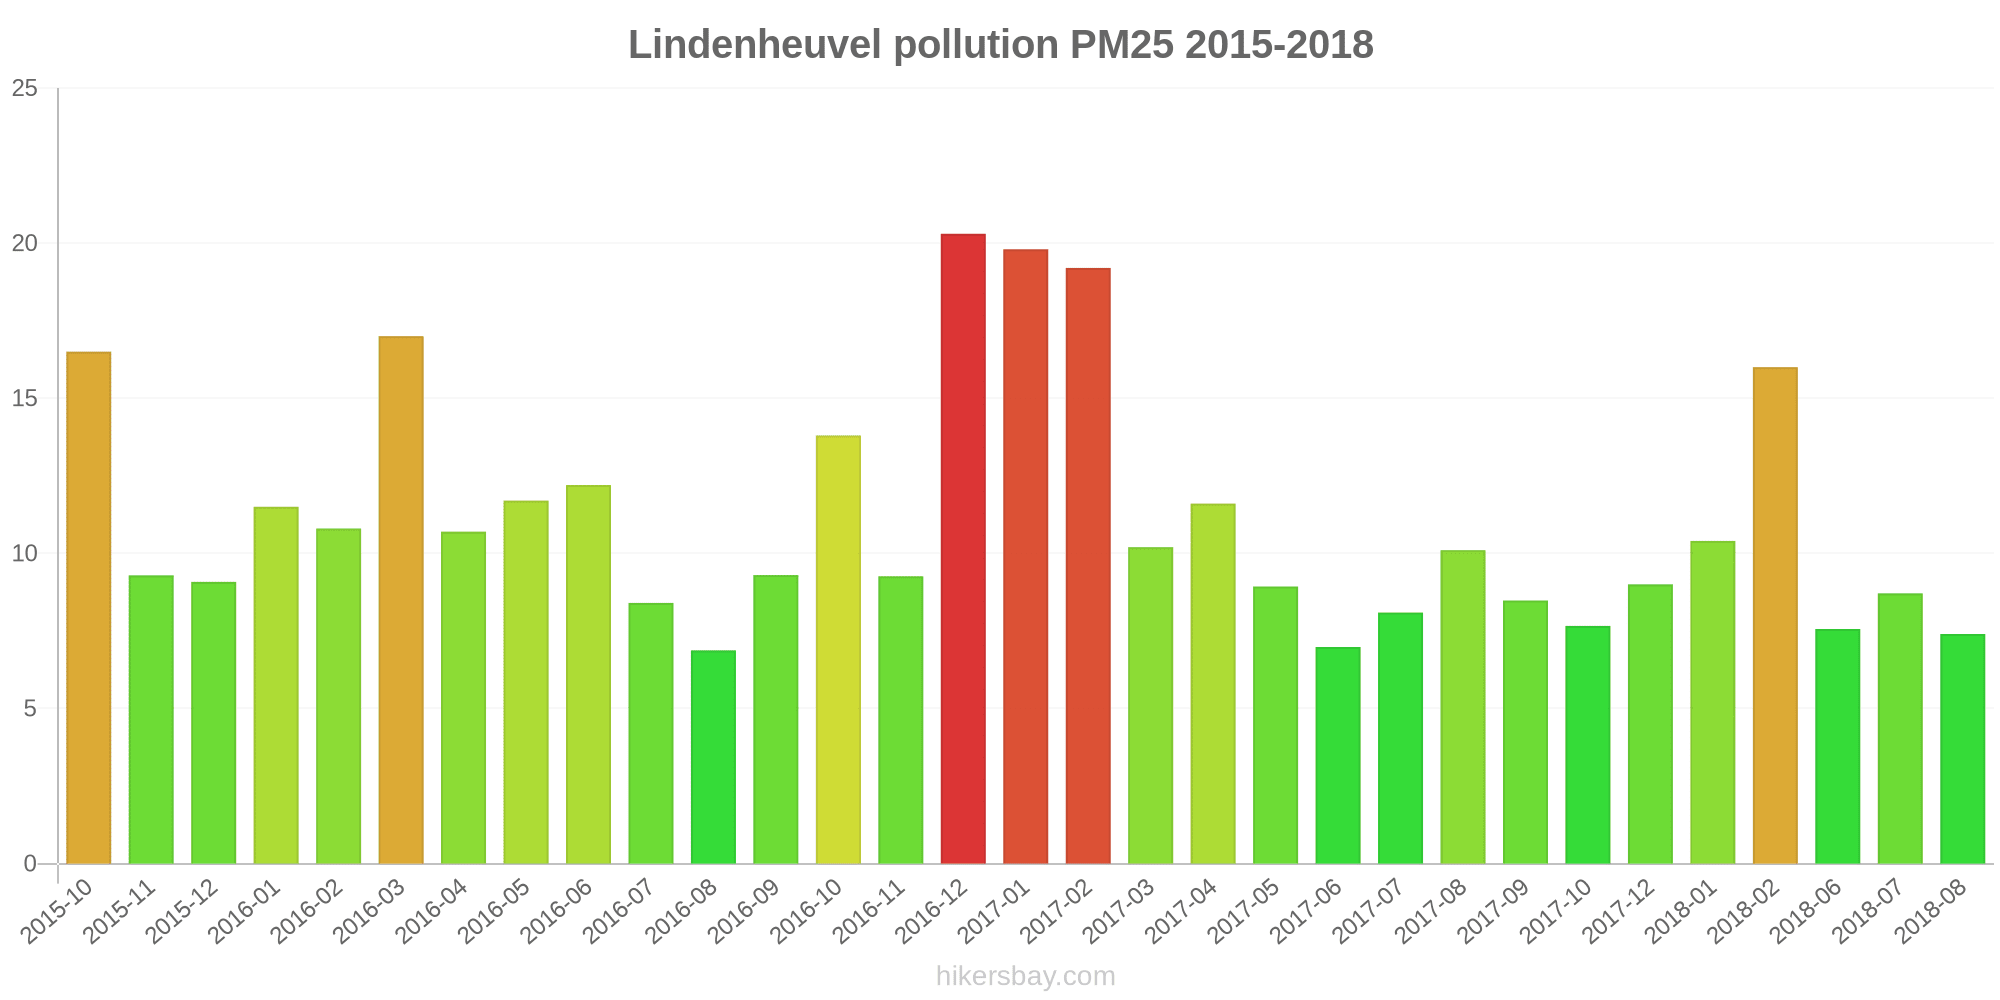
The highest PM2.5 values were recorded: 20 (December 2016).
The lowest level of particulate matter PM2.5 pollution occurs in month: August (6.9).
What is the level of PM10 today in Lindenheuvel? (particulate matter (PM10) suspended dust)
The current level of particulate matter PM10 in Lindenheuvel is:
141 (Very Unhealthy)
The highest PM10 values usually occur in month: 26 (December 2016).
The lowest value of particulate matter PM10 pollution in Lindenheuvel is usually recorded in: November (12).
What is the level of SO2 pollution? (sulfur dioxide (SO2))
7 (Good)
How high is the level of NO2? (nitrogen dioxide (NO2))
89 (Moderate)
How high is the CO level? (carbon monoxide (CO))
1700 (Good)
What is the level of black carbon pollution? (black carbon (BC))
1 (Good)
Current data Friday, May 27, 2022, 2:15 PM
O3 -1 (Good)
PM2,5 31 (Moderate)
PM10 141 (Very Unhealthy)
SO2 7 (Good)
NO2 89 (Moderate)
CO 1700 (Good)
BC 1 (Good)
Data on air pollution from recent days in Lindenheuvel
index
2022-05-27
o3
4
Good
pm25
-64
Good
pm10
-34
Good
so2
5
Good
no2
-121
Good
co
735
Good
bc
1
Good
data source »
Air pollution in Lindenheuvel from October 2015 to August 2018

index
2018-08
2018-07
2018-06
2018-02
2018-01
2017-12
2017-10
2017-09
2017-08
2017-07
2017-06
2017-05
2017-04
2017-03
2017-02
2017-01
2016-12
2016-11
2016-10
2016-09
2016-08
2016-07
2016-06
2016-05
2016-04
2016-03
2016-02
2016-01
2015-12
2015-11
2015-10
pm25
7.4 (Good)
8.7 (Good)
7.6 (Good)
16 (Moderate)
10 (Good)
9 (Good)
7.7 (Good)
8.5 (Good)
10 (Good)
8.1 (Good)
7 (Good)
8.9 (Good)
12 (Good)
10 (Good)
19 (Moderate)
20 (Moderate)
20 (Moderate)
9.3 (Good)
14 (Moderate)
9.3 (Good)
6.9 (Good)
8.4 (Good)
12 (Good)
12 (Good)
11 (Good)
17 (Moderate)
11 (Good)
12 (Good)
9.1 (Good)
9.3 (Good)
17 (Moderate)
pm10
20 (Good)
22 (Moderate)
20 (Moderate)
21 (Moderate)
15 (Good)
12 (Good)
15 (Good)
14 (Good)
17 (Good)
17 (Good)
17 (Good)
15 (Good)
18 (Good)
16 (Good)
23 (Moderate)
24 (Moderate)
26 (Moderate)
12 (Good)
19 (Good)
22 (Moderate)
17 (Good)
17 (Good)
21 (Moderate)
21 (Moderate)
17 (Good)
24 (Moderate)
15 (Good)
16 (Good)
15 (Good)
15 (Good)
24 (Moderate)
data source »
Geleen-Asterstraat
Friday, May 27, 2022, 2:15 PM
O3 -1 (Good)
ozone (O3)
PM2,5 31 (Moderate)
particulate matter (PM2.5) dust
PM10 141 (Very Unhealthy)
particulate matter (PM10) suspended dust
SO2 6.5 (Good)
sulfur dioxide (SO2)
NO2 89 (Moderate)
nitrogen dioxide (NO2)
CO 1700 (Good)
carbon monoxide (CO)
BC 1.4 (Good)
black carbon (BC)
Geleen-Asterstraat
index
2022-05-27
o3
3.7
pm25
-64
pm10
-34.08
so2
5.1
no2
-121.45
co
735
bc
1.4
Geleen-Asterstraat
2015-10 2018-08

index
2018-08
2018-07
2018-06
2018-02
2018-01
2017-12
2017-10
2017-09
2017-08
2017-07
2017-06
2017-05
2017-04
2017-03
2017-02
2017-01
2016-12
2016-11
2016-10
2016-09
2016-08
2016-07
2016-06
2016-05
2016-04
2016-03
2016-02
2016-01
2015-12
2015-11
2015-10
pm25
7.4
8.7
7.6
16
10
9
7.7
8.5
10
8.1
7
8.9
12
10
19
20
20
9.3
14
9.3
6.9
8.4
12
12
11
17
11
12
9.1
9.3
17
pm10
20
22
20
21
15
12
15
14
17
17
17
15
18
16
23
24
26
12
19
22
17
17
21
21
17
24
15
16
15
15
24
* Pollution data source:
https://openaq.org
(Netherlands)
The data is licensed under CC-By 4.0
O3 -1 (Good)
PM2,5 31 (Moderate)
PM10 141 (Very Unhealthy)
SO2 7 (Good)
NO2 89 (Moderate)
CO 1700 (Good)
BC 1 (Good)
Data on air pollution from recent days in Lindenheuvel
| index | 2022-05-27 |
|---|---|
| o3 | 4 Good |
| pm25 | -64 Good |
| pm10 | -34 Good |
| so2 | 5 Good |
| no2 | -121 Good |
| co | 735 Good |
| bc | 1 Good |
| index | 2018-08 | 2018-07 | 2018-06 | 2018-02 | 2018-01 | 2017-12 | 2017-10 | 2017-09 | 2017-08 | 2017-07 | 2017-06 | 2017-05 | 2017-04 | 2017-03 | 2017-02 | 2017-01 | 2016-12 | 2016-11 | 2016-10 | 2016-09 | 2016-08 | 2016-07 | 2016-06 | 2016-05 | 2016-04 | 2016-03 | 2016-02 | 2016-01 | 2015-12 | 2015-11 | 2015-10 |
|---|---|---|---|---|---|---|---|---|---|---|---|---|---|---|---|---|---|---|---|---|---|---|---|---|---|---|---|---|---|---|---|
| pm25 | 7.4 (Good) | 8.7 (Good) | 7.6 (Good) | 16 (Moderate) | 10 (Good) | 9 (Good) | 7.7 (Good) | 8.5 (Good) | 10 (Good) | 8.1 (Good) | 7 (Good) | 8.9 (Good) | 12 (Good) | 10 (Good) | 19 (Moderate) | 20 (Moderate) | 20 (Moderate) | 9.3 (Good) | 14 (Moderate) | 9.3 (Good) | 6.9 (Good) | 8.4 (Good) | 12 (Good) | 12 (Good) | 11 (Good) | 17 (Moderate) | 11 (Good) | 12 (Good) | 9.1 (Good) | 9.3 (Good) | 17 (Moderate) |
| pm10 | 20 (Good) | 22 (Moderate) | 20 (Moderate) | 21 (Moderate) | 15 (Good) | 12 (Good) | 15 (Good) | 14 (Good) | 17 (Good) | 17 (Good) | 17 (Good) | 15 (Good) | 18 (Good) | 16 (Good) | 23 (Moderate) | 24 (Moderate) | 26 (Moderate) | 12 (Good) | 19 (Good) | 22 (Moderate) | 17 (Good) | 17 (Good) | 21 (Moderate) | 21 (Moderate) | 17 (Good) | 24 (Moderate) | 15 (Good) | 16 (Good) | 15 (Good) | 15 (Good) | 24 (Moderate) |
O3 -1 (Good)
ozone (O3)PM2,5 31 (Moderate)
particulate matter (PM2.5) dustPM10 141 (Very Unhealthy)
particulate matter (PM10) suspended dustSO2 6.5 (Good)
sulfur dioxide (SO2)NO2 89 (Moderate)
nitrogen dioxide (NO2)CO 1700 (Good)
carbon monoxide (CO)BC 1.4 (Good)
black carbon (BC)Geleen-Asterstraat
| index | 2022-05-27 |
|---|---|
| o3 | 3.7 |
| pm25 | -64 |
| pm10 | -34.08 |
| so2 | 5.1 |
| no2 | -121.45 |
| co | 735 |
| bc | 1.4 |
Geleen-Asterstraat

| index | 2018-08 | 2018-07 | 2018-06 | 2018-02 | 2018-01 | 2017-12 | 2017-10 | 2017-09 | 2017-08 | 2017-07 | 2017-06 | 2017-05 | 2017-04 | 2017-03 | 2017-02 | 2017-01 | 2016-12 | 2016-11 | 2016-10 | 2016-09 | 2016-08 | 2016-07 | 2016-06 | 2016-05 | 2016-04 | 2016-03 | 2016-02 | 2016-01 | 2015-12 | 2015-11 | 2015-10 |
|---|---|---|---|---|---|---|---|---|---|---|---|---|---|---|---|---|---|---|---|---|---|---|---|---|---|---|---|---|---|---|---|
| pm25 | 7.4 | 8.7 | 7.6 | 16 | 10 | 9 | 7.7 | 8.5 | 10 | 8.1 | 7 | 8.9 | 12 | 10 | 19 | 20 | 20 | 9.3 | 14 | 9.3 | 6.9 | 8.4 | 12 | 12 | 11 | 17 | 11 | 12 | 9.1 | 9.3 | 17 |
| pm10 | 20 | 22 | 20 | 21 | 15 | 12 | 15 | 14 | 17 | 17 | 17 | 15 | 18 | 16 | 23 | 24 | 26 | 12 | 19 | 22 | 17 | 17 | 21 | 21 | 17 | 24 | 15 | 16 | 15 | 15 | 24 |