Air Pollution in Vinkebrug: Real-time Air Quality Index and smog alert.
Pollution and air quality forecast for Vinkebrug. Today is Sunday, June 21, 2026. The following air pollution values have been recorded for Vinkebrug:- particulate matter (PM2.5) dust - 6 (Good)
- particulate matter (PM10) suspended dust - 12 (Good)
- nitrogen dioxide (NO2) - 2 (Good)

What is the air quality in Vinkebrug today? Is the air polluted in Vinkebrug?. Is there smog?
What is the current level of PM2.5 in Vinkebrug? (particulate matter (PM2.5) dust)
Today's PM2.5 level is:
6 (Good)
For comparison, the highest level of PM2.5 in Vinkebrug in the last 7 days was: 6 (Tuesday, April 16, 2024) and the lowest: 4 (Tuesday, April 9, 2024).
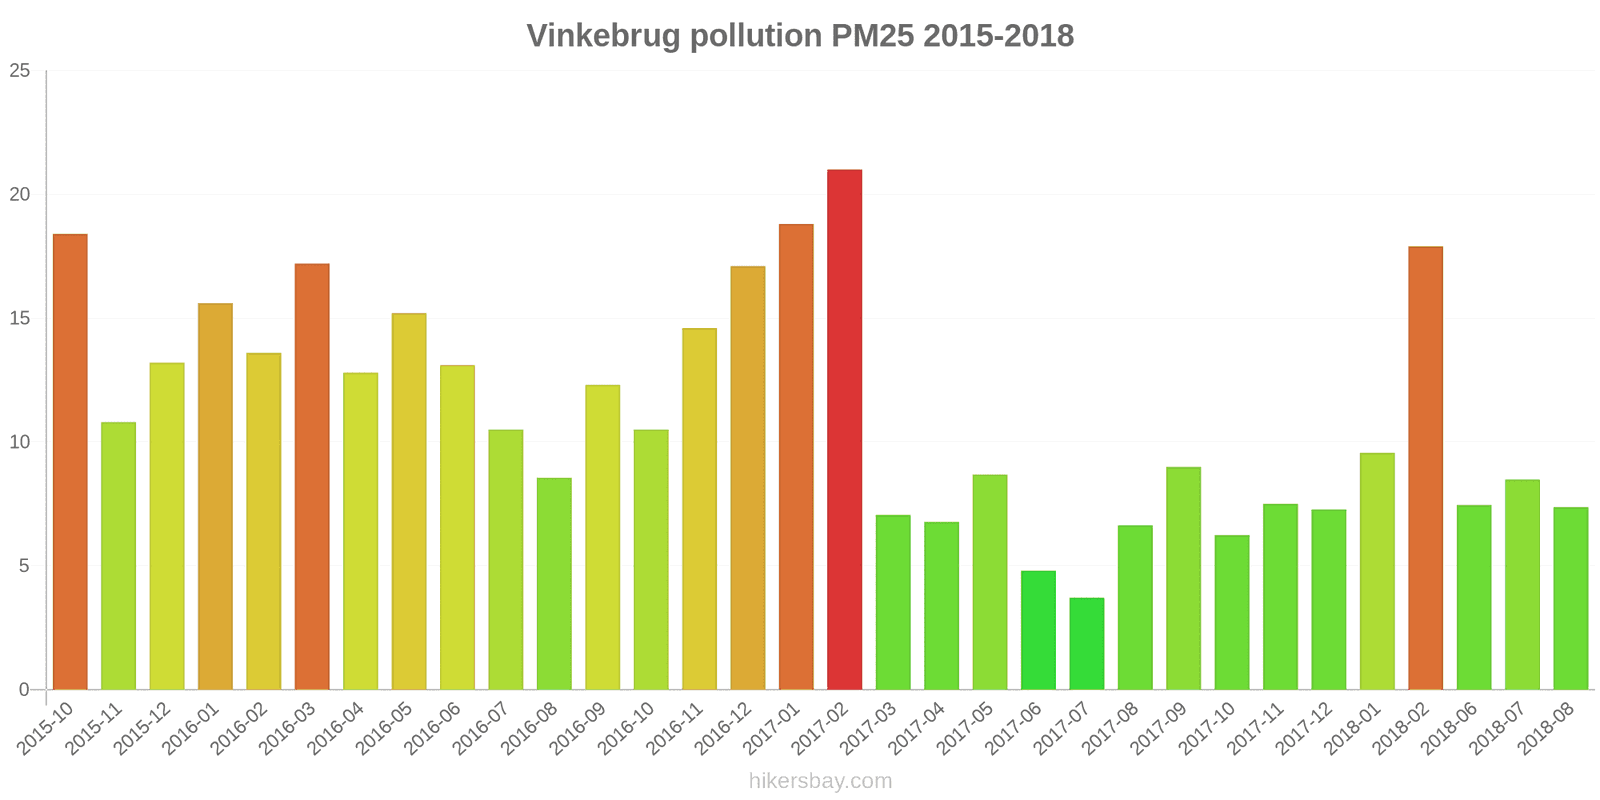
The highest PM2.5 values were recorded: 21 (February 2017).
The lowest level of particulate matter PM2.5 pollution occurs in month: July (3.7).
What is the level of PM10 today in Vinkebrug? (particulate matter (PM10) suspended dust)
The current level of particulate matter PM10 in Vinkebrug is:
12 (Good)
The highest PM10 values usually occur in month: 26 (February 2017).
The lowest value of particulate matter PM10 pollution in Vinkebrug is usually recorded in: July (11).
How high is the level of NO2? (nitrogen dioxide (NO2))
2 (Good)
Current data Tuesday, April 16, 2024, 1:00 AM
PM2,5 6 (Good)
PM10 12 (Good)
NO2 2 (Good)
Data on air pollution from recent days in Vinkebrug
index
2024-04-09
2024-04-10
2024-04-11
2024-04-12
2024-04-13
2024-04-14
2024-04-15
2024-04-16
no2
5
Good
5
Good
7
Good
6
Good
8
Good
6
Good
6
Good
2
Good
pm25
4
Good
5
Good
5
Good
5
Good
4
Good
4
Good
4
Good
6
Good
pm10
9
Good
11
Good
8
Good
8
Good
8
Good
9
Good
9
Good
12
Good
data source »
Air pollution in Vinkebrug from October 2015 to August 2018
index
2018-08
2018-07
2018-06
2018-02
2018-01
2017-12
2017-11
2017-10
2017-09
2017-08
2017-07
2017-06
2017-05
2017-04
2017-03
2017-02
2017-01
2016-12
2016-11
2016-10
2016-09
2016-08
2016-07
2016-06
2016-05
2016-04
2016-03
2016-02
2016-01
2015-12
2015-11
2015-10
pm25
7.4 (Good)
8.5 (Good)
7.5 (Good)
18 (Moderate)
9.6 (Good)
7.3 (Good)
7.5 (Good)
6.2 (Good)
9 (Good)
6.6 (Good)
3.7 (Good)
4.8 (Good)
8.7 (Good)
6.8 (Good)
7 (Good)
21 (Moderate)
19 (Moderate)
17 (Moderate)
15 (Moderate)
11 (Good)
12 (Good)
8.6 (Good)
11 (Good)
13 (Moderate)
15 (Moderate)
13 (Good)
17 (Moderate)
14 (Moderate)
16 (Moderate)
13 (Moderate)
11 (Good)
18 (Moderate)
pm10
12 (Good)
15 (Good)
15 (Good)
23 (Moderate)
13 (Good)
11 (Good)
13 (Good)
13 (Good)
14 (Good)
19 (Good)
11 (Good)
12 (Good)
14 (Good)
14 (Good)
17 (Good)
26 (Moderate)
25 (Moderate)
23 (Moderate)
15 (Good)
15 (Good)
19 (Good)
17 (Good)
15 (Good)
18 (Good)
17 (Good)
13 (Good)
18 (Good)
14 (Good)
18 (Good)
20 (Good)
17 (Good)
24 (Moderate)
no2
- (Good)
9.6 (Good)
13 (Good)
- (Good)
- (Good)
- (Good)
- (Good)
- (Good)
- (Good)
- (Good)
- (Good)
- (Good)
- (Good)
- (Good)
- (Good)
- (Good)
- (Good)
- (Good)
- (Good)
- (Good)
- (Good)
- (Good)
- (Good)
13 (Good)
13 (Good)
17 (Good)
15 (Good)
19 (Good)
25 (Good)
22 (Good)
20 (Good)
24 (Good)
data source »
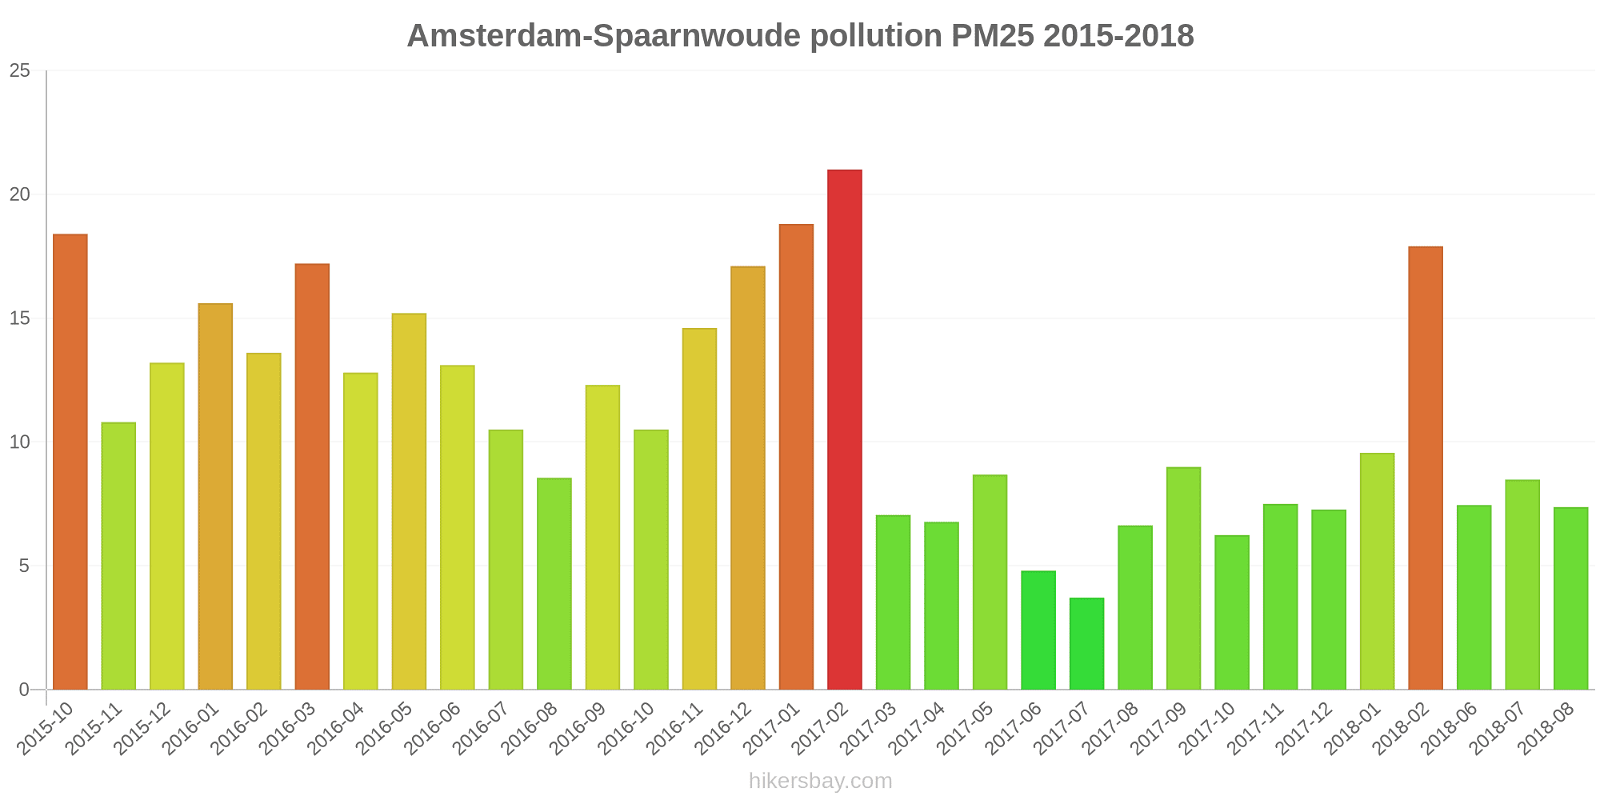
Amsterdam-Spaarnwoude
Tuesday, April 16, 2024, 1:00 AM
PM2,5 5.6 (Good)
particulate matter (PM2.5) dust
PM10 12 (Good)
particulate matter (PM10) suspended dust
NO2 2.3 (Good)
nitrogen dioxide (NO2)
Amsterdam-Spaarnwoude
index
2024-04-16
2024-04-15
2024-04-14
2024-04-13
2024-04-12
2024-04-11
2024-04-10
2024-04-09
no2
2.1
6.1
6
7.9
5.9
7.2
5.2
5.3
pm25
5.8
3.7
4.1
3.9
4.9
5.2
4.6
4.4
pm10
12
9
9.3
8.2
8.4
7.9
11
9.1
Amsterdam-Spaarnwoude
2015-10 2018-08
index
2018-08
2018-07
2018-06
2018-02
2018-01
2017-12
2017-11
2017-10
2017-09
2017-08
2017-07
2017-06
2017-05
2017-04
2017-03
2017-02
2017-01
2016-12
2016-11
2016-10
2016-09
2016-08
2016-07
2016-06
2016-05
2016-04
2016-03
2016-02
2016-01
2015-12
2015-11
2015-10
no2
-
9.6
13
-
-
-
-
-
-
-
-
-
-
-
-
-
-
-
-
-
-
-
-
13
13
17
15
19
25
22
20
24
pm25
7.4
8.5
7.5
18
9.6
7.3
7.5
6.2
9
6.6
3.7
4.8
8.7
6.8
7
21
19
17
15
11
12
8.6
11
13
15
13
17
14
16
13
11
18
pm10
12
15
15
23
13
11
13
13
14
19
11
12
14
14
17
26
25
23
15
15
19
17
15
18
17
13
18
14
18
20
17
24
* Pollution data source:
https://openaq.org
(Netherlands)
The data is licensed under CC-By 4.0
PM2,5 6 (Good)
PM10 12 (Good)
NO2 2 (Good)
Data on air pollution from recent days in Vinkebrug
| index | 2024-04-09 | 2024-04-10 | 2024-04-11 | 2024-04-12 | 2024-04-13 | 2024-04-14 | 2024-04-15 | 2024-04-16 |
|---|---|---|---|---|---|---|---|---|
| no2 | 5 Good |
5 Good |
7 Good |
6 Good |
8 Good |
6 Good |
6 Good |
2 Good |
| pm25 | 4 Good |
5 Good |
5 Good |
5 Good |
4 Good |
4 Good |
4 Good |
6 Good |
| pm10 | 9 Good |
11 Good |
8 Good |
8 Good |
8 Good |
9 Good |
9 Good |
12 Good |

| index | 2018-08 | 2018-07 | 2018-06 | 2018-02 | 2018-01 | 2017-12 | 2017-11 | 2017-10 | 2017-09 | 2017-08 | 2017-07 | 2017-06 | 2017-05 | 2017-04 | 2017-03 | 2017-02 | 2017-01 | 2016-12 | 2016-11 | 2016-10 | 2016-09 | 2016-08 | 2016-07 | 2016-06 | 2016-05 | 2016-04 | 2016-03 | 2016-02 | 2016-01 | 2015-12 | 2015-11 | 2015-10 |
|---|---|---|---|---|---|---|---|---|---|---|---|---|---|---|---|---|---|---|---|---|---|---|---|---|---|---|---|---|---|---|---|---|
| pm25 | 7.4 (Good) | 8.5 (Good) | 7.5 (Good) | 18 (Moderate) | 9.6 (Good) | 7.3 (Good) | 7.5 (Good) | 6.2 (Good) | 9 (Good) | 6.6 (Good) | 3.7 (Good) | 4.8 (Good) | 8.7 (Good) | 6.8 (Good) | 7 (Good) | 21 (Moderate) | 19 (Moderate) | 17 (Moderate) | 15 (Moderate) | 11 (Good) | 12 (Good) | 8.6 (Good) | 11 (Good) | 13 (Moderate) | 15 (Moderate) | 13 (Good) | 17 (Moderate) | 14 (Moderate) | 16 (Moderate) | 13 (Moderate) | 11 (Good) | 18 (Moderate) |
| pm10 | 12 (Good) | 15 (Good) | 15 (Good) | 23 (Moderate) | 13 (Good) | 11 (Good) | 13 (Good) | 13 (Good) | 14 (Good) | 19 (Good) | 11 (Good) | 12 (Good) | 14 (Good) | 14 (Good) | 17 (Good) | 26 (Moderate) | 25 (Moderate) | 23 (Moderate) | 15 (Good) | 15 (Good) | 19 (Good) | 17 (Good) | 15 (Good) | 18 (Good) | 17 (Good) | 13 (Good) | 18 (Good) | 14 (Good) | 18 (Good) | 20 (Good) | 17 (Good) | 24 (Moderate) |
| no2 | - (Good) | 9.6 (Good) | 13 (Good) | - (Good) | - (Good) | - (Good) | - (Good) | - (Good) | - (Good) | - (Good) | - (Good) | - (Good) | - (Good) | - (Good) | - (Good) | - (Good) | - (Good) | - (Good) | - (Good) | - (Good) | - (Good) | - (Good) | - (Good) | 13 (Good) | 13 (Good) | 17 (Good) | 15 (Good) | 19 (Good) | 25 (Good) | 22 (Good) | 20 (Good) | 24 (Good) |
PM2,5 5.6 (Good)
particulate matter (PM2.5) dustPM10 12 (Good)
particulate matter (PM10) suspended dustNO2 2.3 (Good)
nitrogen dioxide (NO2)Amsterdam-Spaarnwoude
| index | 2024-04-16 | 2024-04-15 | 2024-04-14 | 2024-04-13 | 2024-04-12 | 2024-04-11 | 2024-04-10 | 2024-04-09 |
|---|---|---|---|---|---|---|---|---|
| no2 | 2.1 | 6.1 | 6 | 7.9 | 5.9 | 7.2 | 5.2 | 5.3 |
| pm25 | 5.8 | 3.7 | 4.1 | 3.9 | 4.9 | 5.2 | 4.6 | 4.4 |
| pm10 | 12 | 9 | 9.3 | 8.2 | 8.4 | 7.9 | 11 | 9.1 |
Amsterdam-Spaarnwoude

| index | 2018-08 | 2018-07 | 2018-06 | 2018-02 | 2018-01 | 2017-12 | 2017-11 | 2017-10 | 2017-09 | 2017-08 | 2017-07 | 2017-06 | 2017-05 | 2017-04 | 2017-03 | 2017-02 | 2017-01 | 2016-12 | 2016-11 | 2016-10 | 2016-09 | 2016-08 | 2016-07 | 2016-06 | 2016-05 | 2016-04 | 2016-03 | 2016-02 | 2016-01 | 2015-12 | 2015-11 | 2015-10 |
|---|---|---|---|---|---|---|---|---|---|---|---|---|---|---|---|---|---|---|---|---|---|---|---|---|---|---|---|---|---|---|---|---|
| no2 | - | 9.6 | 13 | - | - | - | - | - | - | - | - | - | - | - | - | - | - | - | - | - | - | - | - | 13 | 13 | 17 | 15 | 19 | 25 | 22 | 20 | 24 |
| pm25 | 7.4 | 8.5 | 7.5 | 18 | 9.6 | 7.3 | 7.5 | 6.2 | 9 | 6.6 | 3.7 | 4.8 | 8.7 | 6.8 | 7 | 21 | 19 | 17 | 15 | 11 | 12 | 8.6 | 11 | 13 | 15 | 13 | 17 | 14 | 16 | 13 | 11 | 18 |
| pm10 | 12 | 15 | 15 | 23 | 13 | 11 | 13 | 13 | 14 | 19 | 11 | 12 | 14 | 14 | 17 | 26 | 25 | 23 | 15 | 15 | 19 | 17 | 15 | 18 | 17 | 13 | 18 | 14 | 18 | 20 | 17 | 24 |