Air Pollution in Province 3: Real-time Air Quality Index and smog alert.
Pollution and air quality forecast for Province 3. Today is Sunday, February 8, 2026. The following air pollution values have been recorded for Province 3:- particulate matter (PM2.5) dust - -273 (Good)
- ozone (O3) - -1 (Good)

What is the air quality in Province 3 today? Is the air polluted in Province 3?. Is there smog?
What is the current level of PM2.5 in Province 3? (particulate matter (PM2.5) dust)
Today's PM2.5 level is:
-273 (Good)
For comparison, the highest level of PM2.5 in Province 3 in the last 7 days was: 104 (Wednesday, January 31, 2024) and the lowest: -999 (Saturday, December 23, 2023).
The highest PM2.5 values were recorded: 100 (February 2018).
The lowest level of particulate matter PM2.5 pollution occurs in month: August (14).
How is the O3 level today in Province 3? (ozone (O3))
-1 (Good)
Current data Wednesday, January 17, 2024, 10:00 AM
PM2,5 -273 (Good)
O3 -1 (Good)
Data on air pollution from recent days in Province 3
index
2023-12-23
2023-12-24
2023-12-25
2023-12-26
2023-12-27
2023-12-28
2023-12-29
2023-12-30
2024-01-31
2024-02-01
2024-02-02
2024-02-03
2024-02-04
2024-02-05
2024-02-06
2024-02-07
2024-01-10
2024-01-11
2024-01-12
2024-01-13
2024-01-14
2024-01-15
2024-01-16
2024-01-17
pm25
-999
Good
-999
Good
-999
Good
-999
Good
-999
Good
-756
Good
-442
Good
-285
Good
104
Very Unhealthy
73
Unhealthy
57
Unhealthy
61
Unhealthy
93
Very Unhealthy
79
Very Unhealthy
63
Unhealthy
84
Very Unhealthy
-50
Good
-772
Good
92
Very Unhealthy
92
Very Unhealthy
47
Unhealthy for Sensitive Groups
92
Very Unhealthy
92
Very Unhealthy
92
Very Unhealthy
o3
-1
Good
-1
Good
-1
Good
-1
Good
-1
Good
-1
Good
-1
Good
-1
Good
0
Good
0
Good
0
Good
0
Good
0
Good
0
Good
0
Good
0
Good
-1
Good
-1
Good
-1
Good
-1
Good
-1
Good
-1
Good
-1
Good
-1
Good
data source »
Air pollution in Province 3 from April 2017 to May 2020
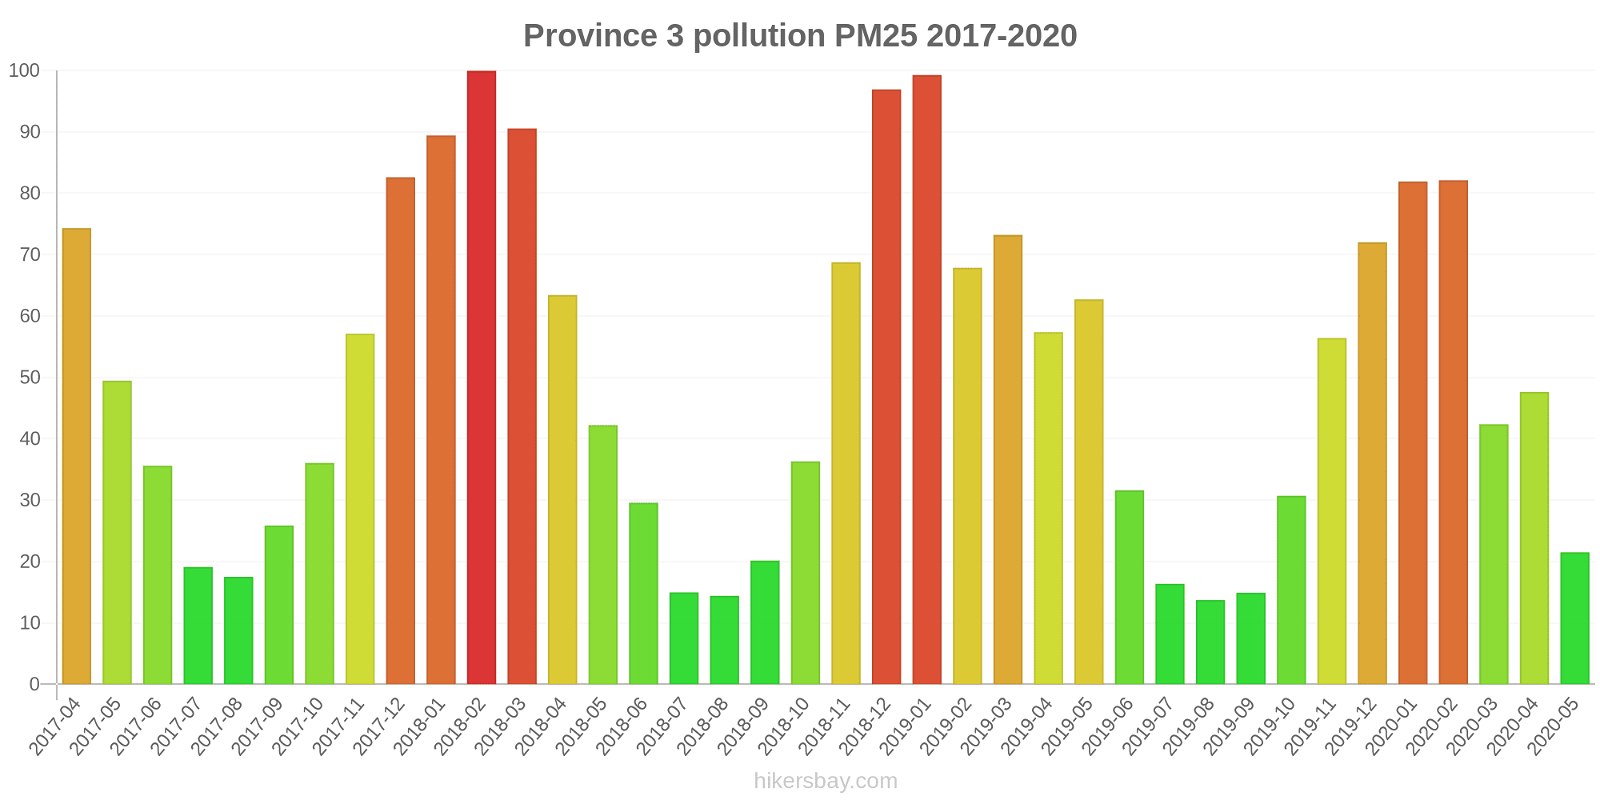
index
2020-05
2020-04
2020-03
2020-02
2020-01
2019-12
2019-11
2019-10
2019-09
2019-08
2019-07
2019-06
2019-05
2019-04
2019-03
2019-02
2019-01
2018-12
2018-11
2018-10
2018-09
2018-08
2018-07
2018-06
2018-05
2018-04
2018-03
2018-02
2018-01
2017-12
2017-11
2017-10
2017-09
2017-08
2017-07
2017-06
2017-05
2017-04
o3:ppm
0.03 (Good)
0.04 (Good)
0.03 (Good)
0.02 (Good)
0.01 (Good)
0.02 (Good)
0.02 (Good)
0.02 (Good)
0.01 (Good)
0.02 (Good)
0.02 (Good)
0.04 (Good)
0.05 (Good)
0.03 (Good)
0.03 (Good)
0.02 (Good)
0.01 (Good)
0.01 (Good)
0.02 (Good)
0.03 (Good)
0.02 (Good)
0.02 (Good)
0.02 (Good)
0.03 (Good)
0.04 (Good)
0.04 (Good)
0.04 (Good)
0.02 (Good)
0.02 (Good)
0.02 (Good)
0.02 (Good)
0.02 (Good)
0.02 (Good)
0.01 (Good)
0.01 (Good)
0.04 (Good)
0.04 (Good)
0.04 (Good)
pm25
22 (Moderate)
48 (Unhealthy for Sensitive Groups)
42 (Unhealthy for Sensitive Groups)
82 (Very Unhealthy)
82 (Very Unhealthy)
72 (Unhealthy)
56 (Unhealthy)
31 (Moderate)
15 (Moderate)
14 (Moderate)
16 (Moderate)
32 (Moderate)
63 (Unhealthy)
57 (Unhealthy)
73 (Unhealthy)
68 (Unhealthy)
99 (Very Unhealthy)
97 (Very Unhealthy)
69 (Unhealthy)
36 (Unhealthy for Sensitive Groups)
20 (Moderate)
14 (Moderate)
15 (Moderate)
30 (Moderate)
42 (Unhealthy for Sensitive Groups)
63 (Unhealthy)
91 (Very Unhealthy)
100 (Very Unhealthy)
89 (Very Unhealthy)
83 (Very Unhealthy)
57 (Unhealthy)
36 (Unhealthy for Sensitive Groups)
26 (Moderate)
18 (Moderate)
19 (Moderate)
36 (Unhealthy for Sensitive Groups)
49 (Unhealthy for Sensitive Groups)
74 (Unhealthy)
data source »
Quality of life in Province 3
Green and Parks in the City
Province 3
47%
Bhutan: 82%
Bangladesh: 33%
India: 48%
Myanmar: 33%
Pakistan: 49%
Pleasure of spending time in the city
Province 3
41%
Bhutan: 61%
Bangladesh: 26%
India: 40%
Myanmar: 24%
Pakistan: 43%
Air Pollution
Province 3
70%
Bhutan: 45%
Bangladesh: 78%
India: 65%
Myanmar: 83%
Pakistan: 64%
Garbage Disposal
Province 3
30%
Bhutan: 47%
Bangladesh: 22%
India: 34%
Myanmar: 12%
Pakistan: 34%
Availability and quality of drinking water
Province 3
44%
Bhutan: 64%
Bangladesh: 44%
India: 48%
Myanmar: 34%
Pakistan: 44%
Cleanliness and tidiness
Province 3
35%
Bhutan: 57%
Bangladesh: 23%
India: 37%
Myanmar: 18%
Pakistan: 40%
Noise and Light pollution
Province 3
55%
Bhutan: 55%
Bangladesh: 63%
India: 59%
Myanmar: 52%
Pakistan: 59%
Water Pollution
Province 3
79%
Bhutan: 56%
Bangladesh: 74%
India: 69%
Myanmar: 74%
Pakistan: 70%
particulate matter PM2.5
Province 3
49 (Unhealthy for Sensitive Groups)
particulate matter PM10
Province 3
87 (Unhealthy)
Source: Numbeo
Saturday, December 30, 2023, 8:00 AM
PM2,5 -999 (Good)
particulate matter (PM2.5) dust
O3 -1 (Good)
ozone (O3)
US Diplomatic Post: Embassy Kathmandu
Wednesday, February 7, 2024, 7:00 AM
O3 0.04 (Good)
ozone (O3)
PM2,5 88 (Very Unhealthy)
particulate matter (PM2.5) dust
US Diplomatic Post: Phora Durbar Kathmandu
Wednesday, January 17, 2024, 10:00 AM
PM2,5 92 (Very Unhealthy)
particulate matter (PM2.5) dust
O3 -1 (Good)
ozone (O3)
index
2023-12-30
2023-12-29
2023-12-28
2023-12-27
2023-12-26
2023-12-25
2023-12-24
2023-12-23
pm25
-285.22
-441.85
-755.79
-999
-999
-999
-999
-999
o3
-1
-1
-1
-1
-1
-1
-1
-1
US Diplomatic Post: Embassy Kathmandu
index
2024-02-07
2024-02-06
2024-02-05
2024-02-04
2024-02-03
2024-02-02
2024-02-01
2024-01-31
o3
-0.11
0.02
0.02
0.02
-0.02
0.02
0.01
0.03
pm25
84
63
79
93
61
57
73
104
US Diplomatic Post: Phora Durbar Kathmandu
index
2024-01-17
2024-01-16
2024-01-15
2024-01-14
2024-01-13
2024-01-12
2024-01-11
2024-01-10
pm25
92
92
92
47
92
92
-771.71
-50.3
o3
-1
-1
-1
-1
-1
-1
-1
-1
US Diplomatic Post: Embassy Kathmandu
2017-04 2020-05
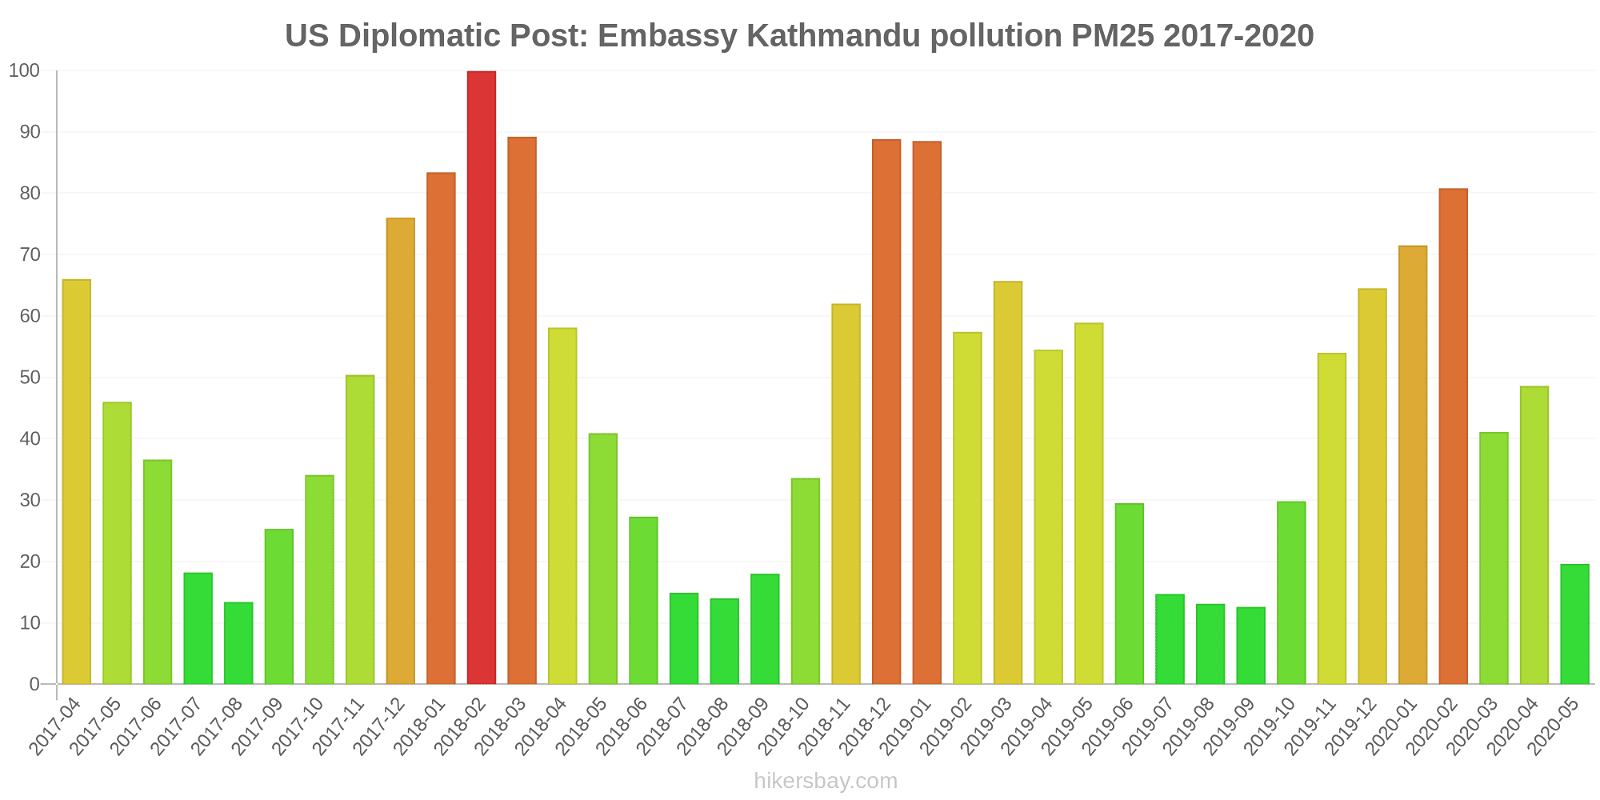
index
2020-05
2020-04
2020-03
2020-02
2020-01
2019-12
2019-11
2019-10
2019-09
2019-08
2019-07
2019-06
2019-05
2019-04
2019-03
2019-02
2019-01
2018-12
2018-11
2018-10
2018-09
2018-08
2018-07
2018-06
2018-05
2018-04
2018-03
2018-02
2018-01
2017-12
2017-11
2017-10
2017-09
2017-08
2017-07
2017-06
2017-05
2017-04
pm25
20
49
41
81
72
65
54
30
13
13
15
30
59
55
66
57
89
89
62
34
18
14
15
27
41
58
89
100
83
76
50
34
25
13
18
37
46
66
o3:ppm
0.04
0.05
0.03
0.01
0.02
0.02
0.02
0.02
0.02
0.02
0.03
0.04
0.05
0.04
0.04
0.02
0.01
0.01
0.02
0.03
0.02
0.02
0.02
0.04
0.04
0.04
0.04
0.02
0.02
0.02
0.02
0
0
0
0
0.04
0.05
0.04
US Diplomatic Post: Phora Durbar Kathmandu
2017-04 2020-05
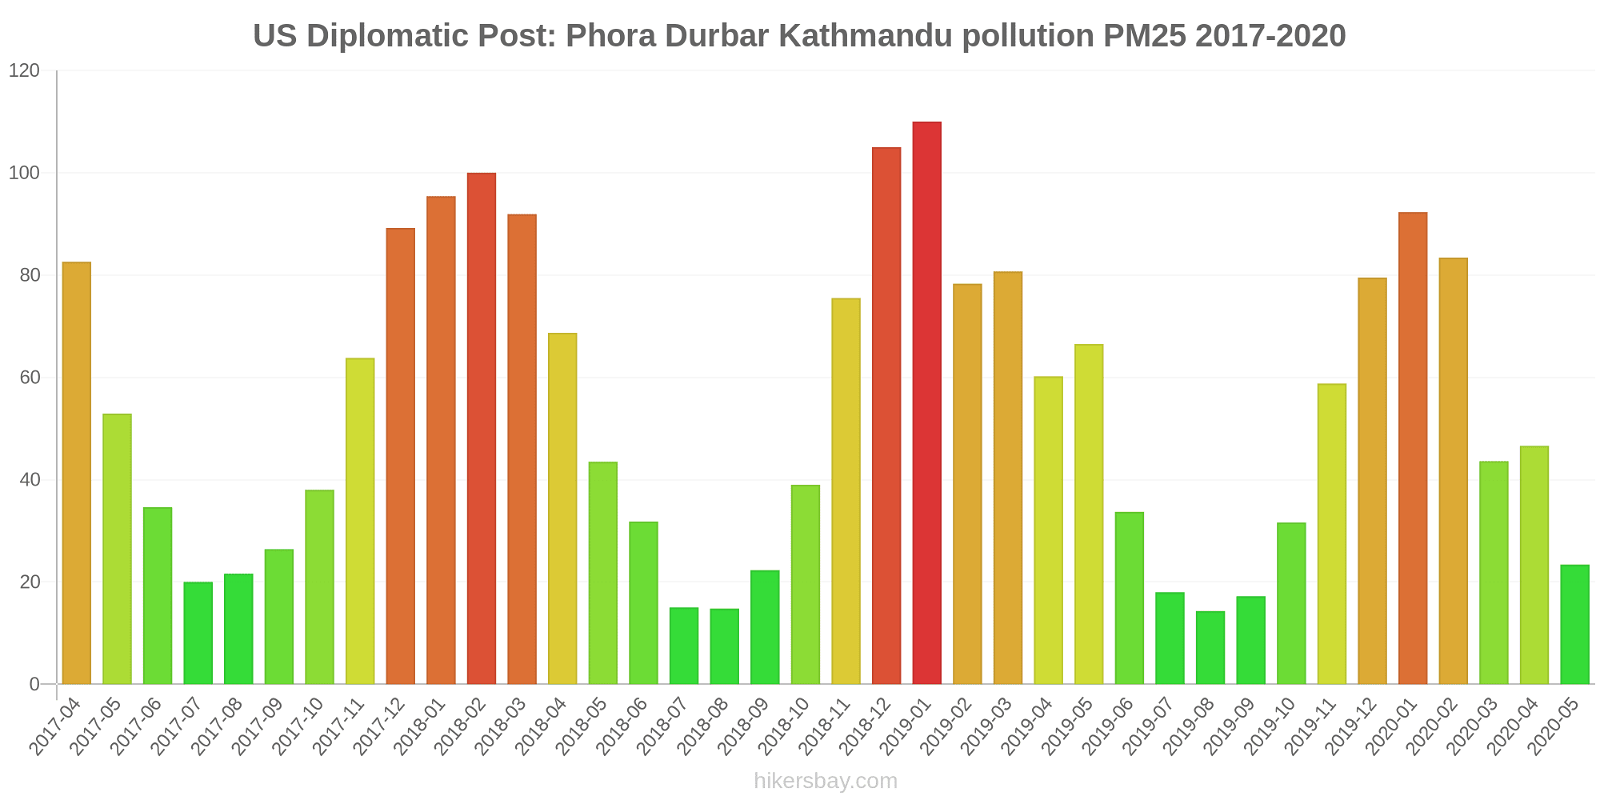
index
2020-05
2020-04
2020-03
2020-02
2020-01
2019-12
2019-11
2019-10
2019-09
2019-08
2019-07
2019-06
2019-05
2019-04
2019-03
2019-02
2019-01
2018-12
2018-11
2018-10
2018-09
2018-08
2018-07
2018-06
2018-05
2018-04
2018-03
2018-02
2018-01
2017-12
2017-11
2017-10
2017-09
2017-08
2017-07
2017-06
2017-05
2017-04
pm25
23
47
44
83
92
80
59
32
17
14
18
34
67
60
81
78
110
105
76
39
22
15
15
32
44
69
92
100
95
89
64
38
26
22
20
35
53
83
o3:ppm
0.02
0.03
0.02
0.02
0.01
0.01
0.01
0.02
0.01
0.02
0.02
0.03
0.04
0.03
0.03
0.02
0.01
0.01
0.01
0.02
0.02
0.01
0.01
0.03
0.03
0.03
0.03
0.02
0.02
0.02
0.03
0.03
0.03
0.02
0.02
0.04
0.04
0.04
* Pollution data source:
https://openaq.org
(StateAir_Kathmandu, StateAir_PhoraDurbar)
The data is licensed under CC-By 4.0
PM2,5 -273 (Good)
O3 -1 (Good)
Data on air pollution from recent days in Province 3
| index | 2023-12-23 | 2023-12-24 | 2023-12-25 | 2023-12-26 | 2023-12-27 | 2023-12-28 | 2023-12-29 | 2023-12-30 | 2024-01-31 | 2024-02-01 | 2024-02-02 | 2024-02-03 | 2024-02-04 | 2024-02-05 | 2024-02-06 | 2024-02-07 | 2024-01-10 | 2024-01-11 | 2024-01-12 | 2024-01-13 | 2024-01-14 | 2024-01-15 | 2024-01-16 | 2024-01-17 |
|---|---|---|---|---|---|---|---|---|---|---|---|---|---|---|---|---|---|---|---|---|---|---|---|---|
| pm25 | -999 Good |
-999 Good |
-999 Good |
-999 Good |
-999 Good |
-756 Good |
-442 Good |
-285 Good |
104 Very Unhealthy |
73 Unhealthy |
57 Unhealthy |
61 Unhealthy |
93 Very Unhealthy |
79 Very Unhealthy |
63 Unhealthy |
84 Very Unhealthy |
-50 Good |
-772 Good |
92 Very Unhealthy |
92 Very Unhealthy |
47 Unhealthy for Sensitive Groups |
92 Very Unhealthy |
92 Very Unhealthy |
92 Very Unhealthy |
| o3 | -1 Good |
-1 Good |
-1 Good |
-1 Good |
-1 Good |
-1 Good |
-1 Good |
-1 Good |
0 Good |
0 Good |
0 Good |
0 Good |
0 Good |
0 Good |
0 Good |
0 Good |
-1 Good |
-1 Good |
-1 Good |
-1 Good |
-1 Good |
-1 Good |
-1 Good |
-1 Good |
| index | 2020-05 | 2020-04 | 2020-03 | 2020-02 | 2020-01 | 2019-12 | 2019-11 | 2019-10 | 2019-09 | 2019-08 | 2019-07 | 2019-06 | 2019-05 | 2019-04 | 2019-03 | 2019-02 | 2019-01 | 2018-12 | 2018-11 | 2018-10 | 2018-09 | 2018-08 | 2018-07 | 2018-06 | 2018-05 | 2018-04 | 2018-03 | 2018-02 | 2018-01 | 2017-12 | 2017-11 | 2017-10 | 2017-09 | 2017-08 | 2017-07 | 2017-06 | 2017-05 | 2017-04 |
|---|---|---|---|---|---|---|---|---|---|---|---|---|---|---|---|---|---|---|---|---|---|---|---|---|---|---|---|---|---|---|---|---|---|---|---|---|---|---|
| o3:ppm | 0.03 (Good) | 0.04 (Good) | 0.03 (Good) | 0.02 (Good) | 0.01 (Good) | 0.02 (Good) | 0.02 (Good) | 0.02 (Good) | 0.01 (Good) | 0.02 (Good) | 0.02 (Good) | 0.04 (Good) | 0.05 (Good) | 0.03 (Good) | 0.03 (Good) | 0.02 (Good) | 0.01 (Good) | 0.01 (Good) | 0.02 (Good) | 0.03 (Good) | 0.02 (Good) | 0.02 (Good) | 0.02 (Good) | 0.03 (Good) | 0.04 (Good) | 0.04 (Good) | 0.04 (Good) | 0.02 (Good) | 0.02 (Good) | 0.02 (Good) | 0.02 (Good) | 0.02 (Good) | 0.02 (Good) | 0.01 (Good) | 0.01 (Good) | 0.04 (Good) | 0.04 (Good) | 0.04 (Good) |
| pm25 | 22 (Moderate) | 48 (Unhealthy for Sensitive Groups) | 42 (Unhealthy for Sensitive Groups) | 82 (Very Unhealthy) | 82 (Very Unhealthy) | 72 (Unhealthy) | 56 (Unhealthy) | 31 (Moderate) | 15 (Moderate) | 14 (Moderate) | 16 (Moderate) | 32 (Moderate) | 63 (Unhealthy) | 57 (Unhealthy) | 73 (Unhealthy) | 68 (Unhealthy) | 99 (Very Unhealthy) | 97 (Very Unhealthy) | 69 (Unhealthy) | 36 (Unhealthy for Sensitive Groups) | 20 (Moderate) | 14 (Moderate) | 15 (Moderate) | 30 (Moderate) | 42 (Unhealthy for Sensitive Groups) | 63 (Unhealthy) | 91 (Very Unhealthy) | 100 (Very Unhealthy) | 89 (Very Unhealthy) | 83 (Very Unhealthy) | 57 (Unhealthy) | 36 (Unhealthy for Sensitive Groups) | 26 (Moderate) | 18 (Moderate) | 19 (Moderate) | 36 (Unhealthy for Sensitive Groups) | 49 (Unhealthy for Sensitive Groups) | 74 (Unhealthy) |
Green and Parks in the City
Province 3 47%
Bhutan: 82% Bangladesh: 33% India: 48% Myanmar: 33% Pakistan: 49%Pleasure of spending time in the city
Province 3 41%
Bhutan: 61% Bangladesh: 26% India: 40% Myanmar: 24% Pakistan: 43%Air Pollution
Province 3 70%
Bhutan: 45% Bangladesh: 78% India: 65% Myanmar: 83% Pakistan: 64%Garbage Disposal
Province 3 30%
Bhutan: 47% Bangladesh: 22% India: 34% Myanmar: 12% Pakistan: 34%Availability and quality of drinking water
Province 3 44%
Bhutan: 64% Bangladesh: 44% India: 48% Myanmar: 34% Pakistan: 44%Cleanliness and tidiness
Province 3 35%
Bhutan: 57% Bangladesh: 23% India: 37% Myanmar: 18% Pakistan: 40%Noise and Light pollution
Province 3 55%
Bhutan: 55% Bangladesh: 63% India: 59% Myanmar: 52% Pakistan: 59%Water Pollution
Province 3 79%
Bhutan: 56% Bangladesh: 74% India: 69% Myanmar: 74% Pakistan: 70%particulate matter PM2.5
Province 3 49 (Unhealthy for Sensitive Groups)
particulate matter PM10
Province 3 87 (Unhealthy)
PM2,5 -999 (Good)
particulate matter (PM2.5) dustO3 -1 (Good)
ozone (O3)O3 0.04 (Good)
ozone (O3)PM2,5 88 (Very Unhealthy)
particulate matter (PM2.5) dustPM2,5 92 (Very Unhealthy)
particulate matter (PM2.5) dustO3 -1 (Good)
ozone (O3)
| index | 2023-12-30 | 2023-12-29 | 2023-12-28 | 2023-12-27 | 2023-12-26 | 2023-12-25 | 2023-12-24 | 2023-12-23 |
|---|---|---|---|---|---|---|---|---|
| pm25 | -285.22 | -441.85 | -755.79 | -999 | -999 | -999 | -999 | -999 |
| o3 | -1 | -1 | -1 | -1 | -1 | -1 | -1 | -1 |
US Diplomatic Post: Embassy Kathmandu
| index | 2024-02-07 | 2024-02-06 | 2024-02-05 | 2024-02-04 | 2024-02-03 | 2024-02-02 | 2024-02-01 | 2024-01-31 |
|---|---|---|---|---|---|---|---|---|
| o3 | -0.11 | 0.02 | 0.02 | 0.02 | -0.02 | 0.02 | 0.01 | 0.03 |
| pm25 | 84 | 63 | 79 | 93 | 61 | 57 | 73 | 104 |
US Diplomatic Post: Phora Durbar Kathmandu
| index | 2024-01-17 | 2024-01-16 | 2024-01-15 | 2024-01-14 | 2024-01-13 | 2024-01-12 | 2024-01-11 | 2024-01-10 |
|---|---|---|---|---|---|---|---|---|
| pm25 | 92 | 92 | 92 | 47 | 92 | 92 | -771.71 | -50.3 |
| o3 | -1 | -1 | -1 | -1 | -1 | -1 | -1 | -1 |
US Diplomatic Post: Embassy Kathmandu
| index | 2020-05 | 2020-04 | 2020-03 | 2020-02 | 2020-01 | 2019-12 | 2019-11 | 2019-10 | 2019-09 | 2019-08 | 2019-07 | 2019-06 | 2019-05 | 2019-04 | 2019-03 | 2019-02 | 2019-01 | 2018-12 | 2018-11 | 2018-10 | 2018-09 | 2018-08 | 2018-07 | 2018-06 | 2018-05 | 2018-04 | 2018-03 | 2018-02 | 2018-01 | 2017-12 | 2017-11 | 2017-10 | 2017-09 | 2017-08 | 2017-07 | 2017-06 | 2017-05 | 2017-04 |
|---|---|---|---|---|---|---|---|---|---|---|---|---|---|---|---|---|---|---|---|---|---|---|---|---|---|---|---|---|---|---|---|---|---|---|---|---|---|---|
| pm25 | 20 | 49 | 41 | 81 | 72 | 65 | 54 | 30 | 13 | 13 | 15 | 30 | 59 | 55 | 66 | 57 | 89 | 89 | 62 | 34 | 18 | 14 | 15 | 27 | 41 | 58 | 89 | 100 | 83 | 76 | 50 | 34 | 25 | 13 | 18 | 37 | 46 | 66 |
| o3:ppm | 0.04 | 0.05 | 0.03 | 0.01 | 0.02 | 0.02 | 0.02 | 0.02 | 0.02 | 0.02 | 0.03 | 0.04 | 0.05 | 0.04 | 0.04 | 0.02 | 0.01 | 0.01 | 0.02 | 0.03 | 0.02 | 0.02 | 0.02 | 0.04 | 0.04 | 0.04 | 0.04 | 0.02 | 0.02 | 0.02 | 0.02 | 0 | 0 | 0 | 0 | 0.04 | 0.05 | 0.04 |
US Diplomatic Post: Phora Durbar Kathmandu
| index | 2020-05 | 2020-04 | 2020-03 | 2020-02 | 2020-01 | 2019-12 | 2019-11 | 2019-10 | 2019-09 | 2019-08 | 2019-07 | 2019-06 | 2019-05 | 2019-04 | 2019-03 | 2019-02 | 2019-01 | 2018-12 | 2018-11 | 2018-10 | 2018-09 | 2018-08 | 2018-07 | 2018-06 | 2018-05 | 2018-04 | 2018-03 | 2018-02 | 2018-01 | 2017-12 | 2017-11 | 2017-10 | 2017-09 | 2017-08 | 2017-07 | 2017-06 | 2017-05 | 2017-04 |
|---|---|---|---|---|---|---|---|---|---|---|---|---|---|---|---|---|---|---|---|---|---|---|---|---|---|---|---|---|---|---|---|---|---|---|---|---|---|---|
| pm25 | 23 | 47 | 44 | 83 | 92 | 80 | 59 | 32 | 17 | 14 | 18 | 34 | 67 | 60 | 81 | 78 | 110 | 105 | 76 | 39 | 22 | 15 | 15 | 32 | 44 | 69 | 92 | 100 | 95 | 89 | 64 | 38 | 26 | 22 | 20 | 35 | 53 | 83 |
| o3:ppm | 0.02 | 0.03 | 0.02 | 0.02 | 0.01 | 0.01 | 0.01 | 0.02 | 0.01 | 0.02 | 0.02 | 0.03 | 0.04 | 0.03 | 0.03 | 0.02 | 0.01 | 0.01 | 0.01 | 0.02 | 0.02 | 0.01 | 0.01 | 0.03 | 0.03 | 0.03 | 0.03 | 0.02 | 0.02 | 0.02 | 0.03 | 0.03 | 0.03 | 0.02 | 0.02 | 0.04 | 0.04 | 0.04 |