Air Pollution in Klaipėda County: Real-time Air Quality Index and smog alert.
Pollution and air quality forecast for Klaipėda County. Today is Wednesday, June 24, 2026. The following air pollution values have been recorded for Klaipėda County:- particulate matter (PM10) suspended dust - 7 (Good)
- sulfur dioxide (SO2) - 6 (Good)
- carbon monoxide (CO) - 279 (Good)
- nitrogen dioxide (NO2) - 31 (Good)
- particulate matter (PM2.5) dust - 9 (Good)
- ozone (O3) - 41 (Good)

What is the air quality in Klaipėda County today? Is the air polluted in Klaipėda County?. Is there smog?
What is the level of PM10 today in Klaipėda County? (particulate matter (PM10) suspended dust)
The current level of particulate matter PM10 in Klaipėda County is:
7 (Good)
The highest PM10 values usually occur in month: 21 (March 2020).
The lowest value of particulate matter PM10 pollution in Klaipėda County is usually recorded in: September (3.4).
What is the level of SO2 pollution? (sulfur dioxide (SO2))
6 (Good)
How high is the CO level? (carbon monoxide (CO))
279 (Good)
How high is the level of NO2? (nitrogen dioxide (NO2))
31 (Good)
What is the current level of PM2.5 in Klaipėda County? (particulate matter (PM2.5) dust)
Today's PM2.5 level is:
9 (Good)
For comparison, the highest level of PM2.5 in Klaipėda County in the last 7 days was: 7 (Saturday, January 13, 2024) and the lowest: 2 (Sunday, January 14, 2024).
The highest PM2.5 values were recorded: 16 (November 2018).
The lowest level of particulate matter PM2.5 pollution occurs in month: September (3.4).
How is the O3 level today in Klaipėda County? (ozone (O3))
41 (Good)
Current data Wednesday, January 17, 2024, 4:00 AM
PM10 7 (Good)
SO2 6 (Good)
CO 279 (Good)
NO2 31 (Good)
PM2,5 9 (Good)
O3 41 (Good)
Data on air pollution from recent days in Klaipėda County
index
2024-01-10
2024-01-11
2024-01-12
2024-01-13
2024-01-14
2024-01-15
2024-01-16
2024-01-17
no2
26
Good
26
Good
28
Good
16
Good
23
Good
22
Good
41
Moderate
28
Good
pm10
8
Good
5
Good
9
Good
7
Good
4
Good
4
Good
12
Good
6
Good
co
203
Good
220
Good
231
Good
251
Good
198
Good
220
Good
345
Good
262
Good
so2
7
Good
6
Good
6
Good
6
Good
6
Good
6
Good
7
Good
6
Good
pm25
4
Good
4
Good
4
Good
7
Good
2
Good
3
Good
7
Good
7
Good
o3
55
Good
54
Good
52
Good
51
Good
51
Good
57
Good
42
Good
56
Good
data source »
Air pollution in Klaipėda County from September 2017 to May 2020

index
2020-05
2020-04
2020-03
2020-02
2020-01
2019-12
2019-11
2019-10
2019-09
2019-08
2019-07
2019-06
2019-05
2019-04
2019-03
2019-02
2019-01
2018-12
2018-11
2018-10
2018-09
2018-08
2018-07
2018-06
2018-05
2018-04
2018-03
2018-02
2018-01
2017-12
2017-11
2017-10
2017-09
co
0.2 (Good)
0.21 (Good)
0.28 (Good)
0.23 (Good)
0.2 (Good)
0.13 (Good)
0.09 (Good)
0.1 (Good)
0.06 (Good)
0.06 (Good)
0.07 (Good)
0.12 (Good)
0.09 (Good)
0.12 (Good)
0.13 (Good)
0.17 (Good)
0.21 (Good)
0.18 (Good)
0.18 (Good)
0.12 (Good)
0.11 (Good)
0.09 (Good)
0.1 (Good)
0.09 (Good)
0.09 (Good)
0.1 (Good)
0.13 (Good)
0.21 (Good)
0.13 (Good)
0.09 (Good)
0.16 (Good)
0.1 (Good)
0.12 (Good)
pm10
13 (Good)
14 (Good)
21 (Moderate)
15 (Good)
13 (Good)
8.5 (Good)
6.4 (Good)
7.6 (Good)
3.4 (Good)
5.8 (Good)
5.7 (Good)
11 (Good)
8.3 (Good)
16 (Good)
8.3 (Good)
13 (Good)
14 (Good)
13 (Good)
19 (Good)
11 (Good)
9.3 (Good)
9.3 (Good)
12 (Good)
9.7 (Good)
14 (Good)
12 (Good)
12 (Good)
15 (Good)
9.3 (Good)
6.2 (Good)
11 (Good)
5.9 (Good)
7.8 (Good)
no2
11 (Good)
12 (Good)
17 (Good)
13 (Good)
8.5 (Good)
8.2 (Good)
5.2 (Good)
6.4 (Good)
3.4 (Good)
5.7 (Good)
5 (Good)
9.5 (Good)
6.1 (Good)
7.6 (Good)
7.3 (Good)
12 (Good)
11 (Good)
12 (Good)
9.7 (Good)
8 (Good)
9 (Good)
7.8 (Good)
9.9 (Good)
8.3 (Good)
7.6 (Good)
7.1 (Good)
8.9 (Good)
11 (Good)
5.8 (Good)
4.5 (Good)
8.9 (Good)
4.4 (Good)
4.8 (Good)
so2
7.1 (Good)
6 (Good)
5.1 (Good)
5.9 (Good)
4.7 (Good)
1.7 (Good)
0.93 (Good)
2.2 (Good)
2.3 (Good)
2.3 (Good)
2.3 (Good)
3.5 (Good)
2.5 (Good)
2.5 (Good)
2.5 (Good)
2.7 (Good)
2.4 (Good)
2.1 (Good)
2.1 (Good)
1.4 (Good)
1.1 (Good)
0.9 (Good)
1.6 (Good)
1 (Good)
1.7 (Good)
1.1 (Good)
0.66 (Good)
1.1 (Good)
0.9 (Good)
0.28 (Good)
5.1 (Good)
2.3 (Good)
1.7 (Good)
pm25
6.2 (Good)
6.9 (Good)
12 (Good)
9.9 (Good)
11 (Good)
7.4 (Good)
6.9 (Good)
8.9 (Good)
3.4 (Good)
5 (Good)
4.2 (Good)
7.7 (Good)
6.5 (Good)
8.7 (Good)
6.3 (Good)
9.4 (Good)
13 (Moderate)
12 (Good)
16 (Moderate)
8.6 (Good)
6.2 (Good)
6.6 (Good)
9 (Good)
6.5 (Good)
7.2 (Good)
8.5 (Good)
6.6 (Good)
11 (Good)
7.5 (Good)
6.6 (Good)
9.3 (Good)
5 (Good)
6.9 (Good)
o3
46 (Good)
55 (Good)
39 (Good)
54 (Good)
46 (Good)
18 (Good)
10 (Good)
18 (Good)
15 (Good)
14 (Good)
20 (Good)
39 (Good)
29 (Good)
31 (Good)
29 (Good)
29 (Good)
27 (Good)
15 (Good)
13 (Good)
14 (Good)
20 (Good)
29 (Good)
31 (Good)
23 (Good)
26 (Good)
27 (Good)
15 (Good)
11 (Good)
14 (Good)
8.9 (Good)
15 (Good)
8.7 (Good)
7 (Good)
data source »
Quality of life in Klaipėda County
Green and Parks in the City
Klaipėda County
92%
Latvia: 88%
Belarus: 66%
Estonia: 82%
Poland: 62%
Aland Islands: 75%
particulate matter PM2.5
Klaipėda County
9.9 (Good)
Pleasure of spending time in the city
Klaipėda County
91%
Latvia: 82%
Belarus: 69%
Estonia: 90%
Poland: 48%
Aland Islands: 92%
particulate matter PM10
Klaipėda County
17 (Good)
Air Pollution
Klaipėda County
8.3%
Latvia: 29%
Belarus: 42%
Estonia: 12%
Poland: 63%
Aland Islands: 17%
Garbage Disposal
Klaipėda County
79%
Latvia: 70%
Belarus: 67%
Estonia: 79%
Poland: 60%
Aland Islands: 88%
Availability and quality of drinking water
Klaipėda County
97%
Latvia: 79%
Belarus: 65%
Estonia: 90%
Poland: 65%
Aland Islands: 96%
Cleanliness and tidiness
Klaipėda County
82%
Latvia: 72%
Belarus: 79%
Estonia: 82%
Poland: 58%
Aland Islands: 83%
Noise and Light pollution
Klaipėda County
30%
Latvia: 37%
Belarus: 46%
Estonia: 31%
Poland: 51%
Aland Islands: 46%
Water Pollution
Klaipėda County
26%
Latvia: 28%
Belarus: 44%
Estonia: 16%
Poland: 39%
Aland Islands: 10%
Source: Numbeo
LT00031
Wednesday, January 17, 2024, 4:00 AM
PM10 4.2 (Good)
particulate matter (PM10) suspended dust
SO2 6.1 (Good)
sulfur dioxide (SO2)
CO 291 (Good)
carbon monoxide (CO)
NO2 27 (Good)
nitrogen dioxide (NO2)
LT00033
Wednesday, January 17, 2024, 4:00 AM
PM2,5 9.3 (Good)
particulate matter (PM2.5) dust
NO2 35 (Good)
nitrogen dioxide (NO2)
PM10 10 (Good)
particulate matter (PM10) suspended dust
CO 268 (Good)
carbon monoxide (CO)
O3 41 (Good)
ozone (O3)
LT00031
index
2024-01-17
2024-01-16
2024-01-15
2024-01-14
2024-01-13
2024-01-12
2024-01-11
2024-01-10
no2
37
43
27
29
21
32
26
34
pm10
4
11
3.9
3.4
4.4
8.5
4
6.2
co
279
388
244
218
275
258
237
222
so2
6
6.6
6.4
6.4
5.9
6.1
6.5
6.6
LT00033
index
2024-01-17
2024-01-16
2024-01-15
2024-01-14
2024-01-13
2024-01-12
2024-01-11
2024-01-10
no2
20
38
18
16
10
24
25
19
co
244
302
197
178
227
205
203
184
pm10
7.5
12
4.8
4.2
8.8
10
6.6
10
pm25
6.6
6.9
3
2.3
7.2
4.2
3.7
4.5
o3
56
42
57
51
51
52
54
55
LT00031
index
2020-05
2020-04
2020-03
2020-02
2020-01
2019-12
2019-11
2019-10
2019-09
2019-08
2019-07
2019-06
2019-05
2019-04
2019-03
2019-02
2019-01
2018-12
2018-11
2018-10
2018-09
2018-08
2018-07
2018-06
2018-05
2018-04
2018-03
2018-02
2018-01
2017-12
2017-11
2017-10
2017-09
pm10
13
13
21
14
11
7.2
5.5
7
2.8
5.3
5
12
8.8
17
8.3
11
16
12
16
9.3
5.3
5
6.3
7.6
12
7.8
7.9
14
7.8
3.5
7.7
2.5
1.6
co
0.18
0.18
0.28
0.23
0.2
0.13
0.09
0.1
0.06
0.07
0.07
0.13
0.11
0.14
0.15
0.2
0.22
0.2
0.21
0.13
0.11
0.08
0.1
0.09
0.1
0.1
0.13
0.24
0.13
0.08
0.17
0.08
0.1
so2
7.1
6
5.1
5.9
4.7
1.7
0.93
2.2
2.3
2.3
2.3
3.5
2.5
2.5
2.5
2.7
2.4
2.1
2.1
1.4
1.1
0.9
1.6
1
1.7
1.1
0.66
1.1
0.9
0.28
5.1
2.3
1.7
no2
8.3
9.6
16
9.6
7.2
7.2
5.3
5.9
3.1
4.3
3.6
8.3
5.2
6.2
6.8
13
8.9
11
9.1
7.4
6.8
5.9
5.8
6.8
6.8
4.5
6.5
12
6
4.6
9.9
3.1
2.6
LT00033
2017-09 2020-05
index
2020-05
2020-04
2020-03
2020-02
2020-01
2019-12
2019-11
2019-10
2019-09
2019-08
2019-07
2019-06
2019-05
2019-04
2019-03
2019-02
2019-01
2018-12
2018-11
2018-10
2018-09
2018-08
2018-07
2018-06
2018-05
2018-04
2018-03
2018-02
2018-01
2017-12
2017-11
2017-10
2017-09
co
0.22
0.24
0.28
0.22
0.2
0.13
0.09
0.1
0.05
0.06
0.07
0.11
0.08
0.1
0.11
0.15
0.19
0.16
0.16
0.1
0.11
0.09
0.1
0.08
0.08
0.1
0.13
0.18
0.12
0.1
0.15
0.11
0.14
pm25
6.2
6.9
12
9.9
11
7.4
6.9
8.9
3.4
5
4.2
7.7
6.5
8.7
6.3
9.4
13
12
16
8.6
6.2
6.6
9
6.5
7.2
8.5
6.6
11
7.5
6.6
9.3
5
6.9
pm10
14
15
20
17
15
9.9
7.3
8.2
4
6.4
6.5
11
7.7
14
8.3
15
12
14
21
12
13
14
18
12
16
16
16
17
11
8.9
14
9.3
14
no2
14
15
19
17
9.8
9.3
5.2
7
3.7
7.1
6.3
11
7.1
9
7.8
12
13
12
10
8.6
11
9.7
14
9.9
8.4
9.8
11
10
5.6
4.4
8
5.6
7
o3
46
55
39
54
46
18
10
18
15
14
20
39
29
31
29
29
27
15
13
14
20
29
31
23
26
27
15
11
14
8.9
15
8.7
7
* Pollution data source:
https://openaq.org
(EEA Lithuania)
The data is licensed under CC-By 4.0
PM10 7 (Good)
SO2 6 (Good)
CO 279 (Good)
NO2 31 (Good)
PM2,5 9 (Good)
O3 41 (Good)
Data on air pollution from recent days in Klaipėda County
| index | 2024-01-10 | 2024-01-11 | 2024-01-12 | 2024-01-13 | 2024-01-14 | 2024-01-15 | 2024-01-16 | 2024-01-17 |
|---|---|---|---|---|---|---|---|---|
| no2 | 26 Good |
26 Good |
28 Good |
16 Good |
23 Good |
22 Good |
41 Moderate |
28 Good |
| pm10 | 8 Good |
5 Good |
9 Good |
7 Good |
4 Good |
4 Good |
12 Good |
6 Good |
| co | 203 Good |
220 Good |
231 Good |
251 Good |
198 Good |
220 Good |
345 Good |
262 Good |
| so2 | 7 Good |
6 Good |
6 Good |
6 Good |
6 Good |
6 Good |
7 Good |
6 Good |
| pm25 | 4 Good |
4 Good |
4 Good |
7 Good |
2 Good |
3 Good |
7 Good |
7 Good |
| o3 | 55 Good |
54 Good |
52 Good |
51 Good |
51 Good |
57 Good |
42 Good |
56 Good |

| index | 2020-05 | 2020-04 | 2020-03 | 2020-02 | 2020-01 | 2019-12 | 2019-11 | 2019-10 | 2019-09 | 2019-08 | 2019-07 | 2019-06 | 2019-05 | 2019-04 | 2019-03 | 2019-02 | 2019-01 | 2018-12 | 2018-11 | 2018-10 | 2018-09 | 2018-08 | 2018-07 | 2018-06 | 2018-05 | 2018-04 | 2018-03 | 2018-02 | 2018-01 | 2017-12 | 2017-11 | 2017-10 | 2017-09 |
|---|---|---|---|---|---|---|---|---|---|---|---|---|---|---|---|---|---|---|---|---|---|---|---|---|---|---|---|---|---|---|---|---|---|
| co | 0.2 (Good) | 0.21 (Good) | 0.28 (Good) | 0.23 (Good) | 0.2 (Good) | 0.13 (Good) | 0.09 (Good) | 0.1 (Good) | 0.06 (Good) | 0.06 (Good) | 0.07 (Good) | 0.12 (Good) | 0.09 (Good) | 0.12 (Good) | 0.13 (Good) | 0.17 (Good) | 0.21 (Good) | 0.18 (Good) | 0.18 (Good) | 0.12 (Good) | 0.11 (Good) | 0.09 (Good) | 0.1 (Good) | 0.09 (Good) | 0.09 (Good) | 0.1 (Good) | 0.13 (Good) | 0.21 (Good) | 0.13 (Good) | 0.09 (Good) | 0.16 (Good) | 0.1 (Good) | 0.12 (Good) |
| pm10 | 13 (Good) | 14 (Good) | 21 (Moderate) | 15 (Good) | 13 (Good) | 8.5 (Good) | 6.4 (Good) | 7.6 (Good) | 3.4 (Good) | 5.8 (Good) | 5.7 (Good) | 11 (Good) | 8.3 (Good) | 16 (Good) | 8.3 (Good) | 13 (Good) | 14 (Good) | 13 (Good) | 19 (Good) | 11 (Good) | 9.3 (Good) | 9.3 (Good) | 12 (Good) | 9.7 (Good) | 14 (Good) | 12 (Good) | 12 (Good) | 15 (Good) | 9.3 (Good) | 6.2 (Good) | 11 (Good) | 5.9 (Good) | 7.8 (Good) |
| no2 | 11 (Good) | 12 (Good) | 17 (Good) | 13 (Good) | 8.5 (Good) | 8.2 (Good) | 5.2 (Good) | 6.4 (Good) | 3.4 (Good) | 5.7 (Good) | 5 (Good) | 9.5 (Good) | 6.1 (Good) | 7.6 (Good) | 7.3 (Good) | 12 (Good) | 11 (Good) | 12 (Good) | 9.7 (Good) | 8 (Good) | 9 (Good) | 7.8 (Good) | 9.9 (Good) | 8.3 (Good) | 7.6 (Good) | 7.1 (Good) | 8.9 (Good) | 11 (Good) | 5.8 (Good) | 4.5 (Good) | 8.9 (Good) | 4.4 (Good) | 4.8 (Good) |
| so2 | 7.1 (Good) | 6 (Good) | 5.1 (Good) | 5.9 (Good) | 4.7 (Good) | 1.7 (Good) | 0.93 (Good) | 2.2 (Good) | 2.3 (Good) | 2.3 (Good) | 2.3 (Good) | 3.5 (Good) | 2.5 (Good) | 2.5 (Good) | 2.5 (Good) | 2.7 (Good) | 2.4 (Good) | 2.1 (Good) | 2.1 (Good) | 1.4 (Good) | 1.1 (Good) | 0.9 (Good) | 1.6 (Good) | 1 (Good) | 1.7 (Good) | 1.1 (Good) | 0.66 (Good) | 1.1 (Good) | 0.9 (Good) | 0.28 (Good) | 5.1 (Good) | 2.3 (Good) | 1.7 (Good) |
| pm25 | 6.2 (Good) | 6.9 (Good) | 12 (Good) | 9.9 (Good) | 11 (Good) | 7.4 (Good) | 6.9 (Good) | 8.9 (Good) | 3.4 (Good) | 5 (Good) | 4.2 (Good) | 7.7 (Good) | 6.5 (Good) | 8.7 (Good) | 6.3 (Good) | 9.4 (Good) | 13 (Moderate) | 12 (Good) | 16 (Moderate) | 8.6 (Good) | 6.2 (Good) | 6.6 (Good) | 9 (Good) | 6.5 (Good) | 7.2 (Good) | 8.5 (Good) | 6.6 (Good) | 11 (Good) | 7.5 (Good) | 6.6 (Good) | 9.3 (Good) | 5 (Good) | 6.9 (Good) |
| o3 | 46 (Good) | 55 (Good) | 39 (Good) | 54 (Good) | 46 (Good) | 18 (Good) | 10 (Good) | 18 (Good) | 15 (Good) | 14 (Good) | 20 (Good) | 39 (Good) | 29 (Good) | 31 (Good) | 29 (Good) | 29 (Good) | 27 (Good) | 15 (Good) | 13 (Good) | 14 (Good) | 20 (Good) | 29 (Good) | 31 (Good) | 23 (Good) | 26 (Good) | 27 (Good) | 15 (Good) | 11 (Good) | 14 (Good) | 8.9 (Good) | 15 (Good) | 8.7 (Good) | 7 (Good) |
Green and Parks in the City
Klaipėda County 92%
Latvia: 88% Belarus: 66% Estonia: 82% Poland: 62% Aland Islands: 75%particulate matter PM2.5
Klaipėda County 9.9 (Good)
Pleasure of spending time in the city
Klaipėda County 91%
Latvia: 82% Belarus: 69% Estonia: 90% Poland: 48% Aland Islands: 92%particulate matter PM10
Klaipėda County 17 (Good)
Air Pollution
Klaipėda County 8.3%
Latvia: 29% Belarus: 42% Estonia: 12% Poland: 63% Aland Islands: 17%Garbage Disposal
Klaipėda County 79%
Latvia: 70% Belarus: 67% Estonia: 79% Poland: 60% Aland Islands: 88%Availability and quality of drinking water
Klaipėda County 97%
Latvia: 79% Belarus: 65% Estonia: 90% Poland: 65% Aland Islands: 96%Cleanliness and tidiness
Klaipėda County 82%
Latvia: 72% Belarus: 79% Estonia: 82% Poland: 58% Aland Islands: 83%Noise and Light pollution
Klaipėda County 30%
Latvia: 37% Belarus: 46% Estonia: 31% Poland: 51% Aland Islands: 46%Water Pollution
Klaipėda County 26%
Latvia: 28% Belarus: 44% Estonia: 16% Poland: 39% Aland Islands: 10%PM10 4.2 (Good)
particulate matter (PM10) suspended dustSO2 6.1 (Good)
sulfur dioxide (SO2)CO 291 (Good)
carbon monoxide (CO)NO2 27 (Good)
nitrogen dioxide (NO2)PM2,5 9.3 (Good)
particulate matter (PM2.5) dustNO2 35 (Good)
nitrogen dioxide (NO2)PM10 10 (Good)
particulate matter (PM10) suspended dustCO 268 (Good)
carbon monoxide (CO)O3 41 (Good)
ozone (O3)LT00031
| index | 2024-01-17 | 2024-01-16 | 2024-01-15 | 2024-01-14 | 2024-01-13 | 2024-01-12 | 2024-01-11 | 2024-01-10 |
|---|---|---|---|---|---|---|---|---|
| no2 | 37 | 43 | 27 | 29 | 21 | 32 | 26 | 34 |
| pm10 | 4 | 11 | 3.9 | 3.4 | 4.4 | 8.5 | 4 | 6.2 |
| co | 279 | 388 | 244 | 218 | 275 | 258 | 237 | 222 |
| so2 | 6 | 6.6 | 6.4 | 6.4 | 5.9 | 6.1 | 6.5 | 6.6 |
LT00033
| index | 2024-01-17 | 2024-01-16 | 2024-01-15 | 2024-01-14 | 2024-01-13 | 2024-01-12 | 2024-01-11 | 2024-01-10 |
|---|---|---|---|---|---|---|---|---|
| no2 | 20 | 38 | 18 | 16 | 10 | 24 | 25 | 19 |
| co | 244 | 302 | 197 | 178 | 227 | 205 | 203 | 184 |
| pm10 | 7.5 | 12 | 4.8 | 4.2 | 8.8 | 10 | 6.6 | 10 |
| pm25 | 6.6 | 6.9 | 3 | 2.3 | 7.2 | 4.2 | 3.7 | 4.5 |
| o3 | 56 | 42 | 57 | 51 | 51 | 52 | 54 | 55 |
LT00031
| index | 2020-05 | 2020-04 | 2020-03 | 2020-02 | 2020-01 | 2019-12 | 2019-11 | 2019-10 | 2019-09 | 2019-08 | 2019-07 | 2019-06 | 2019-05 | 2019-04 | 2019-03 | 2019-02 | 2019-01 | 2018-12 | 2018-11 | 2018-10 | 2018-09 | 2018-08 | 2018-07 | 2018-06 | 2018-05 | 2018-04 | 2018-03 | 2018-02 | 2018-01 | 2017-12 | 2017-11 | 2017-10 | 2017-09 |
|---|---|---|---|---|---|---|---|---|---|---|---|---|---|---|---|---|---|---|---|---|---|---|---|---|---|---|---|---|---|---|---|---|---|
| pm10 | 13 | 13 | 21 | 14 | 11 | 7.2 | 5.5 | 7 | 2.8 | 5.3 | 5 | 12 | 8.8 | 17 | 8.3 | 11 | 16 | 12 | 16 | 9.3 | 5.3 | 5 | 6.3 | 7.6 | 12 | 7.8 | 7.9 | 14 | 7.8 | 3.5 | 7.7 | 2.5 | 1.6 |
| co | 0.18 | 0.18 | 0.28 | 0.23 | 0.2 | 0.13 | 0.09 | 0.1 | 0.06 | 0.07 | 0.07 | 0.13 | 0.11 | 0.14 | 0.15 | 0.2 | 0.22 | 0.2 | 0.21 | 0.13 | 0.11 | 0.08 | 0.1 | 0.09 | 0.1 | 0.1 | 0.13 | 0.24 | 0.13 | 0.08 | 0.17 | 0.08 | 0.1 |
| so2 | 7.1 | 6 | 5.1 | 5.9 | 4.7 | 1.7 | 0.93 | 2.2 | 2.3 | 2.3 | 2.3 | 3.5 | 2.5 | 2.5 | 2.5 | 2.7 | 2.4 | 2.1 | 2.1 | 1.4 | 1.1 | 0.9 | 1.6 | 1 | 1.7 | 1.1 | 0.66 | 1.1 | 0.9 | 0.28 | 5.1 | 2.3 | 1.7 |
| no2 | 8.3 | 9.6 | 16 | 9.6 | 7.2 | 7.2 | 5.3 | 5.9 | 3.1 | 4.3 | 3.6 | 8.3 | 5.2 | 6.2 | 6.8 | 13 | 8.9 | 11 | 9.1 | 7.4 | 6.8 | 5.9 | 5.8 | 6.8 | 6.8 | 4.5 | 6.5 | 12 | 6 | 4.6 | 9.9 | 3.1 | 2.6 |
LT00033

| index | 2020-05 | 2020-04 | 2020-03 | 2020-02 | 2020-01 | 2019-12 | 2019-11 | 2019-10 | 2019-09 | 2019-08 | 2019-07 | 2019-06 | 2019-05 | 2019-04 | 2019-03 | 2019-02 | 2019-01 | 2018-12 | 2018-11 | 2018-10 | 2018-09 | 2018-08 | 2018-07 | 2018-06 | 2018-05 | 2018-04 | 2018-03 | 2018-02 | 2018-01 | 2017-12 | 2017-11 | 2017-10 | 2017-09 |
|---|---|---|---|---|---|---|---|---|---|---|---|---|---|---|---|---|---|---|---|---|---|---|---|---|---|---|---|---|---|---|---|---|---|
| co | 0.22 | 0.24 | 0.28 | 0.22 | 0.2 | 0.13 | 0.09 | 0.1 | 0.05 | 0.06 | 0.07 | 0.11 | 0.08 | 0.1 | 0.11 | 0.15 | 0.19 | 0.16 | 0.16 | 0.1 | 0.11 | 0.09 | 0.1 | 0.08 | 0.08 | 0.1 | 0.13 | 0.18 | 0.12 | 0.1 | 0.15 | 0.11 | 0.14 |
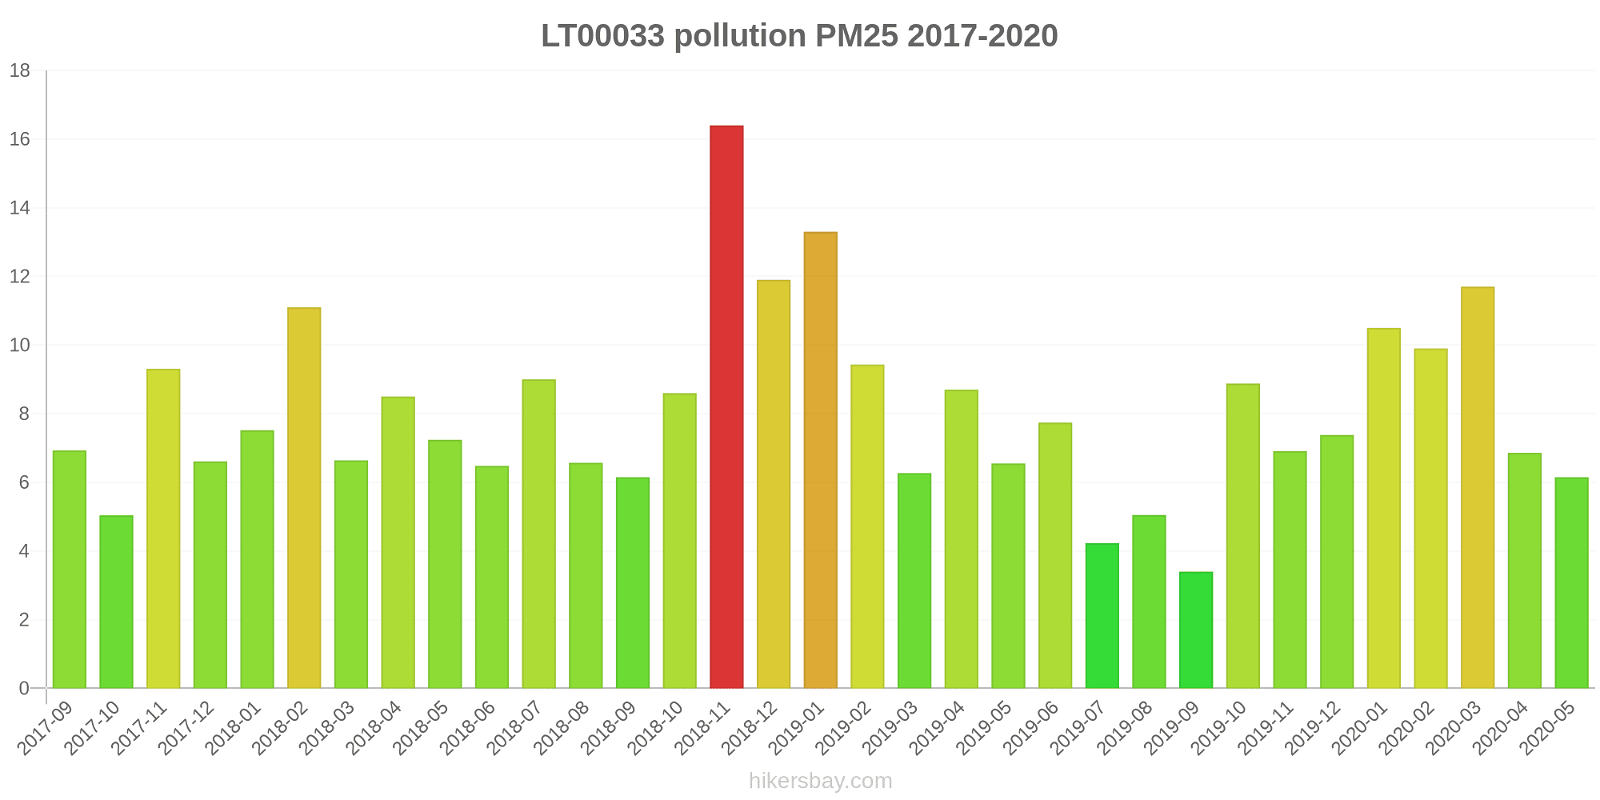
| pm25 | 6.2 | 6.9 | 12 | 9.9 | 11 | 7.4 | 6.9 | 8.9 | 3.4 | 5 | 4.2 | 7.7 | 6.5 | 8.7 | 6.3 | 9.4 | 13 | 12 | 16 | 8.6 | 6.2 | 6.6 | 9 | 6.5 | 7.2 | 8.5 | 6.6 | 11 | 7.5 | 6.6 | 9.3 | 5 | 6.9 |
| pm10 | 14 | 15 | 20 | 17 | 15 | 9.9 | 7.3 | 8.2 | 4 | 6.4 | 6.5 | 11 | 7.7 | 14 | 8.3 | 15 | 12 | 14 | 21 | 12 | 13 | 14 | 18 | 12 | 16 | 16 | 16 | 17 | 11 | 8.9 | 14 | 9.3 | 14 |
| no2 | 14 | 15 | 19 | 17 | 9.8 | 9.3 | 5.2 | 7 | 3.7 | 7.1 | 6.3 | 11 | 7.1 | 9 | 7.8 | 12 | 13 | 12 | 10 | 8.6 | 11 | 9.7 | 14 | 9.9 | 8.4 | 9.8 | 11 | 10 | 5.6 | 4.4 | 8 | 5.6 | 7 |
| o3 | 46 | 55 | 39 | 54 | 46 | 18 | 10 | 18 | 15 | 14 | 20 | 39 | 29 | 31 | 29 | 29 | 27 | 15 | 13 | 14 | 20 | 29 | 31 | 23 | 26 | 27 | 15 | 11 | 14 | 8.9 | 15 | 8.7 | 7 |