Air Pollution in Dublin City: Real-time Air Quality Index and smog alert.
Pollution and air quality forecast for Dublin City. Today is Sunday, June 21, 2026. The following air pollution values have been recorded for Dublin City:- nitrogen dioxide (NO2) - 66 (Moderate)
- particulate matter (PM10) suspended dust - 14 (Good)
- particulate matter (PM2.5) dust - 9 (Good)
- sulfur dioxide (SO2) - 5 (Good)
- ozone (O3) - 1 (Good)
- carbon monoxide (CO) - 200 (Good)

What is the air quality in Dublin City today? Is the air polluted in Dublin City?. Is there smog?
How high is the level of NO2? (nitrogen dioxide (NO2))
66 (Moderate)
What is the level of PM10 today in Dublin City? (particulate matter (PM10) suspended dust)
The current level of particulate matter PM10 in Dublin City is:
14 (Good)
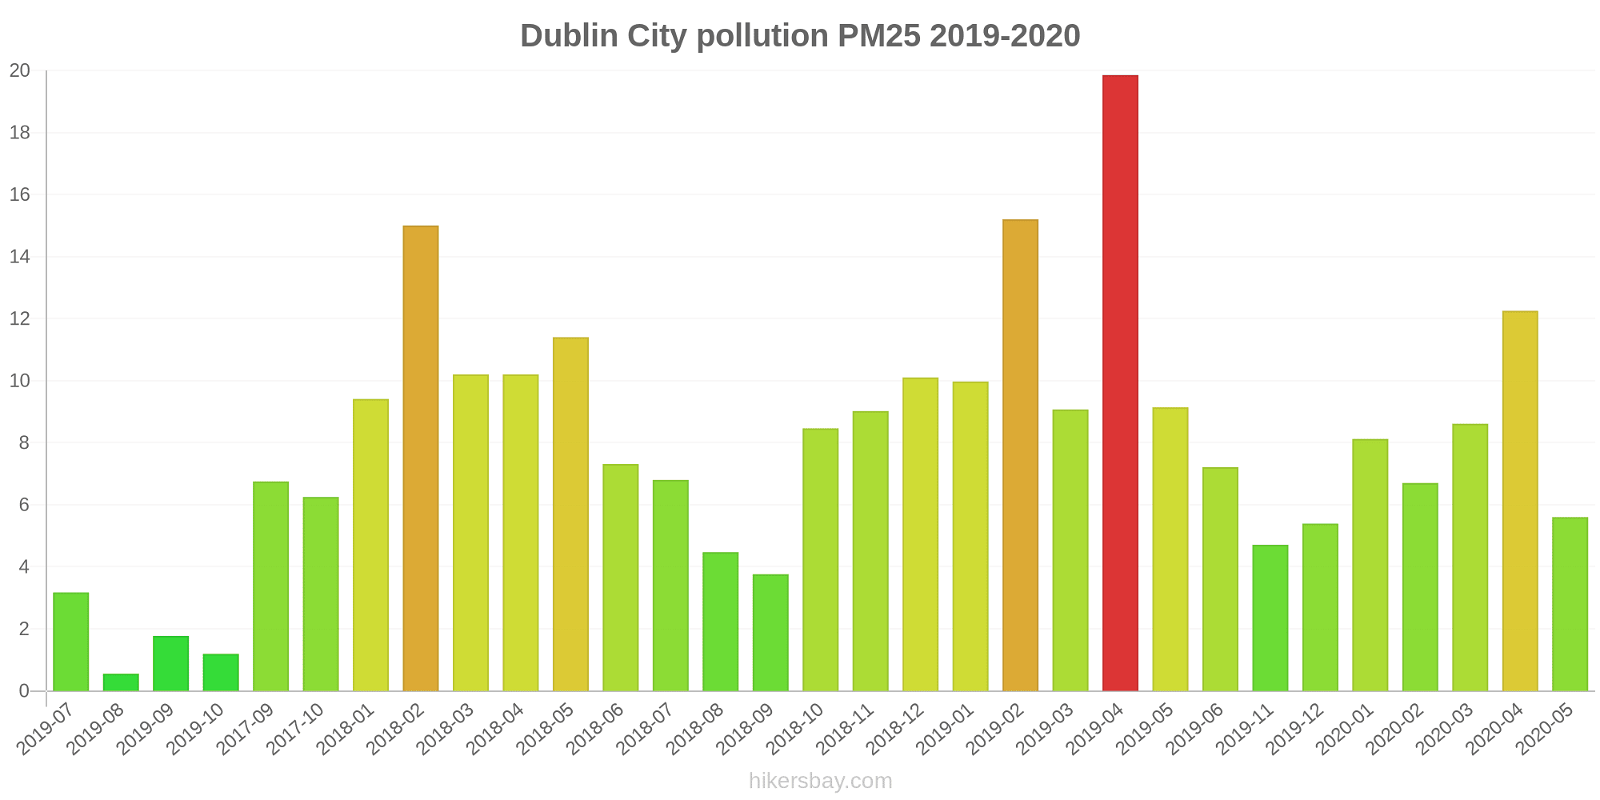
The highest PM10 values usually occur in month: 27 (April 2019).
The lowest value of particulate matter PM10 pollution in Dublin City is usually recorded in: August (2.4).
What is the current level of PM2.5 in Dublin City? (particulate matter (PM2.5) dust)
Today's PM2.5 level is:
9 (Good)
For comparison, the highest level of PM2.5 in Dublin City in the last 7 days was: 18 (Saturday, January 13, 2024) and the lowest: 4 (Wednesday, January 10, 2024).
The highest PM2.5 values were recorded: 20 (April 2019).
The lowest level of particulate matter PM2.5 pollution occurs in month: August (0.55).
What is the level of SO2 pollution? (sulfur dioxide (SO2))
5 (Good)
How is the O3 level today in Dublin City? (ozone (O3))
1 (Good)
How high is the CO level? (carbon monoxide (CO))
200 (Good)
Current data Wednesday, January 17, 2024, 11:00 AM
NO2 66 (Moderate)
PM10 14 (Good)
PM2,5 9 (Good)
SO2 5 (Good)
O3 1 (Good)
CO 200 (Good)
Data on air pollution from recent days in Dublin City
index
2024-01-10
2024-01-11
2024-01-12
2024-01-13
2024-01-14
2024-01-15
2024-01-16
2024-01-17
pm25
4
Good
4
Good
10
Good
18
Moderate
9
Good
10
Good
6
Good
9
Good
pm10
10
Good
9
Good
13
Good
20
Moderate
11
Good
15
Good
10
Good
12
Good
no2
21
Good
22
Good
21
Good
21
Good
19
Good
32
Good
17
Good
34
Good
so2
1
Good
1
Good
1
Good
2
Good
3
Good
4
Good
2
Good
4
Good
o3
49
Good
51
Good
33
Good
20
Good
35
Good
26
Good
54
Good
21
Good
co
170
Good
164
Good
130
Good
175
Good
146
Good
158
Good
105
Good
159
Good
data source »
Air pollution in Dublin City from December 2017 to May 2020
index
2020-05
2020-04
2020-03
2020-02
2020-01
2019-12
2019-11
2019-09
2019-08
2019-07
2019-06
2019-05
2019-04
2019-03
2019-02
2019-01
2019-10
2018-12
2018-11
2018-10
2018-09
2018-08
2018-07
2018-06
2018-05
2018-04
2018-03
2018-02
2018-01
2017-10
2017-09
2017-12
pm10
9.6 (Good)
18 (Good)
15 (Good)
11 (Good)
13 (Good)
10 (Good)
10 (Good)
3.9 (Good)
2.4 (Good)
5.6 (Good)
9.8 (Good)
12 (Good)
27 (Moderate)
16 (Good)
25 (Moderate)
14 (Good)
4.4 (Good)
13 (Good)
11 (Good)
10 (Good)
6.2 (Good)
6.2 (Good)
8.7 (Good)
10 (Good)
14 (Good)
12 (Good)
13 (Good)
18 (Good)
12 (Good)
9 (Good)
9.5 (Good)
- (Good)
no2
9.8 (Good)
16 (Good)
17 (Good)
16 (Good)
19 (Good)
20 (Good)
24 (Good)
10 (Good)
5.1 (Good)
12 (Good)
19 (Good)
17 (Good)
30 (Good)
23 (Good)
33 (Good)
29 (Good)
6.5 (Good)
29 (Good)
27 (Good)
25 (Good)
19 (Good)
15 (Good)
17 (Good)
23 (Good)
31 (Good)
23 (Good)
27 (Good)
27 (Good)
- (Good)
13 (Good)
17 (Good)
- (Good)
o3
64 (Good)
61 (Good)
55 (Good)
57 (Good)
51 (Good)
26 (Good)
17 (Good)
- (Good)
- (Good)
28 (Good)
48 (Good)
54 (Good)
63 (Good)
56 (Good)
48 (Good)
36 (Good)
4.8 (Good)
44 (Good)
40 (Good)
41 (Good)
37 (Good)
36 (Good)
39 (Good)
51 (Good)
51 (Good)
61 (Good)
51 (Good)
47 (Good)
- (Good)
47 (Good)
40 (Good)
- (Good)
pm25
5.6 (Good)
12 (Good)
8.6 (Good)
6.7 (Good)
8.1 (Good)
5.4 (Good)
4.7 (Good)
1.8 (Good)
0.55 (Good)
3.2 (Good)
7.2 (Good)
9.1 (Good)
20 (Moderate)
9.1 (Good)
15 (Moderate)
10 (Good)
1.2 (Good)
10 (Good)
9 (Good)
8.5 (Good)
3.8 (Good)
4.5 (Good)
6.8 (Good)
7.3 (Good)
11 (Good)
10 (Good)
10 (Good)
15 (Moderate)
9.4 (Good)
6.3 (Good)
6.8 (Good)
- (Good)
so2
1.8 (Good)
2.4 (Good)
3.7 (Good)
4.9 (Good)
2.4 (Good)
1.2 (Good)
0.83 (Good)
0.29 (Good)
0.17 (Good)
0.73 (Good)
0.72 (Good)
0.89 (Good)
7 (Good)
10 (Good)
5.5 (Good)
2.6 (Good)
0.09 (Good)
1.6 (Good)
0.65 (Good)
1.3 (Good)
0.47 (Good)
1.1 (Good)
5.1 (Good)
6.1 (Good)
12 (Good)
1.5 (Good)
2.5 (Good)
2.6 (Good)
- (Good)
1.3 (Good)
1.1 (Good)
- (Good)
co
0.26 (Good)
0.34 (Good)
0.32 (Good)
0.29 (Good)
0.32 (Good)
0.34 (Good)
0.34 (Good)
0.14 (Good)
0.03 (Good)
0.15 (Good)
0.23 (Good)
0.28 (Good)
0.46 (Good)
0.35 (Good)
0.47 (Good)
0.4 (Good)
0.03 (Good)
0.4 (Good)
0.32 (Good)
0.33 (Good)
0.3 (Good)
0.24 (Good)
0.34 (Good)
0.34 (Good)
0.32 (Good)
0.43 (Good)
0.48 (Good)
0.42 (Good)
0.39 (Good)
0.38 (Good)
0.41 (Good)
0.34 (Good)
data source »
Quality of life in Dublin City
Green and Parks in the City
Dublin City
76%
Isle of Man: 78%
United Kingdom: 75%
Netherlands: 82%
Belgium: 64%
Faroe Islands: 87%
particulate matter PM2.5
Dublin City
11 (Good)
Pleasure of spending time in the city
Dublin City
72%
Isle of Man: 83%
United Kingdom: 70%
Netherlands: 88%
Belgium: 64%
Faroe Islands: 100%
particulate matter PM10
Dublin City
16 (Good)
Air Pollution
Dublin City
33%
Isle of Man: 13%
United Kingdom: 37%
Netherlands: 21%
Belgium: 45%
Faroe Islands: 0%
Garbage Disposal
Dublin City
57%
Isle of Man: 78%
United Kingdom: 60%
Netherlands: 79%
Belgium: 54%
Faroe Islands: 88%
Availability and quality of drinking water
Dublin City
70%
Isle of Man: 88%
United Kingdom: 75%
Netherlands: 92%
Belgium: 70%
Faroe Islands: 98%
Cleanliness and tidiness
Dublin City
46%
Isle of Man: 69%
United Kingdom: 53%
Netherlands: 77%
Belgium: 46%
Faroe Islands: 94%
Noise and Light pollution
Dublin City
44%
Isle of Man: 12%
United Kingdom: 47%
Netherlands: 31%
Belgium: 54%
Faroe Islands: 21%
Water Pollution
Dublin City
40%
Isle of Man: 13%
United Kingdom: 31%
Netherlands: 17%
Belgium: 42%
Faroe Islands: 7.7%
Source: Numbeo
IE001AP
Wednesday, January 17, 2024, 9:00 AM
NO2 63 (Moderate)
nitrogen dioxide (NO2)
PM10 20 (Good)
particulate matter (PM10) suspended dust
PM2,5 11 (Good)
particulate matter (PM2.5) dust
Dublin Rathmines Wynnefield Road
Wednesday, January 17, 2024, 11:00 AM
NO2 82 (Moderate)
nitrogen dioxide (NO2)
PM10 22 (Moderate)
particulate matter (PM10) suspended dust
PM2,5 13 (Moderate)
particulate matter (PM2.5) dust
SO2 6 (Good)
sulfur dioxide (SO2)
O3 0.72 (Good)
ozone (O3)
IE002AP
Wednesday, January 17, 2024, 8:00 AM
PM2,5 4.9 (Good)
particulate matter (PM2.5) dust
PM10 7.5 (Good)
particulate matter (PM10) suspended dust
IE0036A
Wednesday, January 17, 2024, 9:00 AM
PM2,5 8.5 (Good)
particulate matter (PM2.5) dust
NO2 63 (Moderate)
nitrogen dioxide (NO2)
PM10 13 (Good)
particulate matter (PM10) suspended dust
IE003AP
Wednesday, January 17, 2024, 11:00 AM
PM10 8.8 (Good)
particulate matter (PM10) suspended dust
PM2,5 5.3 (Good)
particulate matter (PM2.5) dust
Dublin Winetavern Street
Wednesday, January 17, 2024, 11:00 AM
CO 200 (Good)
carbon monoxide (CO)
NO2 57 (Moderate)
nitrogen dioxide (NO2)
SO2 4.7 (Good)
sulfur dioxide (SO2)
IE001AP
index
2024-01-17
2024-01-16
2024-01-15
2024-01-14
2024-01-13
2024-01-12
2024-01-11
2024-01-10
pm25
10
6.5
9.5
8.9
17
10
4.6
4.7
pm10
14
11
16
11
20
16
10
11
no2
38
25
36
19
24
23
26
26
Dublin Rathmines Wynnefield Road
index
2024-01-17
2024-01-16
2024-01-15
2024-01-14
2024-01-13
2024-01-12
2024-01-11
2024-01-10
so2
3.9
2.8
3.1
2.7
2
1.5
1.7
1.9
pm25
12
6.5
12
12
19
11
6.7
6.5
pm10
14
9.5
17
14
21
15
14
15
no2
35
13
32
17
23
25
23
19
o3
21
54
26
35
20
33
51
49
IE002AP
index
2024-01-17
2024-01-16
2024-01-15
2024-01-14
2024-01-13
2024-01-12
2024-01-11
2024-01-10
pm10
9.5
12
13
8.9
19
11
6.6
7.2
pm25
7.7
6.7
9.2
7
17
8.1
3.3
3
IE0036A
index
2024-01-17
2024-01-16
2024-01-15
2024-01-14
2024-01-13
2024-01-12
2024-01-11
2024-01-10
pm10
13
9.1
15
12
21
13
8.4
9.4
pm25
10
5.7
10
9.9
20
10
4
4.5
no2
28
13
27
14
17
16
15
15
IE003AP
index
2024-01-17
2024-01-16
2024-01-15
2024-01-14
2024-01-13
2024-01-12
2024-01-11
2024-01-10
pm10
9.3
8.7
14
9
19
12
6.9
7.6
pm25
7.2
5.9
10
7.2
18
8.9
3.3
3.4
Dublin Winetavern Street
index
2024-01-17
2024-01-16
2024-01-15
2024-01-14
2024-01-13
2024-01-12
2024-01-11
2024-01-10
no2
36
18
33
24
22
18
24
22
so2
3.1
1.3
4.2
2.3
1.9
0.87
0.93
1
co
159
105
158
146
175
130
164
170
IE001AP
index
2020-05
2020-04
2020-03
2020-02
2020-01
2019-12
2019-11
2019-09
2019-08
2019-07
2019-06
2019-05
2019-04
2019-03
2019-02
2019-01
pm10
11
21
22
13
16
15
16
3.4
0.85
5.3
12
16
32
24
38
18
IE0028A
2017-09 2020-05

index
2020-05
2020-04
2020-03
2020-02
2020-01
2019-12
2019-11
2019-10
2019-07
2019-06
2019-05
2019-04
2019-03
2019-02
2019-01
2018-12
2018-11
2018-10
2018-09
2018-08
2018-07
2018-06
2018-05
2018-04
2018-03
2018-02
2018-01
2017-10
2017-09
pm25
4.7
12
8.2
6.7
7.2
4.5
5.6
-
-
9.2
11
18
9.6
17
10
10
9
8.5
3.8
4.5
6.8
7.3
11
10
10
15
9.4
6.3
6.8
pm10
7.7
17
12
9.7
11
6.5
7.3
-
-
11
13
21
13
21
13
13
11
10
6.2
6.2
8.7
10
14
12
13
18
12
9
9.5
so2
1.5
1.6
1.4
3.5
0.94
0.57
0.51
0.01
-
0.5
0.79
1.2
0.9
1.5
1.4
1.6
0.65
1.3
0.47
1.1
1.6
3.1
12
1.5
2.5
2.6
-
1.3
1.1
no2
9.8
17
19
18
16
13
16
2.4
17
27
22
26
24
31
28
24
23
21
15
11
6.3
16
29
21
27
27
-
13
17
o3
64
61
55
57
51
26
17
4.8
28
48
54
63
56
48
36
44
40
41
37
36
39
51
51
61
51
47
-
47
40
IE002AP
index
2020-05
2020-04
2020-03
2020-02
2020-01
2019-12
2019-11
2019-10
2019-09
2019-08
2019-07
2019-06
2019-05
2019-04
2019-03
2019-02
2019-01
pm10
9.2
17
12
9.1
11
9.1
8.2
1.6
2.1
0.75
3.1
7.9
8.5
25
13
19
11
IE0036A
index
2020-05
2020-04
2020-03
2020-02
2020-01
2019-12
2019-11
2019-10
2019-09
2019-08
2019-07
2019-06
2019-05
2019-04
2019-03
2019-02
2019-01
no2
7.8
14
14
12
17
18
23
15
9.8
8.3
7.4
11
6.2
27
15
29
24
pm10
9.6
18
15
10
13
12
13
9.7
7.4
7
6.9
8.7
11
31
16
26
14
IE003AP
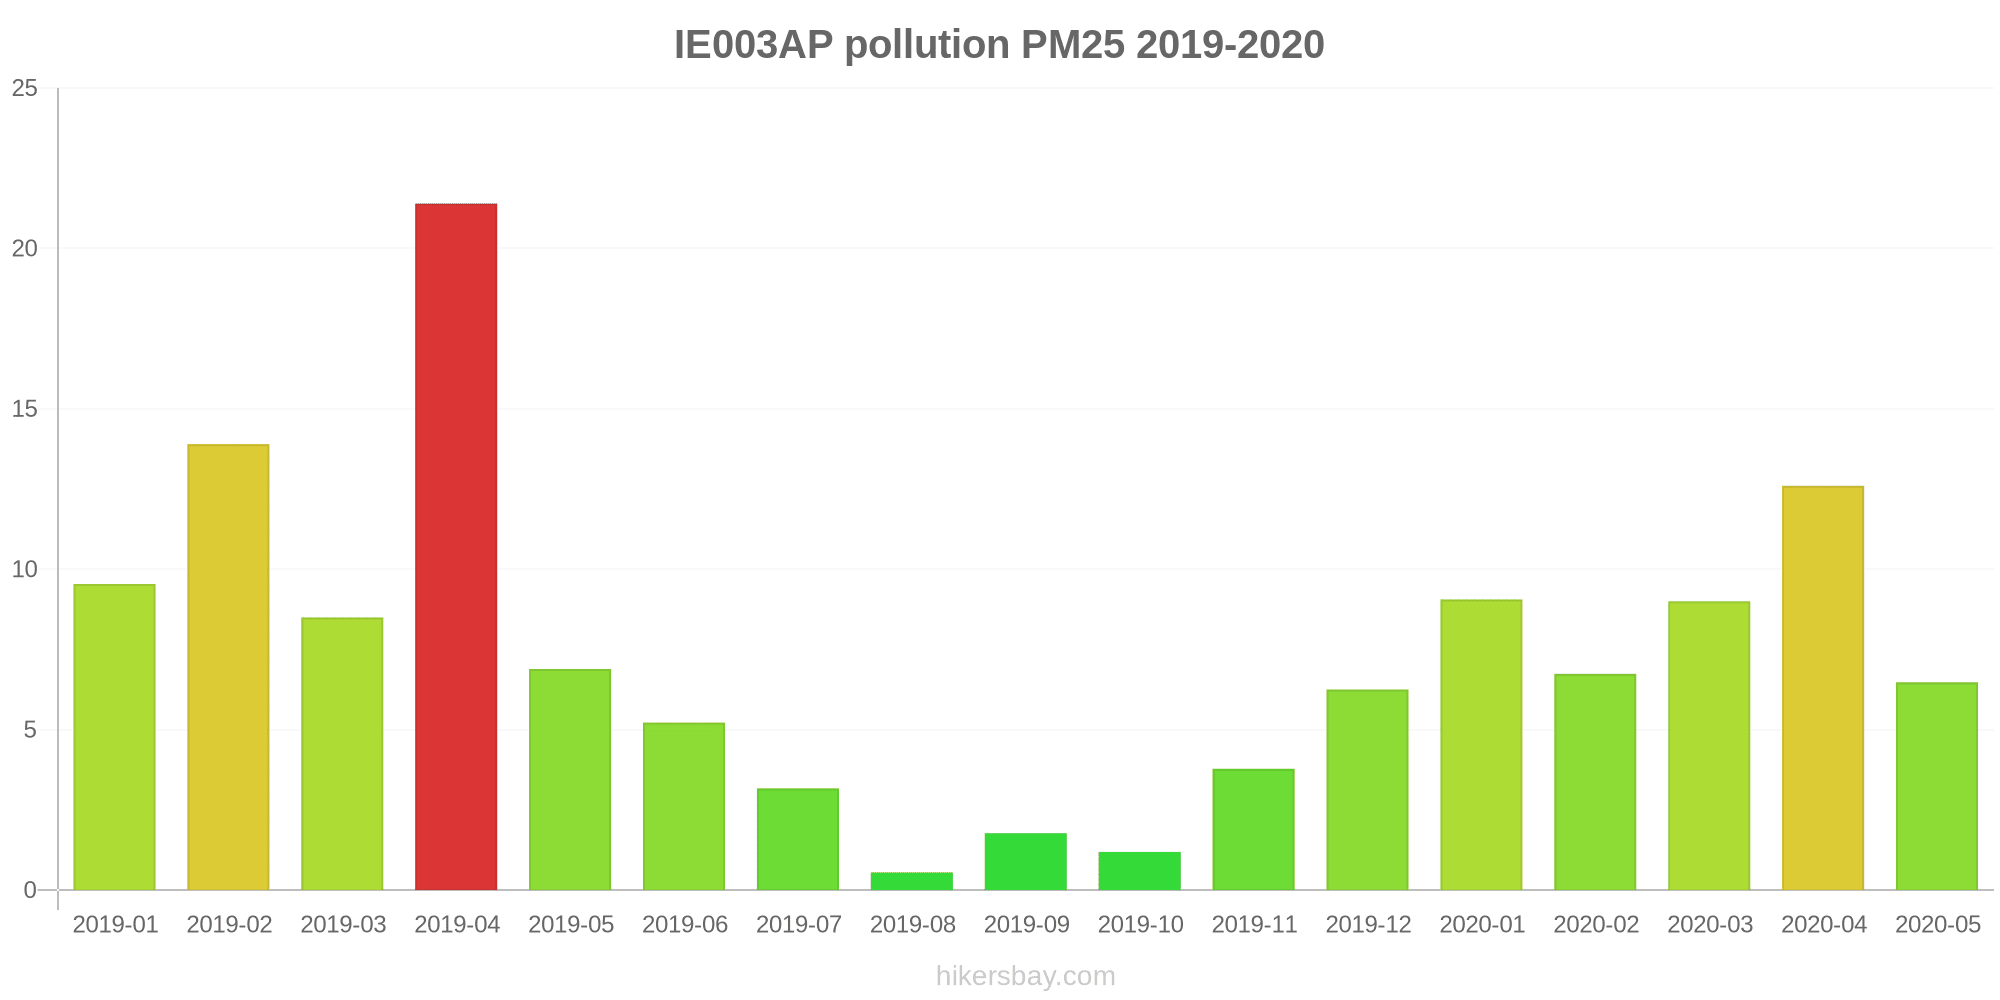
2019-01 2020-05

index
2020-05
2020-04
2020-03
2020-02
2020-01
2019-12
2019-11
2019-10
2019-09
2019-08
2019-07
2019-06
2019-05
2019-04
2019-03
2019-02
2019-01
pm25
6.5
13
9
6.7
9.1
6.3
3.8
1.2
1.8
0.55
3.2
5.2
6.9
21
8.5
14
9.5
pm10
10
19
15
11
13
8.8
6.6
1.8
2.8
0.9
7.2
8.5
11
27
14
20
12
IE0098A
index
2020-05
2020-04
2020-03
2020-02
2020-01
2019-12
2019-11
2019-10
2019-09
2019-08
2019-07
2019-06
2019-05
2019-04
2019-03
2019-02
2019-01
2018-12
2018-11
2018-10
2018-09
2018-08
2018-07
2018-06
2018-05
2018-04
2018-03
2018-02
2018-01
2017-12
2017-10
2017-09
co
0.26
0.34
0.32
0.29
0.32
0.34
0.34
0.03
0.14
0.03
0.15
0.23
0.28
0.46
0.35
0.47
0.4
0.4
0.32
0.33
0.3
0.24
0.34
0.34
0.32
0.43
0.48
0.42
0.39
0.34
0.38
0.41
no2
12
17
19
19
24
28
31
2.5
10
1.9
10
19
23
36
30
39
36
34
30
29
24
19
27
30
32
26
-
-
-
-
-
-
so2
2.1
3.2
5.9
6.3
3.8
1.8
1.2
0.16
0.29
0.17
0.73
0.93
0.99
13
19
9.4
3.8
-
-
-
-
-
8.5
9.1
-
-
-
-
-
-
-
-
* Pollution data source:
https://openaq.org
(EEA Ireland)
The data is licensed under CC-By 4.0
NO2 66 (Moderate)
PM10 14 (Good)
PM2,5 9 (Good)
SO2 5 (Good)
O3 1 (Good)
CO 200 (Good)
Data on air pollution from recent days in Dublin City
| index | 2024-01-10 | 2024-01-11 | 2024-01-12 | 2024-01-13 | 2024-01-14 | 2024-01-15 | 2024-01-16 | 2024-01-17 |
|---|---|---|---|---|---|---|---|---|
| pm25 | 4 Good |
4 Good |
10 Good |
18 Moderate |
9 Good |
10 Good |
6 Good |
9 Good |
| pm10 | 10 Good |
9 Good |
13 Good |
20 Moderate |
11 Good |
15 Good |
10 Good |
12 Good |
| no2 | 21 Good |
22 Good |
21 Good |
21 Good |
19 Good |
32 Good |
17 Good |
34 Good |
| so2 | 1 Good |
1 Good |
1 Good |
2 Good |
3 Good |
4 Good |
2 Good |
4 Good |
| o3 | 49 Good |
51 Good |
33 Good |
20 Good |
35 Good |
26 Good |
54 Good |
21 Good |
| co | 170 Good |
164 Good |
130 Good |
175 Good |
146 Good |
158 Good |
105 Good |
159 Good |

| index | 2020-05 | 2020-04 | 2020-03 | 2020-02 | 2020-01 | 2019-12 | 2019-11 | 2019-09 | 2019-08 | 2019-07 | 2019-06 | 2019-05 | 2019-04 | 2019-03 | 2019-02 | 2019-01 | 2019-10 | 2018-12 | 2018-11 | 2018-10 | 2018-09 | 2018-08 | 2018-07 | 2018-06 | 2018-05 | 2018-04 | 2018-03 | 2018-02 | 2018-01 | 2017-10 | 2017-09 | 2017-12 |
|---|---|---|---|---|---|---|---|---|---|---|---|---|---|---|---|---|---|---|---|---|---|---|---|---|---|---|---|---|---|---|---|---|
| pm10 | 9.6 (Good) | 18 (Good) | 15 (Good) | 11 (Good) | 13 (Good) | 10 (Good) | 10 (Good) | 3.9 (Good) | 2.4 (Good) | 5.6 (Good) | 9.8 (Good) | 12 (Good) | 27 (Moderate) | 16 (Good) | 25 (Moderate) | 14 (Good) | 4.4 (Good) | 13 (Good) | 11 (Good) | 10 (Good) | 6.2 (Good) | 6.2 (Good) | 8.7 (Good) | 10 (Good) | 14 (Good) | 12 (Good) | 13 (Good) | 18 (Good) | 12 (Good) | 9 (Good) | 9.5 (Good) | - (Good) |
| no2 | 9.8 (Good) | 16 (Good) | 17 (Good) | 16 (Good) | 19 (Good) | 20 (Good) | 24 (Good) | 10 (Good) | 5.1 (Good) | 12 (Good) | 19 (Good) | 17 (Good) | 30 (Good) | 23 (Good) | 33 (Good) | 29 (Good) | 6.5 (Good) | 29 (Good) | 27 (Good) | 25 (Good) | 19 (Good) | 15 (Good) | 17 (Good) | 23 (Good) | 31 (Good) | 23 (Good) | 27 (Good) | 27 (Good) | - (Good) | 13 (Good) | 17 (Good) | - (Good) |
| o3 | 64 (Good) | 61 (Good) | 55 (Good) | 57 (Good) | 51 (Good) | 26 (Good) | 17 (Good) | - (Good) | - (Good) | 28 (Good) | 48 (Good) | 54 (Good) | 63 (Good) | 56 (Good) | 48 (Good) | 36 (Good) | 4.8 (Good) | 44 (Good) | 40 (Good) | 41 (Good) | 37 (Good) | 36 (Good) | 39 (Good) | 51 (Good) | 51 (Good) | 61 (Good) | 51 (Good) | 47 (Good) | - (Good) | 47 (Good) | 40 (Good) | - (Good) |
| pm25 | 5.6 (Good) | 12 (Good) | 8.6 (Good) | 6.7 (Good) | 8.1 (Good) | 5.4 (Good) | 4.7 (Good) | 1.8 (Good) | 0.55 (Good) | 3.2 (Good) | 7.2 (Good) | 9.1 (Good) | 20 (Moderate) | 9.1 (Good) | 15 (Moderate) | 10 (Good) | 1.2 (Good) | 10 (Good) | 9 (Good) | 8.5 (Good) | 3.8 (Good) | 4.5 (Good) | 6.8 (Good) | 7.3 (Good) | 11 (Good) | 10 (Good) | 10 (Good) | 15 (Moderate) | 9.4 (Good) | 6.3 (Good) | 6.8 (Good) | - (Good) |
| so2 | 1.8 (Good) | 2.4 (Good) | 3.7 (Good) | 4.9 (Good) | 2.4 (Good) | 1.2 (Good) | 0.83 (Good) | 0.29 (Good) | 0.17 (Good) | 0.73 (Good) | 0.72 (Good) | 0.89 (Good) | 7 (Good) | 10 (Good) | 5.5 (Good) | 2.6 (Good) | 0.09 (Good) | 1.6 (Good) | 0.65 (Good) | 1.3 (Good) | 0.47 (Good) | 1.1 (Good) | 5.1 (Good) | 6.1 (Good) | 12 (Good) | 1.5 (Good) | 2.5 (Good) | 2.6 (Good) | - (Good) | 1.3 (Good) | 1.1 (Good) | - (Good) |
| co | 0.26 (Good) | 0.34 (Good) | 0.32 (Good) | 0.29 (Good) | 0.32 (Good) | 0.34 (Good) | 0.34 (Good) | 0.14 (Good) | 0.03 (Good) | 0.15 (Good) | 0.23 (Good) | 0.28 (Good) | 0.46 (Good) | 0.35 (Good) | 0.47 (Good) | 0.4 (Good) | 0.03 (Good) | 0.4 (Good) | 0.32 (Good) | 0.33 (Good) | 0.3 (Good) | 0.24 (Good) | 0.34 (Good) | 0.34 (Good) | 0.32 (Good) | 0.43 (Good) | 0.48 (Good) | 0.42 (Good) | 0.39 (Good) | 0.38 (Good) | 0.41 (Good) | 0.34 (Good) |
Green and Parks in the City
Dublin City 76%
Isle of Man: 78% United Kingdom: 75% Netherlands: 82% Belgium: 64% Faroe Islands: 87%particulate matter PM2.5
Dublin City 11 (Good)
Pleasure of spending time in the city
Dublin City 72%
Isle of Man: 83% United Kingdom: 70% Netherlands: 88% Belgium: 64% Faroe Islands: 100%particulate matter PM10
Dublin City 16 (Good)
Air Pollution
Dublin City 33%
Isle of Man: 13% United Kingdom: 37% Netherlands: 21% Belgium: 45% Faroe Islands: 0%Garbage Disposal
Dublin City 57%
Isle of Man: 78% United Kingdom: 60% Netherlands: 79% Belgium: 54% Faroe Islands: 88%Availability and quality of drinking water
Dublin City 70%
Isle of Man: 88% United Kingdom: 75% Netherlands: 92% Belgium: 70% Faroe Islands: 98%Cleanliness and tidiness
Dublin City 46%
Isle of Man: 69% United Kingdom: 53% Netherlands: 77% Belgium: 46% Faroe Islands: 94%Noise and Light pollution
Dublin City 44%
Isle of Man: 12% United Kingdom: 47% Netherlands: 31% Belgium: 54% Faroe Islands: 21%Water Pollution
Dublin City 40%
Isle of Man: 13% United Kingdom: 31% Netherlands: 17% Belgium: 42% Faroe Islands: 7.7%NO2 63 (Moderate)
nitrogen dioxide (NO2)PM10 20 (Good)
particulate matter (PM10) suspended dustPM2,5 11 (Good)
particulate matter (PM2.5) dustNO2 82 (Moderate)
nitrogen dioxide (NO2)PM10 22 (Moderate)
particulate matter (PM10) suspended dustPM2,5 13 (Moderate)
particulate matter (PM2.5) dustSO2 6 (Good)
sulfur dioxide (SO2)O3 0.72 (Good)
ozone (O3)PM2,5 4.9 (Good)
particulate matter (PM2.5) dustPM10 7.5 (Good)
particulate matter (PM10) suspended dustPM2,5 8.5 (Good)
particulate matter (PM2.5) dustNO2 63 (Moderate)
nitrogen dioxide (NO2)PM10 13 (Good)
particulate matter (PM10) suspended dustPM10 8.8 (Good)
particulate matter (PM10) suspended dustPM2,5 5.3 (Good)
particulate matter (PM2.5) dustCO 200 (Good)
carbon monoxide (CO)NO2 57 (Moderate)
nitrogen dioxide (NO2)SO2 4.7 (Good)
sulfur dioxide (SO2)IE001AP
| index | 2024-01-17 | 2024-01-16 | 2024-01-15 | 2024-01-14 | 2024-01-13 | 2024-01-12 | 2024-01-11 | 2024-01-10 |
|---|---|---|---|---|---|---|---|---|
| pm25 | 10 | 6.5 | 9.5 | 8.9 | 17 | 10 | 4.6 | 4.7 |
| pm10 | 14 | 11 | 16 | 11 | 20 | 16 | 10 | 11 |
| no2 | 38 | 25 | 36 | 19 | 24 | 23 | 26 | 26 |
Dublin Rathmines Wynnefield Road
| index | 2024-01-17 | 2024-01-16 | 2024-01-15 | 2024-01-14 | 2024-01-13 | 2024-01-12 | 2024-01-11 | 2024-01-10 |
|---|---|---|---|---|---|---|---|---|
| so2 | 3.9 | 2.8 | 3.1 | 2.7 | 2 | 1.5 | 1.7 | 1.9 |
| pm25 | 12 | 6.5 | 12 | 12 | 19 | 11 | 6.7 | 6.5 |
| pm10 | 14 | 9.5 | 17 | 14 | 21 | 15 | 14 | 15 |
| no2 | 35 | 13 | 32 | 17 | 23 | 25 | 23 | 19 |
| o3 | 21 | 54 | 26 | 35 | 20 | 33 | 51 | 49 |
IE002AP
| index | 2024-01-17 | 2024-01-16 | 2024-01-15 | 2024-01-14 | 2024-01-13 | 2024-01-12 | 2024-01-11 | 2024-01-10 |
|---|---|---|---|---|---|---|---|---|
| pm10 | 9.5 | 12 | 13 | 8.9 | 19 | 11 | 6.6 | 7.2 |
| pm25 | 7.7 | 6.7 | 9.2 | 7 | 17 | 8.1 | 3.3 | 3 |
IE0036A
| index | 2024-01-17 | 2024-01-16 | 2024-01-15 | 2024-01-14 | 2024-01-13 | 2024-01-12 | 2024-01-11 | 2024-01-10 |
|---|---|---|---|---|---|---|---|---|
| pm10 | 13 | 9.1 | 15 | 12 | 21 | 13 | 8.4 | 9.4 |
| pm25 | 10 | 5.7 | 10 | 9.9 | 20 | 10 | 4 | 4.5 |
| no2 | 28 | 13 | 27 | 14 | 17 | 16 | 15 | 15 |
IE003AP
| index | 2024-01-17 | 2024-01-16 | 2024-01-15 | 2024-01-14 | 2024-01-13 | 2024-01-12 | 2024-01-11 | 2024-01-10 |
|---|---|---|---|---|---|---|---|---|
| pm10 | 9.3 | 8.7 | 14 | 9 | 19 | 12 | 6.9 | 7.6 |
| pm25 | 7.2 | 5.9 | 10 | 7.2 | 18 | 8.9 | 3.3 | 3.4 |
Dublin Winetavern Street
| index | 2024-01-17 | 2024-01-16 | 2024-01-15 | 2024-01-14 | 2024-01-13 | 2024-01-12 | 2024-01-11 | 2024-01-10 |
|---|---|---|---|---|---|---|---|---|
| no2 | 36 | 18 | 33 | 24 | 22 | 18 | 24 | 22 |
| so2 | 3.1 | 1.3 | 4.2 | 2.3 | 1.9 | 0.87 | 0.93 | 1 |
| co | 159 | 105 | 158 | 146 | 175 | 130 | 164 | 170 |
IE001AP
| index | 2020-05 | 2020-04 | 2020-03 | 2020-02 | 2020-01 | 2019-12 | 2019-11 | 2019-09 | 2019-08 | 2019-07 | 2019-06 | 2019-05 | 2019-04 | 2019-03 | 2019-02 | 2019-01 |
|---|---|---|---|---|---|---|---|---|---|---|---|---|---|---|---|---|
| pm10 | 11 | 21 | 22 | 13 | 16 | 15 | 16 | 3.4 | 0.85 | 5.3 | 12 | 16 | 32 | 24 | 38 | 18 |
IE0028A
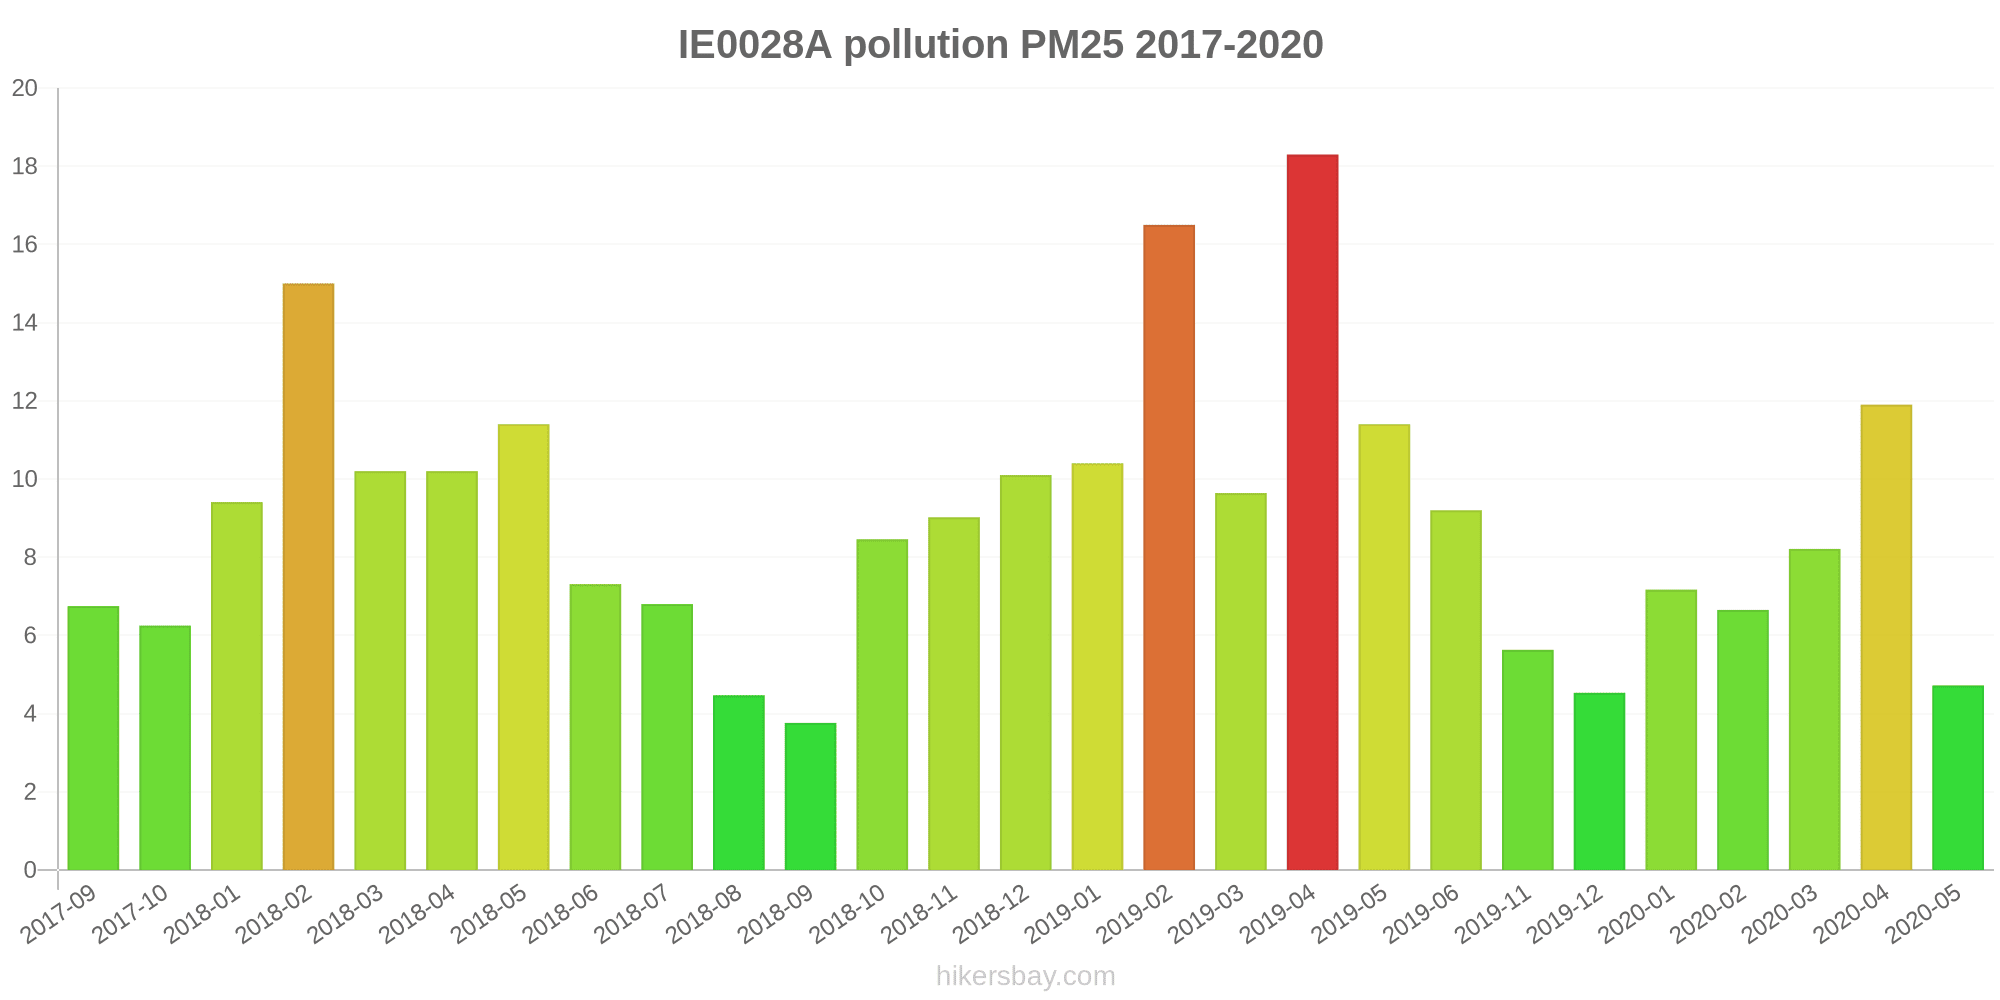
| index | 2020-05 | 2020-04 | 2020-03 | 2020-02 | 2020-01 | 2019-12 | 2019-11 | 2019-10 | 2019-07 | 2019-06 | 2019-05 | 2019-04 | 2019-03 | 2019-02 | 2019-01 | 2018-12 | 2018-11 | 2018-10 | 2018-09 | 2018-08 | 2018-07 | 2018-06 | 2018-05 | 2018-04 | 2018-03 | 2018-02 | 2018-01 | 2017-10 | 2017-09 |
|---|---|---|---|---|---|---|---|---|---|---|---|---|---|---|---|---|---|---|---|---|---|---|---|---|---|---|---|---|---|
| pm25 | 4.7 | 12 | 8.2 | 6.7 | 7.2 | 4.5 | 5.6 | - | - | 9.2 | 11 | 18 | 9.6 | 17 | 10 | 10 | 9 | 8.5 | 3.8 | 4.5 | 6.8 | 7.3 | 11 | 10 | 10 | 15 | 9.4 | 6.3 | 6.8 |
| pm10 | 7.7 | 17 | 12 | 9.7 | 11 | 6.5 | 7.3 | - | - | 11 | 13 | 21 | 13 | 21 | 13 | 13 | 11 | 10 | 6.2 | 6.2 | 8.7 | 10 | 14 | 12 | 13 | 18 | 12 | 9 | 9.5 |
| so2 | 1.5 | 1.6 | 1.4 | 3.5 | 0.94 | 0.57 | 0.51 | 0.01 | - | 0.5 | 0.79 | 1.2 | 0.9 | 1.5 | 1.4 | 1.6 | 0.65 | 1.3 | 0.47 | 1.1 | 1.6 | 3.1 | 12 | 1.5 | 2.5 | 2.6 | - | 1.3 | 1.1 |
| no2 | 9.8 | 17 | 19 | 18 | 16 | 13 | 16 | 2.4 | 17 | 27 | 22 | 26 | 24 | 31 | 28 | 24 | 23 | 21 | 15 | 11 | 6.3 | 16 | 29 | 21 | 27 | 27 | - | 13 | 17 |
| o3 | 64 | 61 | 55 | 57 | 51 | 26 | 17 | 4.8 | 28 | 48 | 54 | 63 | 56 | 48 | 36 | 44 | 40 | 41 | 37 | 36 | 39 | 51 | 51 | 61 | 51 | 47 | - | 47 | 40 |
IE002AP
| index | 2020-05 | 2020-04 | 2020-03 | 2020-02 | 2020-01 | 2019-12 | 2019-11 | 2019-10 | 2019-09 | 2019-08 | 2019-07 | 2019-06 | 2019-05 | 2019-04 | 2019-03 | 2019-02 | 2019-01 |
|---|---|---|---|---|---|---|---|---|---|---|---|---|---|---|---|---|---|
| pm10 | 9.2 | 17 | 12 | 9.1 | 11 | 9.1 | 8.2 | 1.6 | 2.1 | 0.75 | 3.1 | 7.9 | 8.5 | 25 | 13 | 19 | 11 |
IE0036A
| index | 2020-05 | 2020-04 | 2020-03 | 2020-02 | 2020-01 | 2019-12 | 2019-11 | 2019-10 | 2019-09 | 2019-08 | 2019-07 | 2019-06 | 2019-05 | 2019-04 | 2019-03 | 2019-02 | 2019-01 |
|---|---|---|---|---|---|---|---|---|---|---|---|---|---|---|---|---|---|
| no2 | 7.8 | 14 | 14 | 12 | 17 | 18 | 23 | 15 | 9.8 | 8.3 | 7.4 | 11 | 6.2 | 27 | 15 | 29 | 24 |
| pm10 | 9.6 | 18 | 15 | 10 | 13 | 12 | 13 | 9.7 | 7.4 | 7 | 6.9 | 8.7 | 11 | 31 | 16 | 26 | 14 |
IE003AP
| index | 2020-05 | 2020-04 | 2020-03 | 2020-02 | 2020-01 | 2019-12 | 2019-11 | 2019-10 | 2019-09 | 2019-08 | 2019-07 | 2019-06 | 2019-05 | 2019-04 | 2019-03 | 2019-02 | 2019-01 |
|---|---|---|---|---|---|---|---|---|---|---|---|---|---|---|---|---|---|
| pm25 | 6.5 | 13 | 9 | 6.7 | 9.1 | 6.3 | 3.8 | 1.2 | 1.8 | 0.55 | 3.2 | 5.2 | 6.9 | 21 | 8.5 | 14 | 9.5 |
| pm10 | 10 | 19 | 15 | 11 | 13 | 8.8 | 6.6 | 1.8 | 2.8 | 0.9 | 7.2 | 8.5 | 11 | 27 | 14 | 20 | 12 |
IE0098A
| index | 2020-05 | 2020-04 | 2020-03 | 2020-02 | 2020-01 | 2019-12 | 2019-11 | 2019-10 | 2019-09 | 2019-08 | 2019-07 | 2019-06 | 2019-05 | 2019-04 | 2019-03 | 2019-02 | 2019-01 | 2018-12 | 2018-11 | 2018-10 | 2018-09 | 2018-08 | 2018-07 | 2018-06 | 2018-05 | 2018-04 | 2018-03 | 2018-02 | 2018-01 | 2017-12 | 2017-10 | 2017-09 |
|---|---|---|---|---|---|---|---|---|---|---|---|---|---|---|---|---|---|---|---|---|---|---|---|---|---|---|---|---|---|---|---|---|
| co | 0.26 | 0.34 | 0.32 | 0.29 | 0.32 | 0.34 | 0.34 | 0.03 | 0.14 | 0.03 | 0.15 | 0.23 | 0.28 | 0.46 | 0.35 | 0.47 | 0.4 | 0.4 | 0.32 | 0.33 | 0.3 | 0.24 | 0.34 | 0.34 | 0.32 | 0.43 | 0.48 | 0.42 | 0.39 | 0.34 | 0.38 | 0.41 |
| no2 | 12 | 17 | 19 | 19 | 24 | 28 | 31 | 2.5 | 10 | 1.9 | 10 | 19 | 23 | 36 | 30 | 39 | 36 | 34 | 30 | 29 | 24 | 19 | 27 | 30 | 32 | 26 | - | - | - | - | - | - |
| so2 | 2.1 | 3.2 | 5.9 | 6.3 | 3.8 | 1.8 | 1.2 | 0.16 | 0.29 | 0.17 | 0.73 | 0.93 | 0.99 | 13 | 19 | 9.4 | 3.8 | - | - | - | - | - | 8.5 | 9.1 | - | - | - | - | - | - | - | - |