Air Pollution in Yamunanagar: Real-time Air Quality Index and smog alert.
Pollution and air quality forecast for Yamunanagar. Today is Wednesday, May 13, 2026. The following air pollution values have been recorded for Yamunanagar:- particulate matter (PM10) suspended dust - 112 (Very Unhealthy)
- sulfur dioxide (SO2) - 12 (Good)
- particulate matter (PM2.5) dust - 54 (Unhealthy for Sensitive Groups)
- carbon monoxide (CO) - 1240 (Good)
- nitrogen dioxide (NO2) - 4 (Good)
- ozone (O3) - 2 (Good)

What is the air quality in Yamunanagar today? Is the air polluted in Yamunanagar?. Is there smog?
What is the level of PM10 today in Yamunanagar? (particulate matter (PM10) suspended dust)
The current level of particulate matter PM10 in Yamunanagar is:
112 (Very Unhealthy)
The highest PM10 values usually occur in month: 244 (February 2019).
The lowest value of particulate matter PM10 pollution in Yamunanagar is usually recorded in: April (80).
What is the level of SO2 pollution? (sulfur dioxide (SO2))
12 (Good)
What is the current level of PM2.5 in Yamunanagar? (particulate matter (PM2.5) dust)
Today's PM2.5 level is:
54 (Unhealthy for Sensitive Groups)
For comparison, the highest level of PM2.5 in Yamunanagar in the last 7 days was: 53 (Monday, October 31, 2022) and the lowest: 53 (Monday, October 31, 2022).
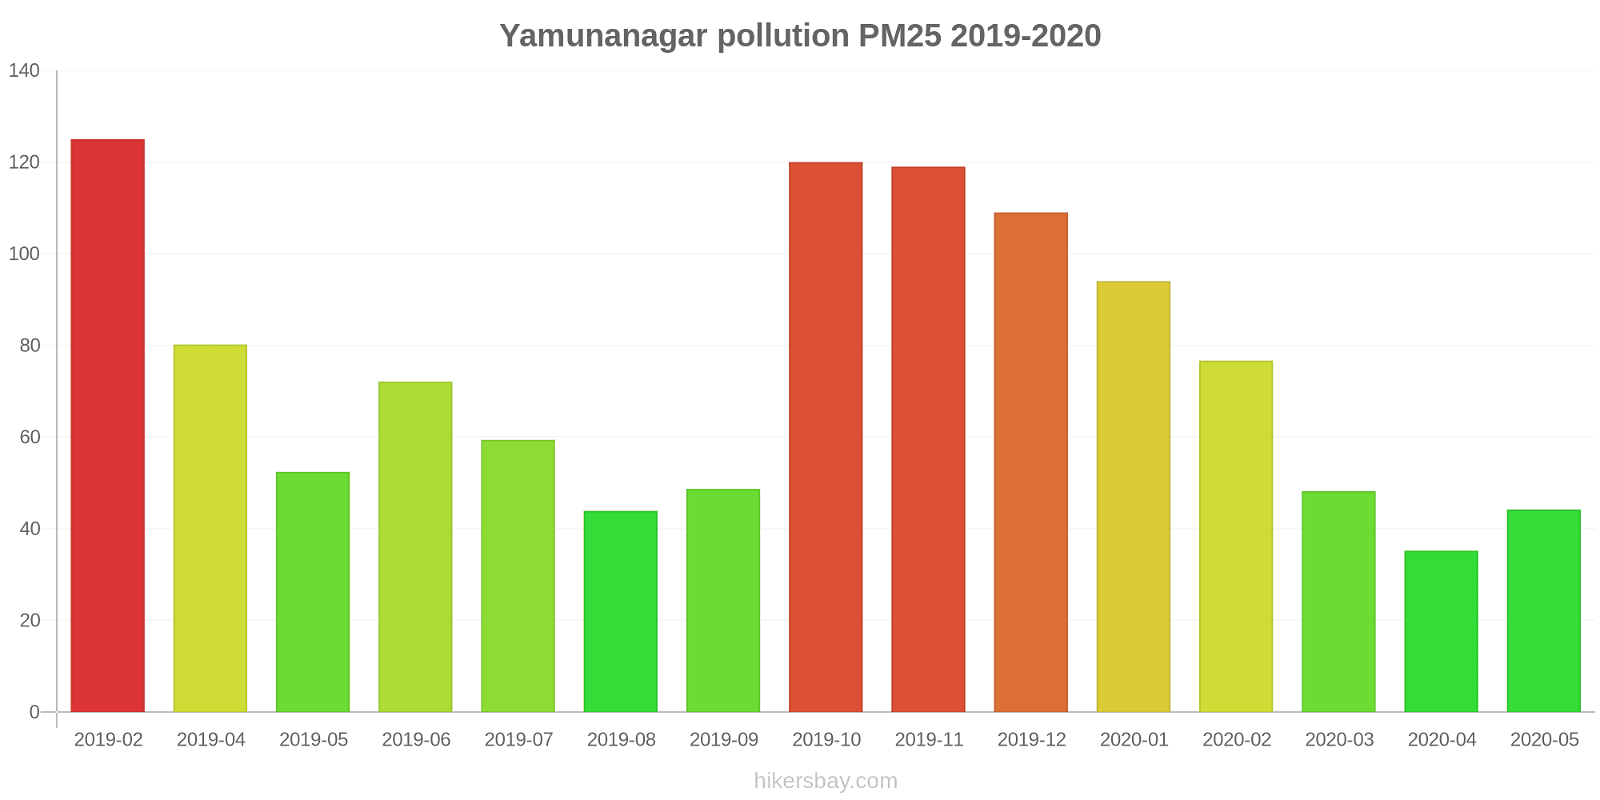
The highest PM2.5 values were recorded: 125 (February 2019).
The lowest level of particulate matter PM2.5 pollution occurs in month: April (35).
How high is the CO level? (carbon monoxide (CO))
1240 (Good)
How high is the level of NO2? (nitrogen dioxide (NO2))
4 (Good)
How is the O3 level today in Yamunanagar? (ozone (O3))
2 (Good)
Current data Monday, October 31, 2022, 1:30 AM
PM10 112 (Very Unhealthy)
SO2 12 (Good)
PM2,5 54 (Unhealthy for Sensitive Groups)
CO 1240 (Good)
NO2 4 (Good)
O3 2 (Good)
Data on air pollution from recent days in Yamunanagar
index
2022-10-31
pm10
110
Very Unhealthy
so2
39
Good
pm25
53
Unhealthy for Sensitive Groups
co
980
Good
no2
3
Good
o3
2
Good
data source »
Air pollution in Yamunanagar from February 2019 to May 2020
index
2020-05
2020-04
2020-03
2020-02
2020-01
2019-12
2019-11
2019-10
2019-09
2019-08
2019-07
2019-06
2019-05
2019-04
2019-02
pm25
44 (Unhealthy for Sensitive Groups)
35 (Unhealthy for Sensitive Groups)
48 (Unhealthy for Sensitive Groups)
77 (Very Unhealthy)
94 (Very Unhealthy)
109 (Very Unhealthy)
119 (Very bad Hazardous)
120 (Very bad Hazardous)
49 (Unhealthy for Sensitive Groups)
44 (Unhealthy for Sensitive Groups)
59 (Unhealthy)
72 (Unhealthy)
52 (Unhealthy for Sensitive Groups)
80 (Very Unhealthy)
125 (Very bad Hazardous)
pm10
100 (Unhealthy)
80 (Unhealthy for Sensitive Groups)
92 (Unhealthy)
139 (Very Unhealthy)
145 (Very Unhealthy)
172 (Very bad Hazardous)
198 (Very bad Hazardous)
216 (Very bad Hazardous)
98 (Unhealthy)
87 (Unhealthy)
107 (Unhealthy)
159 (Very bad Hazardous)
102 (Unhealthy)
207 (Very bad Hazardous)
244 (Very bad Hazardous)
no2
19 (Good)
23 (Good)
33 (Good)
27 (Good)
30 (Good)
28 (Good)
55 (Moderate)
34 (Good)
9.8 (Good)
15 (Good)
12 (Good)
17 (Good)
44 (Moderate)
42 (Moderate)
53 (Moderate)
so2
30 (Good)
39 (Good)
47 (Good)
29 (Good)
37 (Good)
18 (Good)
28 (Good)
15 (Good)
8.5 (Good)
8.2 (Good)
7.2 (Good)
7.6 (Good)
12 (Good)
6.9 (Good)
25 (Good)
co
548 (Good)
315 (Good)
465 (Good)
648 (Good)
873 (Good)
926 (Good)
955 (Good)
1 (Good)
667 (Good)
808 (Good)
772 (Good)
640 (Good)
613 (Good)
586 (Good)
1 (Good)
o3
13 (Good)
55 (Good)
33 (Good)
33 (Good)
28 (Good)
23 (Good)
42 (Good)
59 (Good)
46 (Good)
33 (Good)
53 (Good)
52 (Good)
23 (Good)
29 (Good)
64 (Good)
data source »
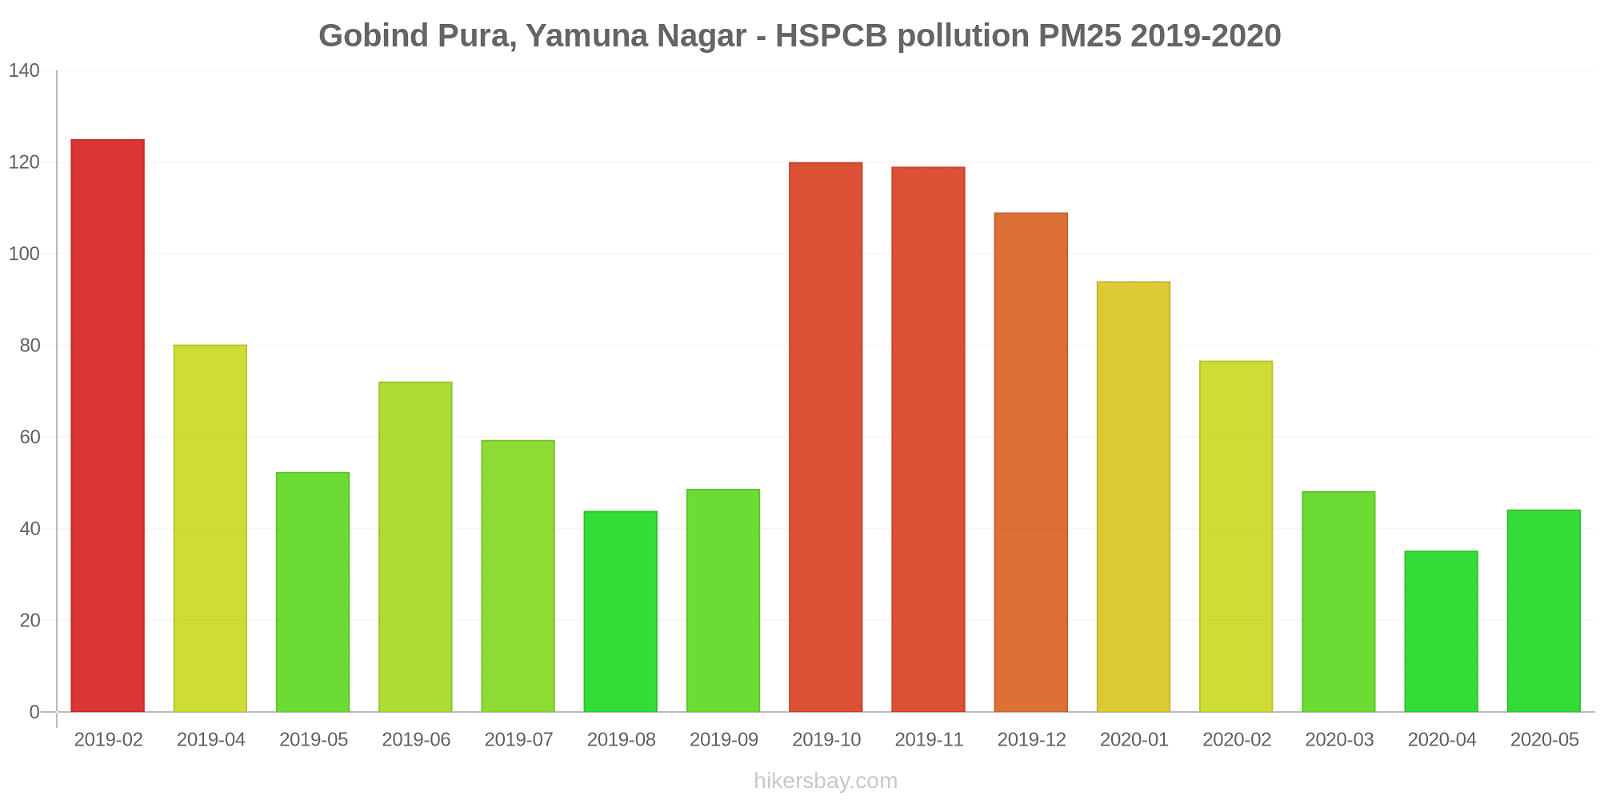
Gobind Pura, Yamuna Nagar - HSPCB
Monday, October 31, 2022, 1:30 AM
PM10 112 (Very Unhealthy)
particulate matter (PM10) suspended dust
SO2 12 (Good)
sulfur dioxide (SO2)
PM2,5 54 (Unhealthy for Sensitive Groups)
particulate matter (PM2.5) dust
CO 1240 (Good)
carbon monoxide (CO)
NO2 3.5 (Good)
nitrogen dioxide (NO2)
O3 1.7 (Good)
ozone (O3)
Gobind Pura, Yamuna Nagar - HSPCB
index
2022-10-31
pm10
110
so2
39
pm25
53
co
980
no2
3.3
o3
1.7
Gobind Pura, Yamuna Nagar - HSPCB
2019-02 2020-05
index
2020-05
2020-04
2020-03
2020-02
2020-01
2019-12
2019-11
2019-10
2019-09
2019-08
2019-07
2019-06
2019-05
2019-04
2019-02
pm25
44
35
48
77
94
109
119
120
49
44
59
72
52
80
125
pm10
100
80
92
139
145
172
198
216
98
87
107
159
102
207
244
no2
19
23
33
27
30
28
55
34
9.8
15
12
17
44
42
53
so2
30
39
47
29
37
18
28
15
8.5
8.2
7.2
7.6
12
6.9
25
co
548
315
465
648
873
926
955
1
667
808
772
640
613
586
1
o3
13
55
33
33
28
23
42
59
46
33
53
52
23
29
64
* Pollution data source:
https://openaq.org
(caaqm)
The data is licensed under CC-By 4.0
PM10 112 (Very Unhealthy)
SO2 12 (Good)
PM2,5 54 (Unhealthy for Sensitive Groups)
CO 1240 (Good)
NO2 4 (Good)
O3 2 (Good)
Data on air pollution from recent days in Yamunanagar
| index | 2022-10-31 |
|---|---|
| pm10 | 110 Very Unhealthy |
| so2 | 39 Good |
| pm25 | 53 Unhealthy for Sensitive Groups |
| co | 980 Good |
| no2 | 3 Good |
| o3 | 2 Good |

| index | 2020-05 | 2020-04 | 2020-03 | 2020-02 | 2020-01 | 2019-12 | 2019-11 | 2019-10 | 2019-09 | 2019-08 | 2019-07 | 2019-06 | 2019-05 | 2019-04 | 2019-02 |
|---|---|---|---|---|---|---|---|---|---|---|---|---|---|---|---|
| pm25 | 44 (Unhealthy for Sensitive Groups) | 35 (Unhealthy for Sensitive Groups) | 48 (Unhealthy for Sensitive Groups) | 77 (Very Unhealthy) | 94 (Very Unhealthy) | 109 (Very Unhealthy) | 119 (Very bad Hazardous) | 120 (Very bad Hazardous) | 49 (Unhealthy for Sensitive Groups) | 44 (Unhealthy for Sensitive Groups) | 59 (Unhealthy) | 72 (Unhealthy) | 52 (Unhealthy for Sensitive Groups) | 80 (Very Unhealthy) | 125 (Very bad Hazardous) |
| pm10 | 100 (Unhealthy) | 80 (Unhealthy for Sensitive Groups) | 92 (Unhealthy) | 139 (Very Unhealthy) | 145 (Very Unhealthy) | 172 (Very bad Hazardous) | 198 (Very bad Hazardous) | 216 (Very bad Hazardous) | 98 (Unhealthy) | 87 (Unhealthy) | 107 (Unhealthy) | 159 (Very bad Hazardous) | 102 (Unhealthy) | 207 (Very bad Hazardous) | 244 (Very bad Hazardous) |
| no2 | 19 (Good) | 23 (Good) | 33 (Good) | 27 (Good) | 30 (Good) | 28 (Good) | 55 (Moderate) | 34 (Good) | 9.8 (Good) | 15 (Good) | 12 (Good) | 17 (Good) | 44 (Moderate) | 42 (Moderate) | 53 (Moderate) |
| so2 | 30 (Good) | 39 (Good) | 47 (Good) | 29 (Good) | 37 (Good) | 18 (Good) | 28 (Good) | 15 (Good) | 8.5 (Good) | 8.2 (Good) | 7.2 (Good) | 7.6 (Good) | 12 (Good) | 6.9 (Good) | 25 (Good) |
| co | 548 (Good) | 315 (Good) | 465 (Good) | 648 (Good) | 873 (Good) | 926 (Good) | 955 (Good) | 1 (Good) | 667 (Good) | 808 (Good) | 772 (Good) | 640 (Good) | 613 (Good) | 586 (Good) | 1 (Good) |
| o3 | 13 (Good) | 55 (Good) | 33 (Good) | 33 (Good) | 28 (Good) | 23 (Good) | 42 (Good) | 59 (Good) | 46 (Good) | 33 (Good) | 53 (Good) | 52 (Good) | 23 (Good) | 29 (Good) | 64 (Good) |
PM10 112 (Very Unhealthy)
particulate matter (PM10) suspended dustSO2 12 (Good)
sulfur dioxide (SO2)PM2,5 54 (Unhealthy for Sensitive Groups)
particulate matter (PM2.5) dustCO 1240 (Good)
carbon monoxide (CO)NO2 3.5 (Good)
nitrogen dioxide (NO2)O3 1.7 (Good)
ozone (O3)Gobind Pura, Yamuna Nagar - HSPCB
| index | 2022-10-31 |
|---|---|
| pm10 | 110 |
| so2 | 39 |
| pm25 | 53 |
| co | 980 |
| no2 | 3.3 |
| o3 | 1.7 |
Gobind Pura, Yamuna Nagar - HSPCB

| index | 2020-05 | 2020-04 | 2020-03 | 2020-02 | 2020-01 | 2019-12 | 2019-11 | 2019-10 | 2019-09 | 2019-08 | 2019-07 | 2019-06 | 2019-05 | 2019-04 | 2019-02 |
|---|---|---|---|---|---|---|---|---|---|---|---|---|---|---|---|
| pm25 | 44 | 35 | 48 | 77 | 94 | 109 | 119 | 120 | 49 | 44 | 59 | 72 | 52 | 80 | 125 |
| pm10 | 100 | 80 | 92 | 139 | 145 | 172 | 198 | 216 | 98 | 87 | 107 | 159 | 102 | 207 | 244 |
| no2 | 19 | 23 | 33 | 27 | 30 | 28 | 55 | 34 | 9.8 | 15 | 12 | 17 | 44 | 42 | 53 |
| so2 | 30 | 39 | 47 | 29 | 37 | 18 | 28 | 15 | 8.5 | 8.2 | 7.2 | 7.6 | 12 | 6.9 | 25 |
| co | 548 | 315 | 465 | 648 | 873 | 926 | 955 | 1 | 667 | 808 | 772 | 640 | 613 | 586 | 1 |
| o3 | 13 | 55 | 33 | 33 | 28 | 23 | 42 | 59 | 46 | 33 | 53 | 52 | 23 | 29 | 64 |