Air Pollution in Mewat: Real-time Air Quality Index and smog alert.
Pollution and air quality forecast for Mewat. Today is Wednesday, May 13, 2026. The following air pollution values have been recorded for Mewat:- nitrogen dioxide (NO2) - 15 (Good)
- carbon monoxide (CO) - 840 (Good)
- particulate matter (PM2.5) dust - 27 (Moderate)
- ozone (O3) - 21 (Good)
- sulfur dioxide (SO2) - 727 (Very bad Hazardous)
- particulate matter (PM10) suspended dust - 146 (Very Unhealthy)

What is the air quality in Mewat today? Is the air polluted in Mewat?. Is there smog?
How high is the level of NO2? (nitrogen dioxide (NO2))
15 (Good)
How high is the CO level? (carbon monoxide (CO))
840 (Good)
What is the current level of PM2.5 in Mewat? (particulate matter (PM2.5) dust)
Today's PM2.5 level is:
27 (Moderate)
For comparison, the highest level of PM2.5 in Mewat in the last 7 days was: 26 (Monday, October 31, 2022) and the lowest: 26 (Monday, October 31, 2022).
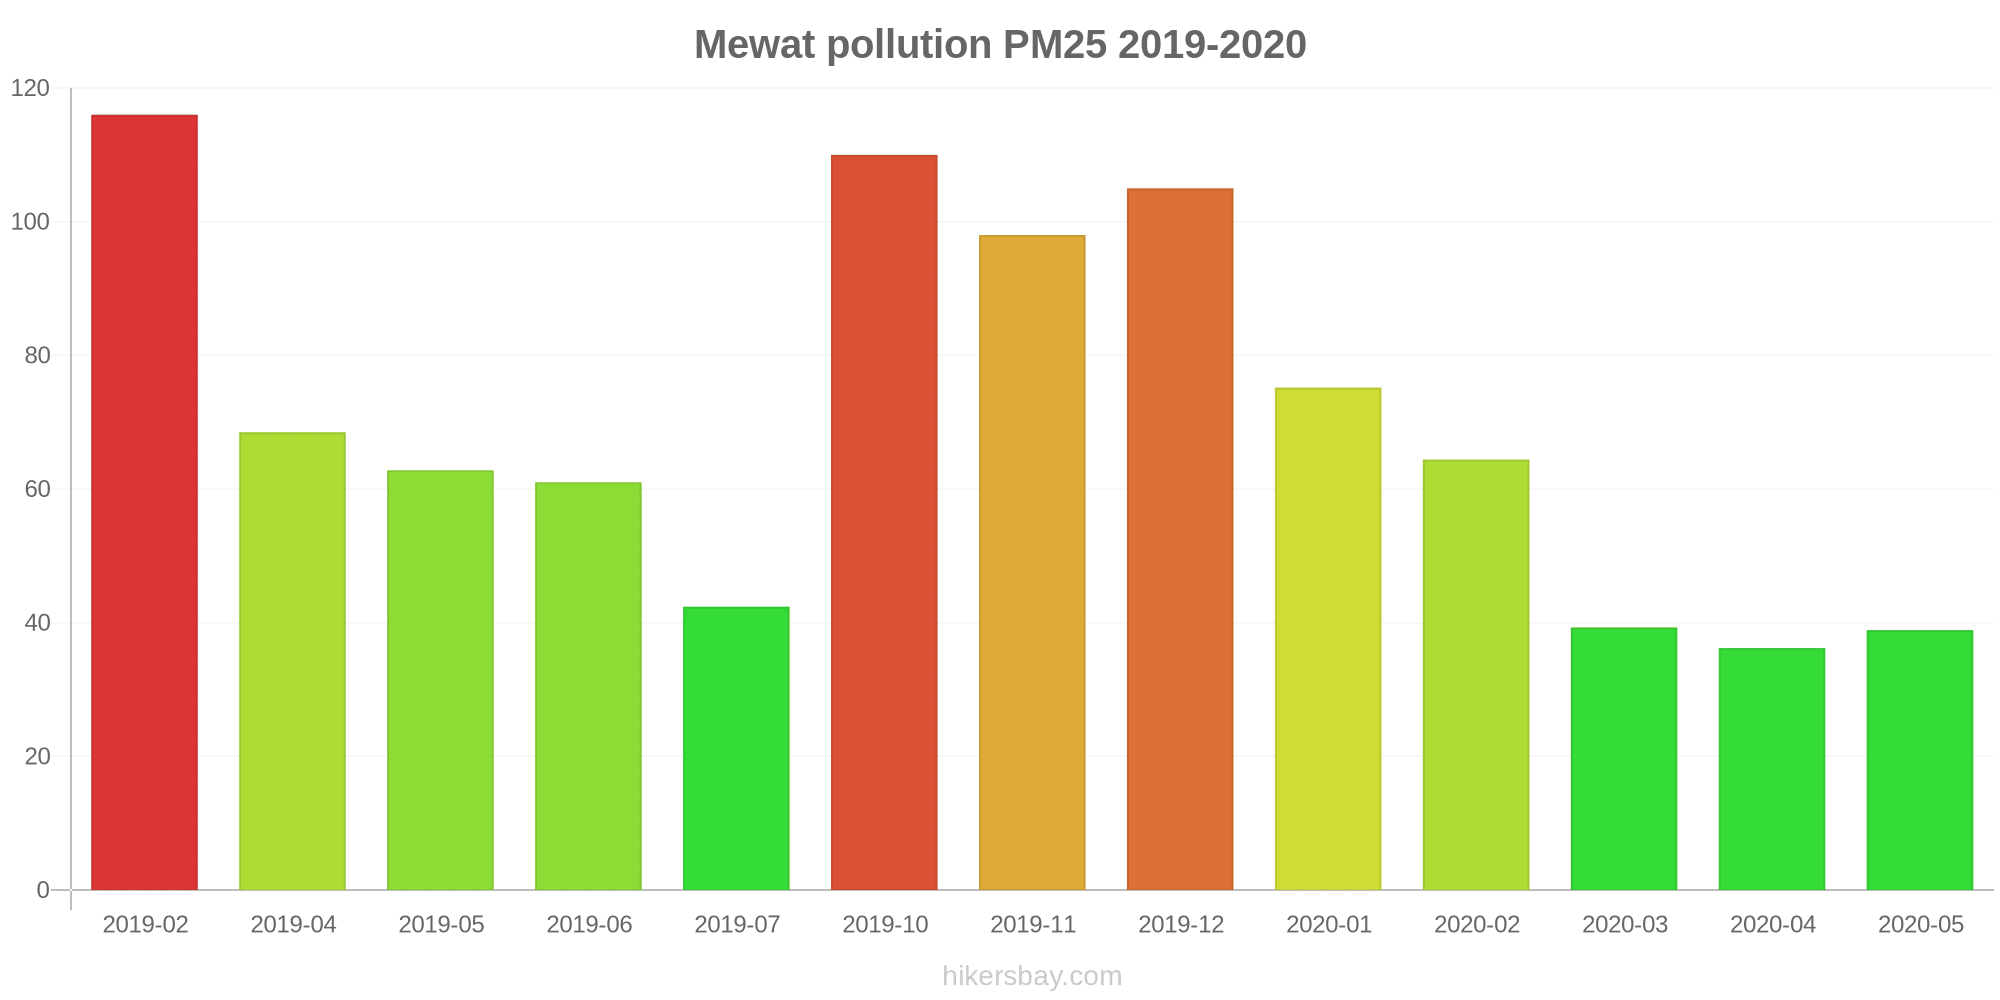
The highest PM2.5 values were recorded: 116 (February 2019).
The lowest level of particulate matter PM2.5 pollution occurs in month: April (36).
How is the O3 level today in Mewat? (ozone (O3))
21 (Good)
What is the level of SO2 pollution? (sulfur dioxide (SO2))
727 (Very bad Hazardous)
What is the level of PM10 today in Mewat? (particulate matter (PM10) suspended dust)
The current level of particulate matter PM10 in Mewat is:
146 (Very Unhealthy)
The highest PM10 values usually occur in month: 194 (April 2019).
The lowest value of particulate matter PM10 pollution in Mewat is usually recorded in: August (41).
Current data Monday, October 31, 2022, 1:45 AM
NO2 15 (Good)
CO 840 (Good)
PM2,5 27 (Moderate)
O3 21 (Good)
SO2 727 (Very bad Hazardous)
PM10 146 (Very Unhealthy)
Data on air pollution from recent days in Mewat
index
2022-10-31
no2
14
Good
co
805
Good
pm25
26
Moderate
o3
20
Good
so2
727
Very bad Hazardous
pm10
140
Very Unhealthy
data source »
Air pollution in Mewat from February 2019 to May 2020

index
2020-05
2020-04
2020-03
2020-02
2020-01
2019-12
2019-11
2019-10
2019-09
2019-08
2019-07
2019-06
2019-05
2019-04
2019-02
pm25
39 (Unhealthy for Sensitive Groups)
36 (Unhealthy for Sensitive Groups)
39 (Unhealthy for Sensitive Groups)
64 (Unhealthy)
75 (Very Unhealthy)
105 (Very Unhealthy)
98 (Very Unhealthy)
110 (Very bad Hazardous)
- (Good)
- (Good)
42 (Unhealthy for Sensitive Groups)
61 (Unhealthy)
63 (Unhealthy)
69 (Unhealthy)
116 (Very bad Hazardous)
pm10
87 (Unhealthy)
96 (Unhealthy)
91 (Unhealthy)
138 (Very Unhealthy)
134 (Very Unhealthy)
125 (Very Unhealthy)
146 (Very Unhealthy)
133 (Very Unhealthy)
63 (Unhealthy for Sensitive Groups)
41 (Moderate)
79 (Unhealthy for Sensitive Groups)
133 (Very Unhealthy)
164 (Very bad Hazardous)
194 (Very bad Hazardous)
171 (Very bad Hazardous)
no2
27 (Good)
27 (Good)
17 (Good)
5.9 (Good)
17 (Good)
14 (Good)
13 (Good)
21 (Good)
10 (Good)
12 (Good)
12 (Good)
19 (Good)
17 (Good)
12 (Good)
32 (Good)
so2
21 (Good)
20 (Good)
35 (Good)
10 (Good)
9.7 (Good)
14 (Good)
15 (Good)
7 (Good)
7.1 (Good)
8.3 (Good)
4.9 (Good)
6 (Good)
4.1 (Good)
4.2 (Good)
8.1 (Good)
co
174 (Good)
461 (Good)
1 (Good)
879 (Good)
1 (Good)
805 (Good)
1 (Good)
1 (Good)
907 (Good)
1 (Good)
1 (Good)
1 (Good)
1 (Good)
1 (Good)
1 (Good)
o3
49 (Good)
46 (Good)
78 (Moderate)
49 (Good)
27 (Good)
38 (Good)
44 (Good)
37 (Good)
8.9 (Good)
9.4 (Good)
18 (Good)
67 (Good)
34 (Good)
38 (Good)
33 (Good)
data source »
General Hospital, Mandikhera - HSPCB
Monday, October 31, 2022, 1:45 AM
NO2 15 (Good)
nitrogen dioxide (NO2)
CO 840 (Good)
carbon monoxide (CO)
PM2,5 27 (Moderate)
particulate matter (PM2.5) dust
O3 21 (Good)
ozone (O3)
SO2 727 (Very bad Hazardous)
sulfur dioxide (SO2)
PM10 146 (Very Unhealthy)
particulate matter (PM10) suspended dust
General Hospital, Mandikhera - HSPCB
index
2022-10-31
no2
14
co
805
pm25
26
o3
20
so2
727
pm10
140
General Hospital, Mandikhera - HSPCB
2019-02 2020-05

index
2020-05
2020-04
2020-03
2020-02
2020-01
2019-12
2019-11
2019-10
2019-09
2019-08
2019-07
2019-06
2019-05
2019-04
2019-02
pm25
39
36
39
64
75
105
98
110
-
-
42
61
63
69
116
pm10
87
96
91
138
134
125
146
133
63
41
79
133
164
194
171
no2
27
27
17
5.9
17
14
13
21
10
12
12
19
17
12
32
so2
21
20
35
10
9.7
14
15
7
7.1
8.3
4.9
6
4.1
4.2
8.1
co
174
461
1
879
1
805
1
1
907
1
1
1
1
1
1
o3
49
46
78
49
27
38
44
37
8.9
9.4
18
67
34
38
33
* Pollution data source:
https://openaq.org
(caaqm)
The data is licensed under CC-By 4.0
NO2 15 (Good)
CO 840 (Good)
PM2,5 27 (Moderate)
O3 21 (Good)
SO2 727 (Very bad Hazardous)
PM10 146 (Very Unhealthy)
Data on air pollution from recent days in Mewat
| index | 2022-10-31 |
|---|---|
| no2 | 14 Good |
| co | 805 Good |
| pm25 | 26 Moderate |
| o3 | 20 Good |
| so2 | 727 Very bad Hazardous |
| pm10 | 140 Very Unhealthy |
| index | 2020-05 | 2020-04 | 2020-03 | 2020-02 | 2020-01 | 2019-12 | 2019-11 | 2019-10 | 2019-09 | 2019-08 | 2019-07 | 2019-06 | 2019-05 | 2019-04 | 2019-02 |
|---|---|---|---|---|---|---|---|---|---|---|---|---|---|---|---|
| pm25 | 39 (Unhealthy for Sensitive Groups) | 36 (Unhealthy for Sensitive Groups) | 39 (Unhealthy for Sensitive Groups) | 64 (Unhealthy) | 75 (Very Unhealthy) | 105 (Very Unhealthy) | 98 (Very Unhealthy) | 110 (Very bad Hazardous) | - (Good) | - (Good) | 42 (Unhealthy for Sensitive Groups) | 61 (Unhealthy) | 63 (Unhealthy) | 69 (Unhealthy) | 116 (Very bad Hazardous) |
| pm10 | 87 (Unhealthy) | 96 (Unhealthy) | 91 (Unhealthy) | 138 (Very Unhealthy) | 134 (Very Unhealthy) | 125 (Very Unhealthy) | 146 (Very Unhealthy) | 133 (Very Unhealthy) | 63 (Unhealthy for Sensitive Groups) | 41 (Moderate) | 79 (Unhealthy for Sensitive Groups) | 133 (Very Unhealthy) | 164 (Very bad Hazardous) | 194 (Very bad Hazardous) | 171 (Very bad Hazardous) |
| no2 | 27 (Good) | 27 (Good) | 17 (Good) | 5.9 (Good) | 17 (Good) | 14 (Good) | 13 (Good) | 21 (Good) | 10 (Good) | 12 (Good) | 12 (Good) | 19 (Good) | 17 (Good) | 12 (Good) | 32 (Good) |
| so2 | 21 (Good) | 20 (Good) | 35 (Good) | 10 (Good) | 9.7 (Good) | 14 (Good) | 15 (Good) | 7 (Good) | 7.1 (Good) | 8.3 (Good) | 4.9 (Good) | 6 (Good) | 4.1 (Good) | 4.2 (Good) | 8.1 (Good) |
| co | 174 (Good) | 461 (Good) | 1 (Good) | 879 (Good) | 1 (Good) | 805 (Good) | 1 (Good) | 1 (Good) | 907 (Good) | 1 (Good) | 1 (Good) | 1 (Good) | 1 (Good) | 1 (Good) | 1 (Good) |
| o3 | 49 (Good) | 46 (Good) | 78 (Moderate) | 49 (Good) | 27 (Good) | 38 (Good) | 44 (Good) | 37 (Good) | 8.9 (Good) | 9.4 (Good) | 18 (Good) | 67 (Good) | 34 (Good) | 38 (Good) | 33 (Good) |
NO2 15 (Good)
nitrogen dioxide (NO2)CO 840 (Good)
carbon monoxide (CO)PM2,5 27 (Moderate)
particulate matter (PM2.5) dustO3 21 (Good)
ozone (O3)SO2 727 (Very bad Hazardous)
sulfur dioxide (SO2)PM10 146 (Very Unhealthy)
particulate matter (PM10) suspended dustGeneral Hospital, Mandikhera - HSPCB
| index | 2022-10-31 |
|---|---|
| no2 | 14 |
| co | 805 |
| pm25 | 26 |
| o3 | 20 |
| so2 | 727 |
| pm10 | 140 |
General Hospital, Mandikhera - HSPCB
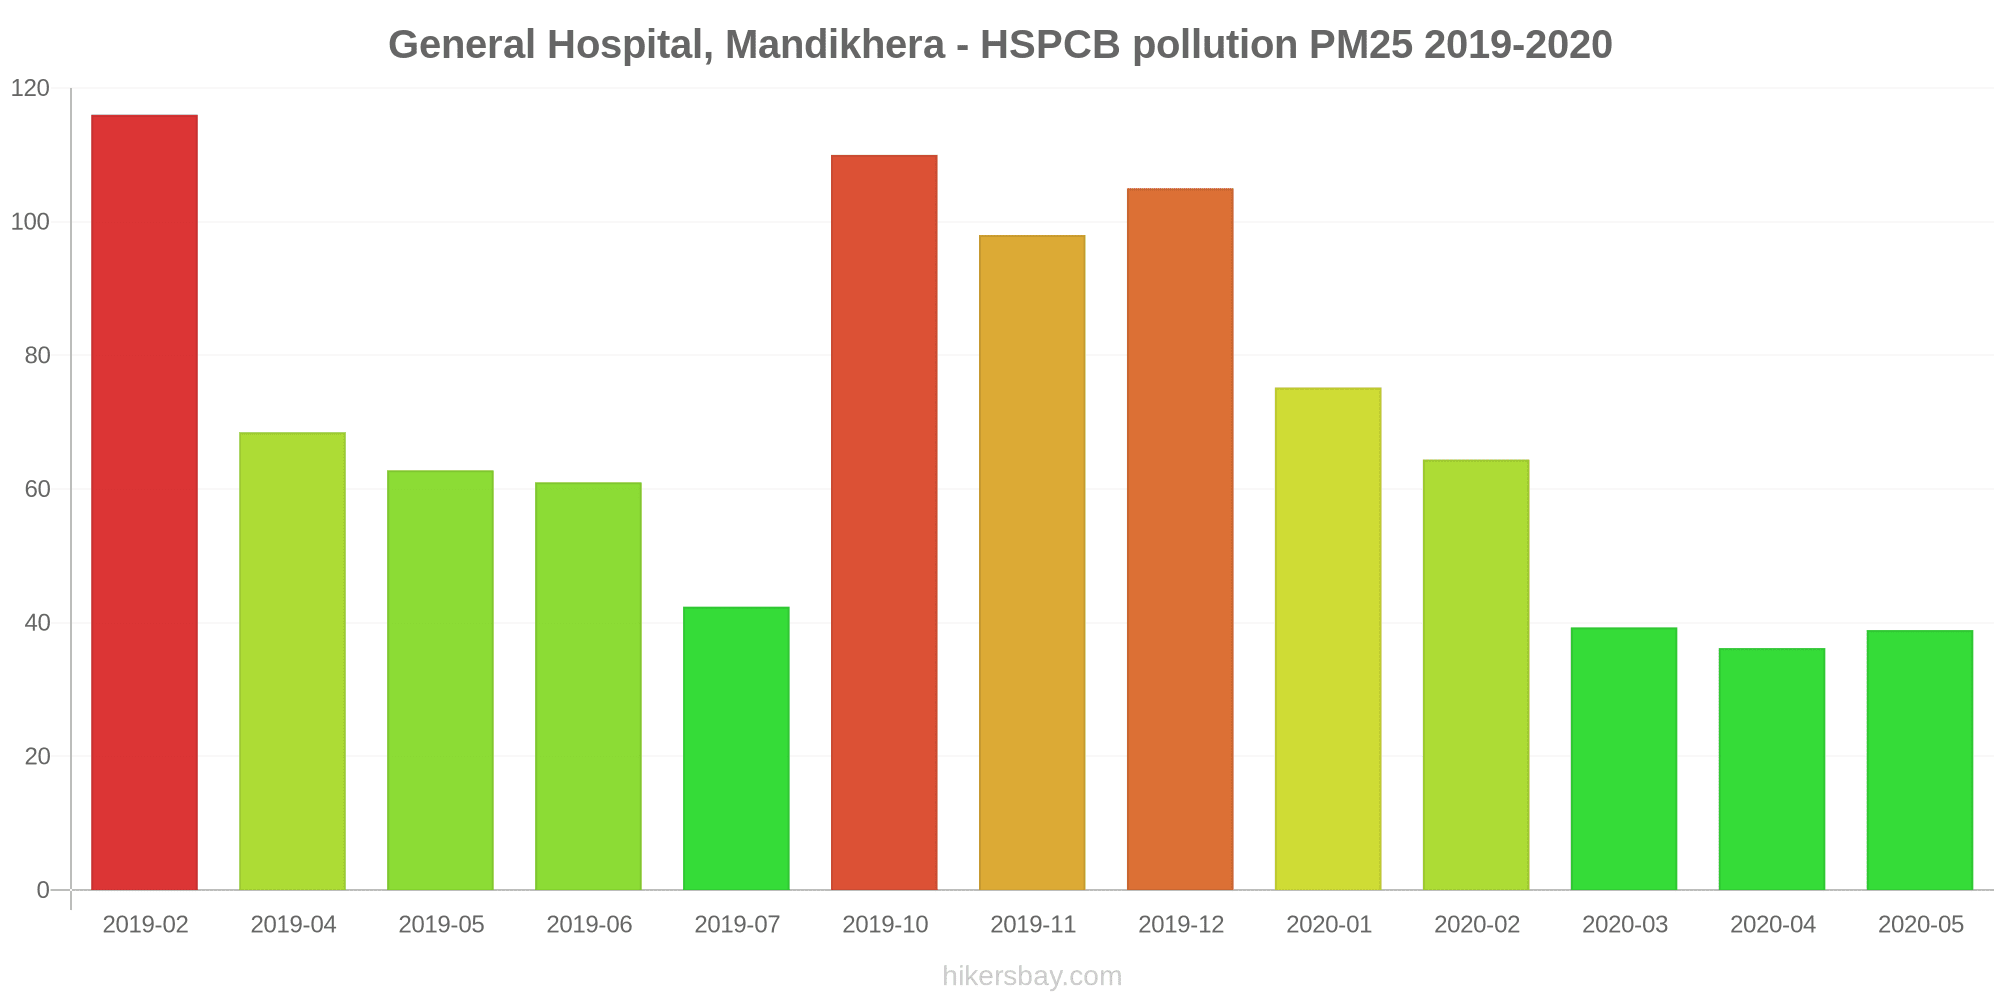
| index | 2020-05 | 2020-04 | 2020-03 | 2020-02 | 2020-01 | 2019-12 | 2019-11 | 2019-10 | 2019-09 | 2019-08 | 2019-07 | 2019-06 | 2019-05 | 2019-04 | 2019-02 |
|---|---|---|---|---|---|---|---|---|---|---|---|---|---|---|---|
| pm25 | 39 | 36 | 39 | 64 | 75 | 105 | 98 | 110 | - | - | 42 | 61 | 63 | 69 | 116 |
| pm10 | 87 | 96 | 91 | 138 | 134 | 125 | 146 | 133 | 63 | 41 | 79 | 133 | 164 | 194 | 171 |
| no2 | 27 | 27 | 17 | 5.9 | 17 | 14 | 13 | 21 | 10 | 12 | 12 | 19 | 17 | 12 | 32 |
| so2 | 21 | 20 | 35 | 10 | 9.7 | 14 | 15 | 7 | 7.1 | 8.3 | 4.9 | 6 | 4.1 | 4.2 | 8.1 |
| co | 174 | 461 | 1 | 879 | 1 | 805 | 1 | 1 | 907 | 1 | 1 | 1 | 1 | 1 | 1 |
| o3 | 49 | 46 | 78 | 49 | 27 | 38 | 44 | 37 | 8.9 | 9.4 | 18 | 67 | 34 | 38 | 33 |