Air Pollution in Fatehabad: Real-time Air Quality Index and smog alert.
Pollution and air quality forecast for Fatehabad. Today is Wednesday, May 13, 2026. The following air pollution values have been recorded for Fatehabad:- sulfur dioxide (SO2) - 8 (Good)
- particulate matter (PM2.5) dust - 86 (Very Unhealthy)
- nitrogen dioxide (NO2) - 22 (Good)
- particulate matter (PM10) suspended dust - 180 (Very bad Hazardous)
- carbon monoxide (CO) - 510 (Good)
- ozone (O3) - 80 (Moderate)

What is the air quality in Fatehabad today? Is the air polluted in Fatehabad?. Is there smog?
What is the level of SO2 pollution? (sulfur dioxide (SO2))
8 (Good)
What is the current level of PM2.5 in Fatehabad? (particulate matter (PM2.5) dust)
Today's PM2.5 level is:
86 (Very Unhealthy)
For comparison, the highest level of PM2.5 in Fatehabad in the last 7 days was: 81 (Friday, October 14, 2022) and the lowest: 18 (Tuesday, October 11, 2022).
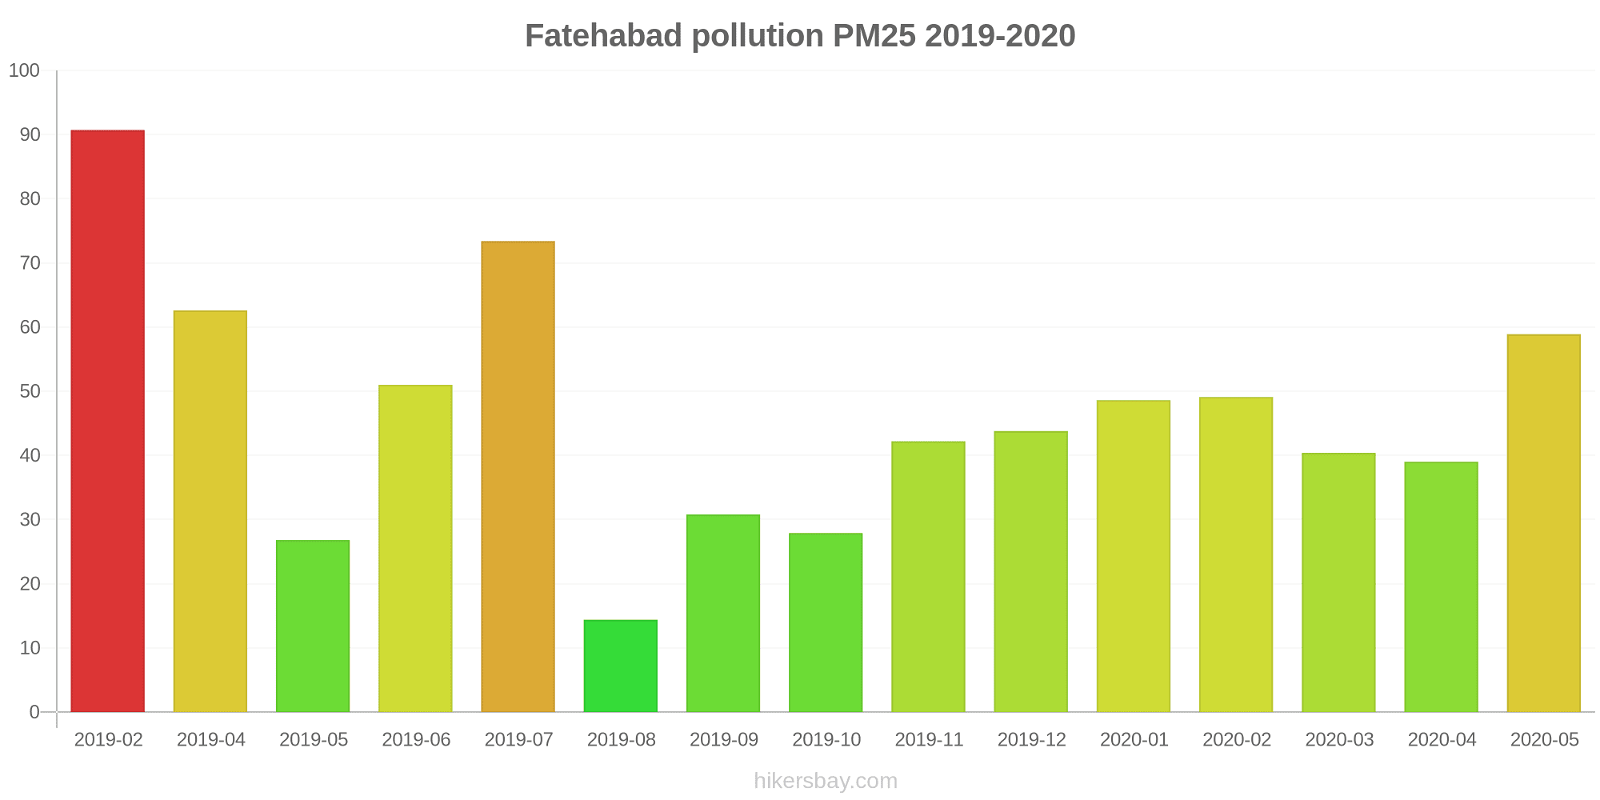
The highest PM2.5 values were recorded: 91 (February 2019).
The lowest level of particulate matter PM2.5 pollution occurs in month: August (14).
How high is the level of NO2? (nitrogen dioxide (NO2))
22 (Good)
What is the level of PM10 today in Fatehabad? (particulate matter (PM10) suspended dust)
The current level of particulate matter PM10 in Fatehabad is:
180 (Very bad Hazardous)
The highest PM10 values usually occur in month: 374 (April 2019).
The lowest value of particulate matter PM10 pollution in Fatehabad is usually recorded in: August (57).
How high is the CO level? (carbon monoxide (CO))
510 (Good)
How is the O3 level today in Fatehabad? (ozone (O3))
80 (Moderate)
Current data Friday, October 14, 2022, 5:45 AM
SO2 8 (Good)
PM2,5 86 (Very Unhealthy)
NO2 22 (Good)
PM10 180 (Very bad Hazardous)
CO 510 (Good)
O3 80 (Moderate)
Data on air pollution from recent days in Fatehabad
index
2022-10-07
2022-10-08
2022-10-09
2022-10-10
2022-10-11
2022-10-12
2022-10-13
2022-10-14
no2
24
Good
25
Good
23
Good
24
Good
25
Good
24
Good
24
Good
23
Good
o3
24
Good
20
Good
16
Good
17
Good
26
Good
42
Good
54
Good
40
Good
co
542
Good
405
Good
335
Good
392
Good
426
Good
383
Good
442
Good
472
Good
pm10
66
Unhealthy for Sensitive Groups
57
Unhealthy for Sensitive Groups
57
Unhealthy for Sensitive Groups
42
Moderate
38
Moderate
80
Unhealthy
129
Very Unhealthy
170
Very bad Hazardous
so2
9
Good
7
Good
16
Good
8
Good
110
Unhealthy for Sensitive Groups
9
Good
9
Good
9
Good
pm25
30
Moderate
27
Moderate
27
Moderate
20
Moderate
18
Moderate
38
Unhealthy for Sensitive Groups
61
Unhealthy
81
Very Unhealthy
data source »
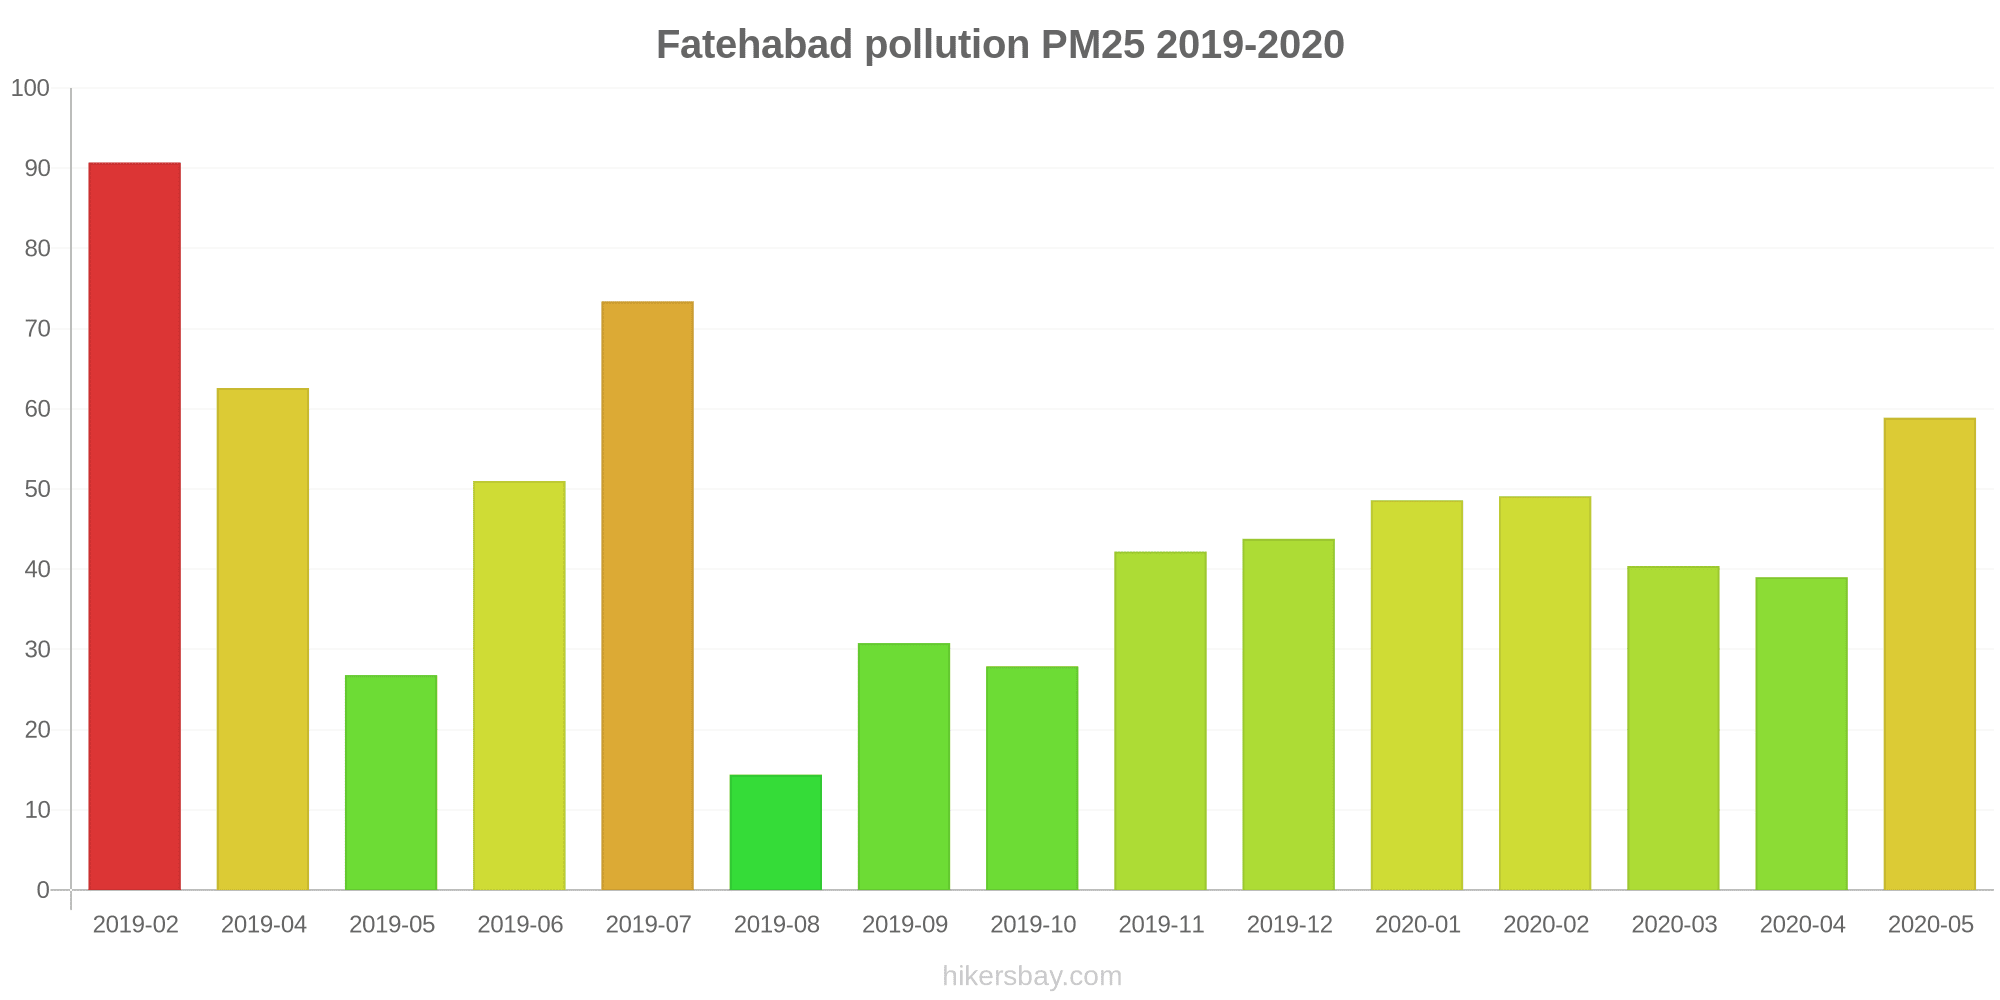
Air pollution in Fatehabad from February 2019 to May 2020
index
2020-05
2020-04
2020-03
2020-02
2020-01
2019-12
2019-11
2019-10
2019-09
2019-08
2019-07
2019-06
2019-05
2019-04
2019-02
pm25
59 (Unhealthy)
39 (Unhealthy for Sensitive Groups)
40 (Unhealthy for Sensitive Groups)
49 (Unhealthy for Sensitive Groups)
49 (Unhealthy for Sensitive Groups)
44 (Unhealthy for Sensitive Groups)
42 (Unhealthy for Sensitive Groups)
28 (Moderate)
31 (Moderate)
14 (Moderate)
73 (Unhealthy)
51 (Unhealthy for Sensitive Groups)
27 (Moderate)
63 (Unhealthy)
91 (Very Unhealthy)
pm10
135 (Very Unhealthy)
96 (Unhealthy)
67 (Unhealthy for Sensitive Groups)
113 (Very Unhealthy)
106 (Unhealthy)
156 (Very bad Hazardous)
227 (Very bad Hazardous)
158 (Very bad Hazardous)
73 (Unhealthy for Sensitive Groups)
57 (Unhealthy for Sensitive Groups)
219 (Very bad Hazardous)
227 (Very bad Hazardous)
219 (Very bad Hazardous)
374 (Very bad Hazardous)
206 (Very bad Hazardous)
no2
16 (Good)
8.1 (Good)
8.1 (Good)
14 (Good)
17 (Good)
26 (Good)
22 (Good)
19 (Good)
9.9 (Good)
13 (Good)
9 (Good)
17 (Good)
20 (Good)
19 (Good)
18 (Good)
so2
18 (Good)
12 (Good)
11 (Good)
11 (Good)
7.3 (Good)
8.3 (Good)
12 (Good)
17 (Good)
12 (Good)
18 (Good)
14 (Good)
8.1 (Good)
53 (Moderate)
13 (Good)
24 (Good)
co
411 (Good)
283 (Good)
341 (Good)
669 (Good)
618 (Good)
810 (Good)
1 (Good)
783 (Good)
427 (Good)
366 (Good)
296 (Good)
351 (Good)
- (Good)
321 (Good)
786 (Good)
o3
131 (Unhealthy for Sensitive Groups)
64 (Good)
37 (Good)
23 (Good)
18 (Good)
34 (Good)
45 (Good)
62 (Good)
39 (Good)
16 (Good)
33 (Good)
39 (Good)
73 (Moderate)
87 (Moderate)
70 (Moderate)
data source »
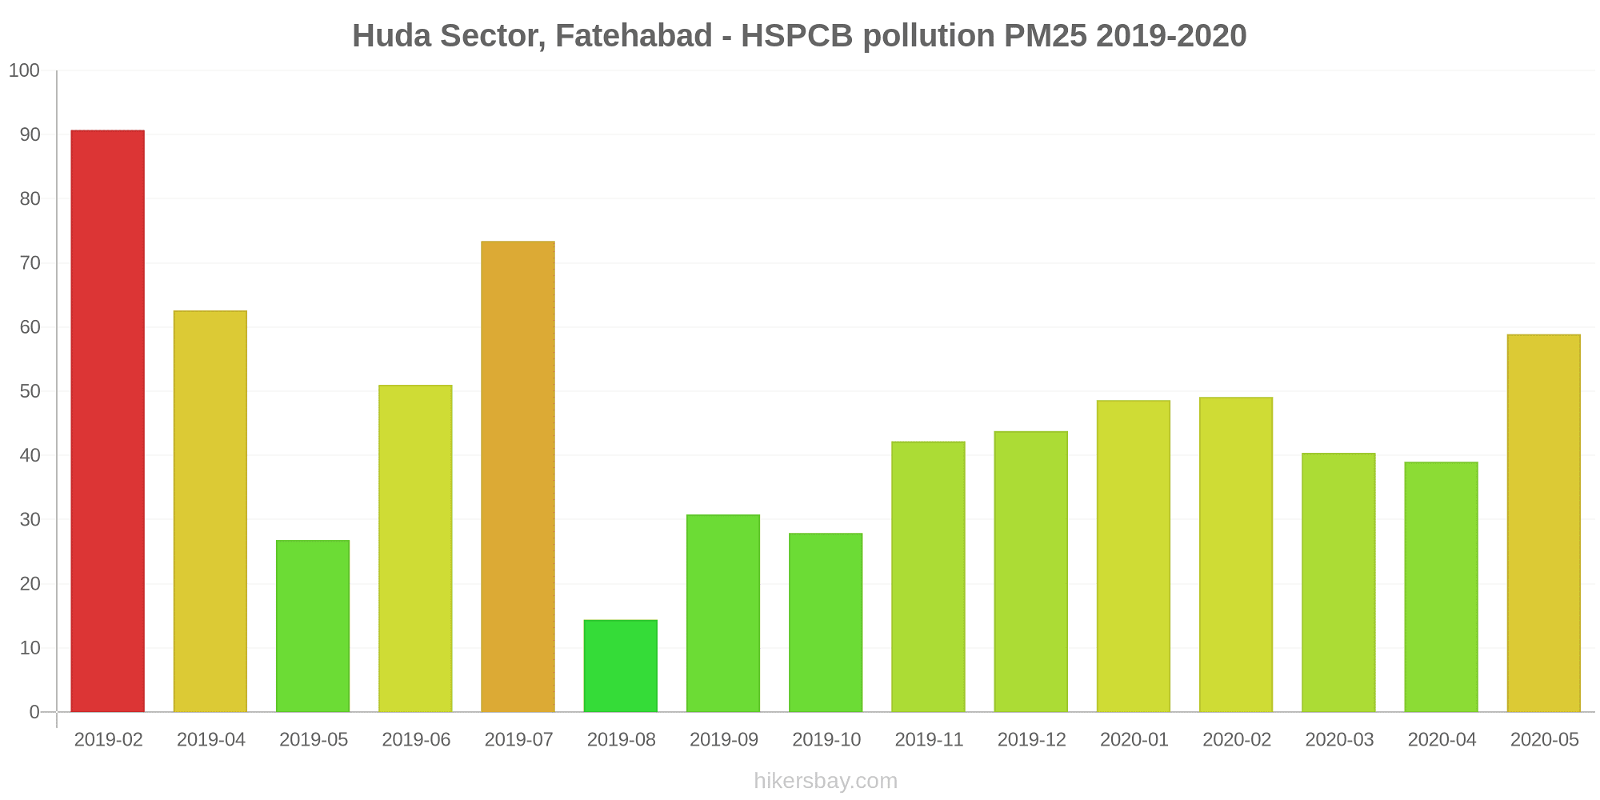
Huda Sector, Fatehabad - HSPCB
Friday, October 14, 2022, 5:45 AM
SO2 8.3 (Good)
sulfur dioxide (SO2)
PM2,5 86 (Very Unhealthy)
particulate matter (PM2.5) dust
NO2 22 (Good)
nitrogen dioxide (NO2)
PM10 180 (Very bad Hazardous)
particulate matter (PM10) suspended dust
CO 510 (Good)
carbon monoxide (CO)
O3 80 (Moderate)
ozone (O3)
Huda Sector, Fatehabad - HSPCB
index
2022-10-14
2022-10-13
2022-10-12
2022-10-11
2022-10-10
2022-10-09
2022-10-08
2022-10-07
no2
23
24
24
25
24
23
25
24
o3
40
54
42
26
17
16
20
24
co
472
442
383
426
392
335
405
542
pm10
170
129
80
38
42
57
57
66
so2
9.1
8.7
8.5
110
8
16
7
8.6
pm25
81
61
38
18
20
27
27
30
Huda Sector, Fatehabad - HSPCB
2019-02 2020-05
index
2020-05
2020-04
2020-03
2020-02
2020-01
2019-12
2019-11
2019-10
2019-09
2019-08
2019-07
2019-06
2019-05
2019-04
2019-02
pm25
59
39
40
49
49
44
42
28
31
14
73
51
27
63
91
pm10
135
96
67
113
106
156
227
158
73
57
219
227
219
374
206
no2
16
8.1
8.1
14
17
26
22
19
9.9
13
9
17
20
19
18
so2
18
12
11
11
7.3
8.3
12
17
12
18
14
8.1
53
13
24
co
411
283
341
669
618
810
1
783
427
366
296
351
-
321
786
o3
131
64
37
23
18
34
45
62
39
16
33
39
73
87
70
* Pollution data source:
https://openaq.org
(caaqm)
The data is licensed under CC-By 4.0
SO2 8 (Good)
PM2,5 86 (Very Unhealthy)
NO2 22 (Good)
PM10 180 (Very bad Hazardous)
CO 510 (Good)
O3 80 (Moderate)
Data on air pollution from recent days in Fatehabad
| index | 2022-10-07 | 2022-10-08 | 2022-10-09 | 2022-10-10 | 2022-10-11 | 2022-10-12 | 2022-10-13 | 2022-10-14 |
|---|---|---|---|---|---|---|---|---|
| no2 | 24 Good |
25 Good |
23 Good |
24 Good |
25 Good |
24 Good |
24 Good |
23 Good |
| o3 | 24 Good |
20 Good |
16 Good |
17 Good |
26 Good |
42 Good |
54 Good |
40 Good |
| co | 542 Good |
405 Good |
335 Good |
392 Good |
426 Good |
383 Good |
442 Good |
472 Good |
| pm10 | 66 Unhealthy for Sensitive Groups |
57 Unhealthy for Sensitive Groups |
57 Unhealthy for Sensitive Groups |
42 Moderate |
38 Moderate |
80 Unhealthy |
129 Very Unhealthy |
170 Very bad Hazardous |
| so2 | 9 Good |
7 Good |
16 Good |
8 Good |
110 Unhealthy for Sensitive Groups |
9 Good |
9 Good |
9 Good |
| pm25 | 30 Moderate |
27 Moderate |
27 Moderate |
20 Moderate |
18 Moderate |
38 Unhealthy for Sensitive Groups |
61 Unhealthy |
81 Very Unhealthy |
| index | 2020-05 | 2020-04 | 2020-03 | 2020-02 | 2020-01 | 2019-12 | 2019-11 | 2019-10 | 2019-09 | 2019-08 | 2019-07 | 2019-06 | 2019-05 | 2019-04 | 2019-02 |
|---|---|---|---|---|---|---|---|---|---|---|---|---|---|---|---|
| pm25 | 59 (Unhealthy) | 39 (Unhealthy for Sensitive Groups) | 40 (Unhealthy for Sensitive Groups) | 49 (Unhealthy for Sensitive Groups) | 49 (Unhealthy for Sensitive Groups) | 44 (Unhealthy for Sensitive Groups) | 42 (Unhealthy for Sensitive Groups) | 28 (Moderate) | 31 (Moderate) | 14 (Moderate) | 73 (Unhealthy) | 51 (Unhealthy for Sensitive Groups) | 27 (Moderate) | 63 (Unhealthy) | 91 (Very Unhealthy) |
| pm10 | 135 (Very Unhealthy) | 96 (Unhealthy) | 67 (Unhealthy for Sensitive Groups) | 113 (Very Unhealthy) | 106 (Unhealthy) | 156 (Very bad Hazardous) | 227 (Very bad Hazardous) | 158 (Very bad Hazardous) | 73 (Unhealthy for Sensitive Groups) | 57 (Unhealthy for Sensitive Groups) | 219 (Very bad Hazardous) | 227 (Very bad Hazardous) | 219 (Very bad Hazardous) | 374 (Very bad Hazardous) | 206 (Very bad Hazardous) |
| no2 | 16 (Good) | 8.1 (Good) | 8.1 (Good) | 14 (Good) | 17 (Good) | 26 (Good) | 22 (Good) | 19 (Good) | 9.9 (Good) | 13 (Good) | 9 (Good) | 17 (Good) | 20 (Good) | 19 (Good) | 18 (Good) |
| so2 | 18 (Good) | 12 (Good) | 11 (Good) | 11 (Good) | 7.3 (Good) | 8.3 (Good) | 12 (Good) | 17 (Good) | 12 (Good) | 18 (Good) | 14 (Good) | 8.1 (Good) | 53 (Moderate) | 13 (Good) | 24 (Good) |
| co | 411 (Good) | 283 (Good) | 341 (Good) | 669 (Good) | 618 (Good) | 810 (Good) | 1 (Good) | 783 (Good) | 427 (Good) | 366 (Good) | 296 (Good) | 351 (Good) | - (Good) | 321 (Good) | 786 (Good) |
| o3 | 131 (Unhealthy for Sensitive Groups) | 64 (Good) | 37 (Good) | 23 (Good) | 18 (Good) | 34 (Good) | 45 (Good) | 62 (Good) | 39 (Good) | 16 (Good) | 33 (Good) | 39 (Good) | 73 (Moderate) | 87 (Moderate) | 70 (Moderate) |
SO2 8.3 (Good)
sulfur dioxide (SO2)PM2,5 86 (Very Unhealthy)
particulate matter (PM2.5) dustNO2 22 (Good)
nitrogen dioxide (NO2)PM10 180 (Very bad Hazardous)
particulate matter (PM10) suspended dustCO 510 (Good)
carbon monoxide (CO)O3 80 (Moderate)
ozone (O3)Huda Sector, Fatehabad - HSPCB
| index | 2022-10-14 | 2022-10-13 | 2022-10-12 | 2022-10-11 | 2022-10-10 | 2022-10-09 | 2022-10-08 | 2022-10-07 |
|---|---|---|---|---|---|---|---|---|
| no2 | 23 | 24 | 24 | 25 | 24 | 23 | 25 | 24 |
| o3 | 40 | 54 | 42 | 26 | 17 | 16 | 20 | 24 |
| co | 472 | 442 | 383 | 426 | 392 | 335 | 405 | 542 |
| pm10 | 170 | 129 | 80 | 38 | 42 | 57 | 57 | 66 |
| so2 | 9.1 | 8.7 | 8.5 | 110 | 8 | 16 | 7 | 8.6 |
| pm25 | 81 | 61 | 38 | 18 | 20 | 27 | 27 | 30 |
Huda Sector, Fatehabad - HSPCB

| index | 2020-05 | 2020-04 | 2020-03 | 2020-02 | 2020-01 | 2019-12 | 2019-11 | 2019-10 | 2019-09 | 2019-08 | 2019-07 | 2019-06 | 2019-05 | 2019-04 | 2019-02 |
|---|---|---|---|---|---|---|---|---|---|---|---|---|---|---|---|
| pm25 | 59 | 39 | 40 | 49 | 49 | 44 | 42 | 28 | 31 | 14 | 73 | 51 | 27 | 63 | 91 |
| pm10 | 135 | 96 | 67 | 113 | 106 | 156 | 227 | 158 | 73 | 57 | 219 | 227 | 219 | 374 | 206 |
| no2 | 16 | 8.1 | 8.1 | 14 | 17 | 26 | 22 | 19 | 9.9 | 13 | 9 | 17 | 20 | 19 | 18 |
| so2 | 18 | 12 | 11 | 11 | 7.3 | 8.3 | 12 | 17 | 12 | 18 | 14 | 8.1 | 53 | 13 | 24 |
| co | 411 | 283 | 341 | 669 | 618 | 810 | 1 | 783 | 427 | 366 | 296 | 351 | - | 321 | 786 |
| o3 | 131 | 64 | 37 | 23 | 18 | 34 | 45 | 62 | 39 | 16 | 33 | 39 | 73 | 87 | 70 |