Air Pollution in Daxini Society: Real-time Air Quality Index and smog alert.
Pollution and air quality forecast for Daxini Society. Today is Wednesday, May 13, 2026. The following air pollution values have been recorded for Daxini Society:- nitrogen dioxide (NO2) - 74 (Moderate)
- carbon monoxide (CO) - 180 (Good)
- particulate matter (PM2.5) dust - 44 (Unhealthy for Sensitive Groups)
- ozone (O3) - 1 (Good)
- sulfur dioxide (SO2) - 109 (Unhealthy for Sensitive Groups)
- particulate matter (PM10) suspended dust - 180 (Very bad Hazardous)

What is the air quality in Daxini Society today? Is the air polluted in Daxini Society?. Is there smog?
How high is the level of NO2? (nitrogen dioxide (NO2))
74 (Moderate)
How high is the CO level? (carbon monoxide (CO))
180 (Good)
What is the current level of PM2.5 in Daxini Society? (particulate matter (PM2.5) dust)
Today's PM2.5 level is:
44 (Unhealthy for Sensitive Groups)
For comparison, the highest level of PM2.5 in Daxini Society in the last 7 days was: 44 (Monday, October 31, 2022) and the lowest: 44 (Monday, October 31, 2022).
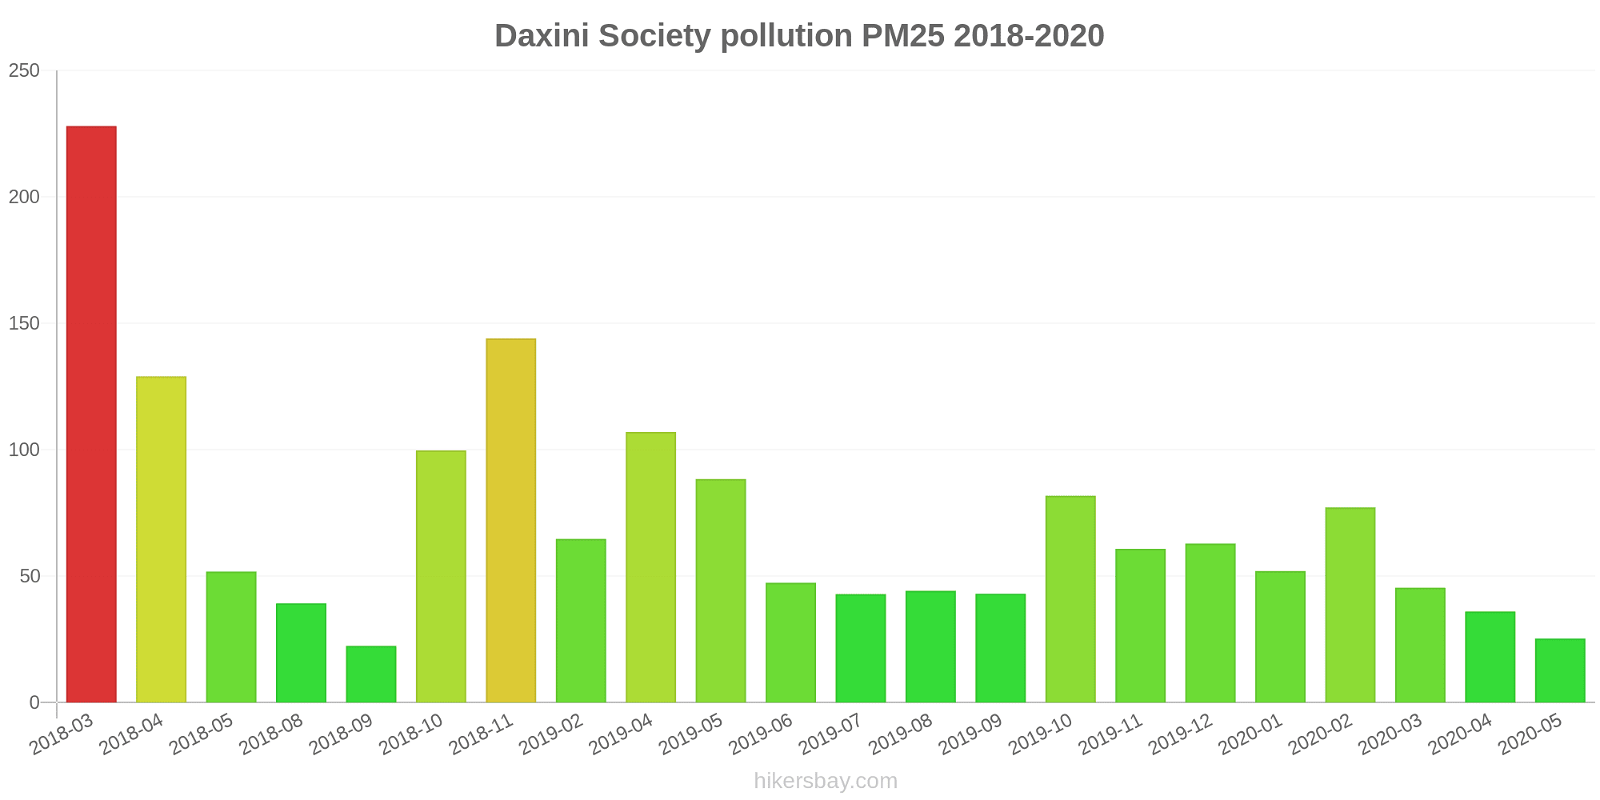
The highest PM2.5 values were recorded: 228 (March 2018).
The lowest level of particulate matter PM2.5 pollution occurs in month: September (22).
How is the O3 level today in Daxini Society? (ozone (O3))
1 (Good)
What is the level of SO2 pollution? (sulfur dioxide (SO2))
109 (Unhealthy for Sensitive Groups)
What is the level of PM10 today in Daxini Society? (particulate matter (PM10) suspended dust)
The current level of particulate matter PM10 in Daxini Society is:
180 (Very bad Hazardous)
The highest PM10 values usually occur in month: 147 (October 2019).
The lowest value of particulate matter PM10 pollution in Daxini Society is usually recorded in: May (72).
Current data Monday, October 31, 2022, 1:45 AM
NO2 74 (Moderate)
CO 180 (Good)
PM2,5 44 (Unhealthy for Sensitive Groups)
O3 1 (Good)
SO2 109 (Unhealthy for Sensitive Groups)
PM10 180 (Very bad Hazardous)
Data on air pollution from recent days in Daxini Society
index
2022-10-31
no2
89
Moderate
co
180
Good
pm25
44
Unhealthy for Sensitive Groups
o3
1
Good
so2
110
Unhealthy for Sensitive Groups
pm10
90
Unhealthy
data source »
Air pollution in Daxini Society from March 2018 to May 2020
index
2020-05
2020-04
2020-03
2020-02
2020-01
2019-12
2019-11
2019-10
2019-09
2019-08
2019-07
2019-06
2019-05
2019-04
2019-02
2018-11
2018-10
2018-09
2018-08
2018-05
2018-04
2018-03
pm25
25 (Moderate)
36 (Unhealthy for Sensitive Groups)
45 (Unhealthy for Sensitive Groups)
77 (Very Unhealthy)
52 (Unhealthy for Sensitive Groups)
63 (Unhealthy)
61 (Unhealthy)
82 (Very Unhealthy)
43 (Unhealthy for Sensitive Groups)
44 (Unhealthy for Sensitive Groups)
43 (Unhealthy for Sensitive Groups)
47 (Unhealthy for Sensitive Groups)
88 (Very Unhealthy)
107 (Very Unhealthy)
65 (Unhealthy)
144 (Very bad Hazardous)
100 (Very Unhealthy)
22 (Moderate)
39 (Unhealthy for Sensitive Groups)
52 (Unhealthy for Sensitive Groups)
129 (Very bad Hazardous)
228 (Very bad Hazardous)
pm10
72 (Unhealthy for Sensitive Groups)
81 (Unhealthy)
105 (Unhealthy)
144 (Very Unhealthy)
114 (Very Unhealthy)
108 (Unhealthy)
110 (Very Unhealthy)
147 (Very Unhealthy)
107 (Unhealthy)
133 (Very Unhealthy)
- (Good)
- (Good)
- (Good)
- (Good)
- (Good)
- (Good)
- (Good)
- (Good)
- (Good)
- (Good)
- (Good)
- (Good)
no2
17 (Good)
23 (Good)
33 (Good)
62 (Moderate)
19 (Good)
38 (Good)
142 (Unhealthy for Sensitive Groups)
149 (Unhealthy for Sensitive Groups)
86 (Moderate)
46 (Moderate)
112 (Unhealthy for Sensitive Groups)
170 (Unhealthy)
69 (Moderate)
49 (Moderate)
69 (Moderate)
92 (Moderate)
102 (Unhealthy for Sensitive Groups)
82 (Moderate)
58 (Moderate)
30 (Good)
65 (Moderate)
133 (Unhealthy for Sensitive Groups)
co
611 (Good)
419 (Good)
558 (Good)
887 (Good)
784 (Good)
655 (Good)
1 (Good)
1 (Good)
2 (Good)
1 (Good)
1 (Good)
1 (Good)
829 (Good)
905 (Good)
630 (Good)
1 (Good)
1 (Good)
412 (Good)
485 (Good)
1 (Good)
28 (Good)
66 (Good)
o3
53 (Good)
47 (Good)
43 (Good)
49 (Good)
25 (Good)
29 (Good)
25 (Good)
84 (Moderate)
45 (Good)
43 (Good)
52 (Good)
71 (Moderate)
- (Good)
43 (Good)
45 (Good)
42 (Good)
37 (Good)
20 (Good)
9.2 (Good)
21 (Good)
39 (Good)
34 (Good)
so2
14 (Good)
21 (Good)
47 (Good)
68 (Moderate)
51 (Moderate)
54 (Moderate)
199 (Unhealthy for Sensitive Groups)
194 (Unhealthy for Sensitive Groups)
87 (Moderate)
43 (Good)
101 (Unhealthy for Sensitive Groups)
30 (Good)
250 (Unhealthy)
65 (Moderate)
60 (Moderate)
77 (Moderate)
133 (Unhealthy for Sensitive Groups)
64 (Moderate)
102 (Unhealthy for Sensitive Groups)
105 (Unhealthy for Sensitive Groups)
90 (Moderate)
88 (Moderate)
data source »
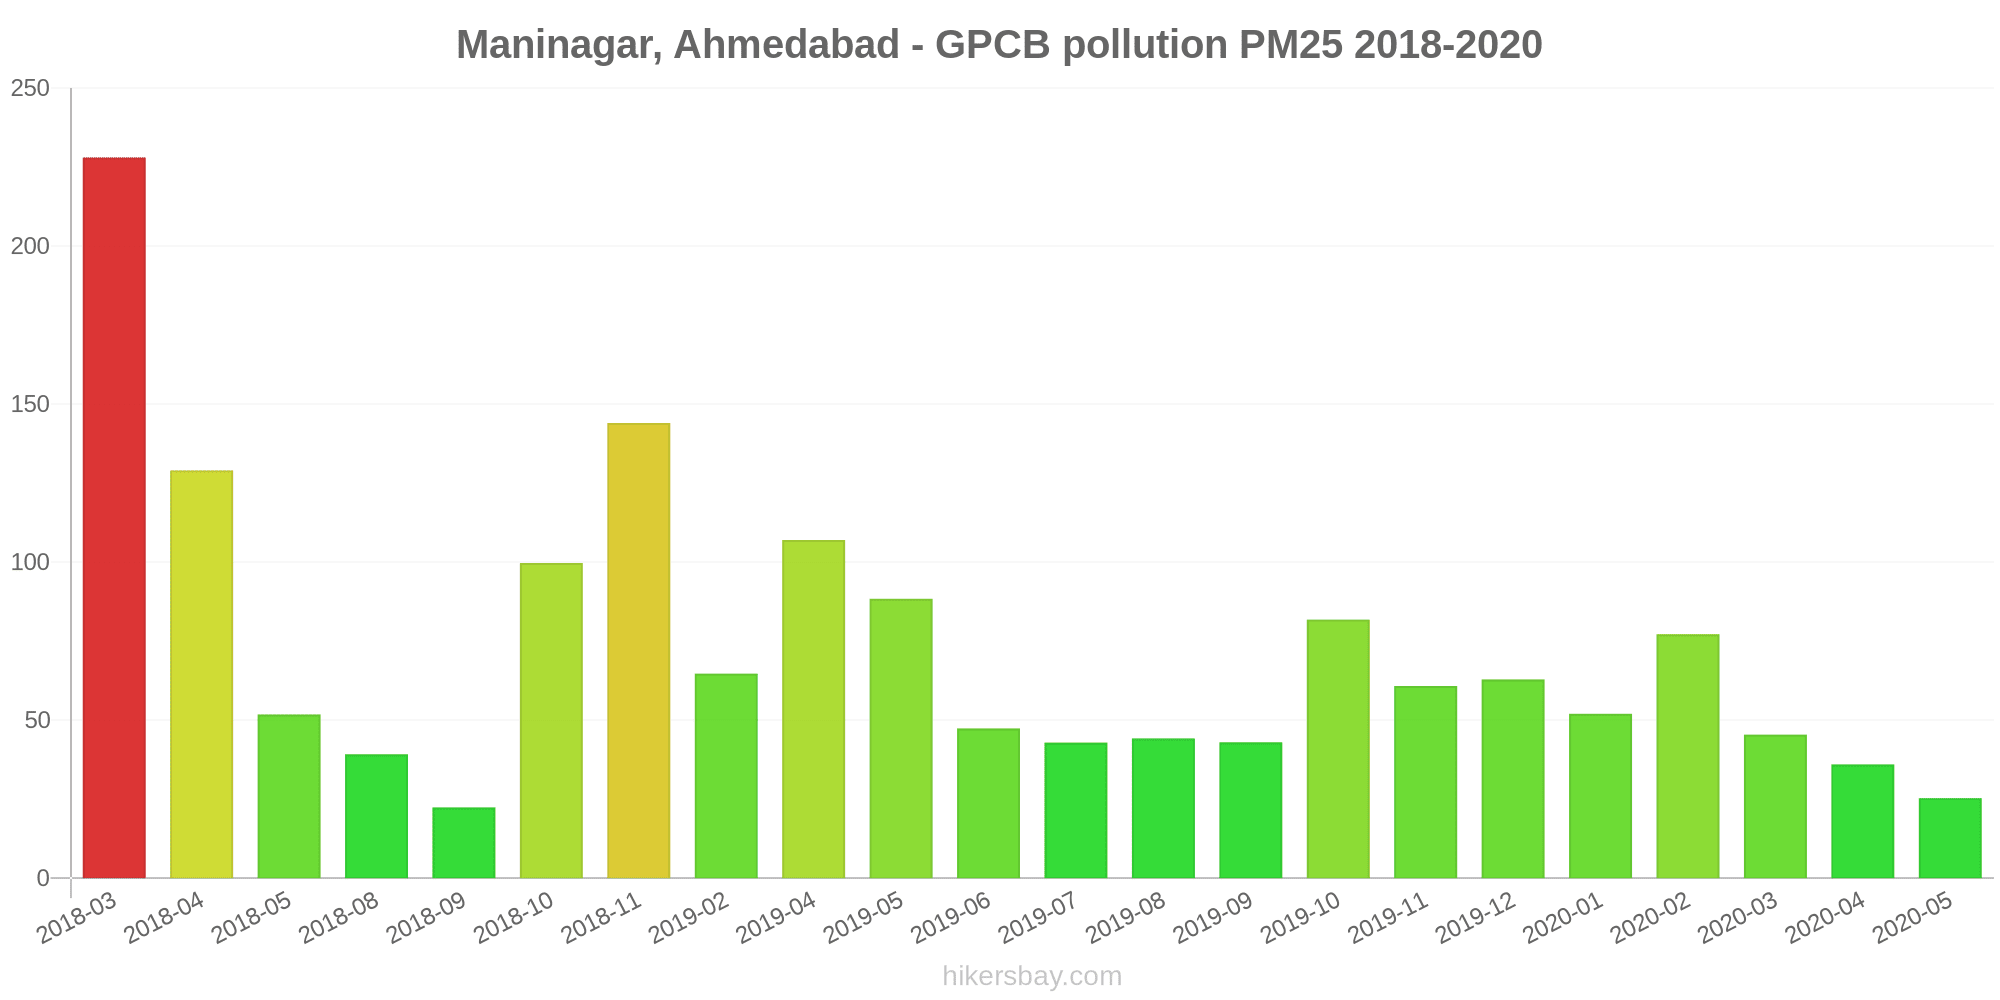
Maninagar, Ahmedabad - GPCB
Monday, October 31, 2022, 1:45 AM
NO2 74 (Moderate)
nitrogen dioxide (NO2)
CO 180 (Good)
carbon monoxide (CO)
PM2,5 44 (Unhealthy for Sensitive Groups)
particulate matter (PM2.5) dust
O3 0.64 (Good)
ozone (O3)
SO2 109 (Unhealthy for Sensitive Groups)
sulfur dioxide (SO2)
PM10 180 (Very bad Hazardous)
particulate matter (PM10) suspended dust
Maninagar, Ahmedabad - GPCB
index
2022-10-31
no2
89
co
180
pm25
44
o3
0.6
so2
110
pm10
90
Maninagar, Ahmedabad - GPCB
2018-03 2020-05

index
2020-05
2020-04
2020-03
2020-02
2020-01
2019-12
2019-11
2019-10
2019-09
2019-08
2019-07
2019-06
2019-05
2019-04
2019-02
2018-11
2018-10
2018-09
2018-08
2018-05
2018-04
2018-03
pm25
25
36
45
77
52
63
61
82
43
44
43
47
88
107
65
144
100
22
39
52
129
228
no2
17
23
33
62
19
38
142
149
86
46
112
170
69
49
69
92
102
82
58
30
65
133
co
611
419
558
887
784
655
1
1
2
1
1
1
829
905
630
1
1
412
485
1
28
66
o3
53
47
43
49
25
29
25
84
45
43
52
71
-
43
45
42
37
20
9.2
21
39
34
so2
14
21
47
68
51
54
199
194
87
43
101
30
250
65
60
77
133
64
102
105
90
88
pm10
72
81
105
144
114
108
110
147
107
133
-
-
-
-
-
-
-
-
-
-
-
-
* Pollution data source:
https://openaq.org
(caaqm)
The data is licensed under CC-By 4.0
NO2 74 (Moderate)
CO 180 (Good)
PM2,5 44 (Unhealthy for Sensitive Groups)
O3 1 (Good)
SO2 109 (Unhealthy for Sensitive Groups)
PM10 180 (Very bad Hazardous)
Data on air pollution from recent days in Daxini Society
| index | 2022-10-31 |
|---|---|
| no2 | 89 Moderate |
| co | 180 Good |
| pm25 | 44 Unhealthy for Sensitive Groups |
| o3 | 1 Good |
| so2 | 110 Unhealthy for Sensitive Groups |
| pm10 | 90 Unhealthy |

| index | 2020-05 | 2020-04 | 2020-03 | 2020-02 | 2020-01 | 2019-12 | 2019-11 | 2019-10 | 2019-09 | 2019-08 | 2019-07 | 2019-06 | 2019-05 | 2019-04 | 2019-02 | 2018-11 | 2018-10 | 2018-09 | 2018-08 | 2018-05 | 2018-04 | 2018-03 |
|---|---|---|---|---|---|---|---|---|---|---|---|---|---|---|---|---|---|---|---|---|---|---|
| pm25 | 25 (Moderate) | 36 (Unhealthy for Sensitive Groups) | 45 (Unhealthy for Sensitive Groups) | 77 (Very Unhealthy) | 52 (Unhealthy for Sensitive Groups) | 63 (Unhealthy) | 61 (Unhealthy) | 82 (Very Unhealthy) | 43 (Unhealthy for Sensitive Groups) | 44 (Unhealthy for Sensitive Groups) | 43 (Unhealthy for Sensitive Groups) | 47 (Unhealthy for Sensitive Groups) | 88 (Very Unhealthy) | 107 (Very Unhealthy) | 65 (Unhealthy) | 144 (Very bad Hazardous) | 100 (Very Unhealthy) | 22 (Moderate) | 39 (Unhealthy for Sensitive Groups) | 52 (Unhealthy for Sensitive Groups) | 129 (Very bad Hazardous) | 228 (Very bad Hazardous) |
| pm10 | 72 (Unhealthy for Sensitive Groups) | 81 (Unhealthy) | 105 (Unhealthy) | 144 (Very Unhealthy) | 114 (Very Unhealthy) | 108 (Unhealthy) | 110 (Very Unhealthy) | 147 (Very Unhealthy) | 107 (Unhealthy) | 133 (Very Unhealthy) | - (Good) | - (Good) | - (Good) | - (Good) | - (Good) | - (Good) | - (Good) | - (Good) | - (Good) | - (Good) | - (Good) | - (Good) |
| no2 | 17 (Good) | 23 (Good) | 33 (Good) | 62 (Moderate) | 19 (Good) | 38 (Good) | 142 (Unhealthy for Sensitive Groups) | 149 (Unhealthy for Sensitive Groups) | 86 (Moderate) | 46 (Moderate) | 112 (Unhealthy for Sensitive Groups) | 170 (Unhealthy) | 69 (Moderate) | 49 (Moderate) | 69 (Moderate) | 92 (Moderate) | 102 (Unhealthy for Sensitive Groups) | 82 (Moderate) | 58 (Moderate) | 30 (Good) | 65 (Moderate) | 133 (Unhealthy for Sensitive Groups) |
| co | 611 (Good) | 419 (Good) | 558 (Good) | 887 (Good) | 784 (Good) | 655 (Good) | 1 (Good) | 1 (Good) | 2 (Good) | 1 (Good) | 1 (Good) | 1 (Good) | 829 (Good) | 905 (Good) | 630 (Good) | 1 (Good) | 1 (Good) | 412 (Good) | 485 (Good) | 1 (Good) | 28 (Good) | 66 (Good) |
| o3 | 53 (Good) | 47 (Good) | 43 (Good) | 49 (Good) | 25 (Good) | 29 (Good) | 25 (Good) | 84 (Moderate) | 45 (Good) | 43 (Good) | 52 (Good) | 71 (Moderate) | - (Good) | 43 (Good) | 45 (Good) | 42 (Good) | 37 (Good) | 20 (Good) | 9.2 (Good) | 21 (Good) | 39 (Good) | 34 (Good) |
| so2 | 14 (Good) | 21 (Good) | 47 (Good) | 68 (Moderate) | 51 (Moderate) | 54 (Moderate) | 199 (Unhealthy for Sensitive Groups) | 194 (Unhealthy for Sensitive Groups) | 87 (Moderate) | 43 (Good) | 101 (Unhealthy for Sensitive Groups) | 30 (Good) | 250 (Unhealthy) | 65 (Moderate) | 60 (Moderate) | 77 (Moderate) | 133 (Unhealthy for Sensitive Groups) | 64 (Moderate) | 102 (Unhealthy for Sensitive Groups) | 105 (Unhealthy for Sensitive Groups) | 90 (Moderate) | 88 (Moderate) |
NO2 74 (Moderate)
nitrogen dioxide (NO2)CO 180 (Good)
carbon monoxide (CO)PM2,5 44 (Unhealthy for Sensitive Groups)
particulate matter (PM2.5) dustO3 0.64 (Good)
ozone (O3)SO2 109 (Unhealthy for Sensitive Groups)
sulfur dioxide (SO2)PM10 180 (Very bad Hazardous)
particulate matter (PM10) suspended dustManinagar, Ahmedabad - GPCB
| index | 2022-10-31 |
|---|---|
| no2 | 89 |
| co | 180 |
| pm25 | 44 |
| o3 | 0.6 |
| so2 | 110 |
| pm10 | 90 |
Maninagar, Ahmedabad - GPCB
| index | 2020-05 | 2020-04 | 2020-03 | 2020-02 | 2020-01 | 2019-12 | 2019-11 | 2019-10 | 2019-09 | 2019-08 | 2019-07 | 2019-06 | 2019-05 | 2019-04 | 2019-02 | 2018-11 | 2018-10 | 2018-09 | 2018-08 | 2018-05 | 2018-04 | 2018-03 |
|---|---|---|---|---|---|---|---|---|---|---|---|---|---|---|---|---|---|---|---|---|---|---|
| pm25 | 25 | 36 | 45 | 77 | 52 | 63 | 61 | 82 | 43 | 44 | 43 | 47 | 88 | 107 | 65 | 144 | 100 | 22 | 39 | 52 | 129 | 228 |
| no2 | 17 | 23 | 33 | 62 | 19 | 38 | 142 | 149 | 86 | 46 | 112 | 170 | 69 | 49 | 69 | 92 | 102 | 82 | 58 | 30 | 65 | 133 |
| co | 611 | 419 | 558 | 887 | 784 | 655 | 1 | 1 | 2 | 1 | 1 | 1 | 829 | 905 | 630 | 1 | 1 | 412 | 485 | 1 | 28 | 66 |
| o3 | 53 | 47 | 43 | 49 | 25 | 29 | 25 | 84 | 45 | 43 | 52 | 71 | - | 43 | 45 | 42 | 37 | 20 | 9.2 | 21 | 39 | 34 |
| so2 | 14 | 21 | 47 | 68 | 51 | 54 | 199 | 194 | 87 | 43 | 101 | 30 | 250 | 65 | 60 | 77 | 133 | 64 | 102 | 105 | 90 | 88 |
| pm10 | 72 | 81 | 105 | 144 | 114 | 108 | 110 | 147 | 107 | 133 | - | - | - | - | - | - | - | - | - | - | - | - |