Air Pollution in Nashik: Real-time Air Quality Index and smog alert.
Pollution and air quality forecast for Nashik. Today is Wednesday, May 13, 2026. The following air pollution values have been recorded for Nashik:- particulate matter (PM10) suspended dust - 72 (Unhealthy for Sensitive Groups)
- sulfur dioxide (SO2) - 5 (Good)
- particulate matter (PM2.5) dust - 43 (Unhealthy for Sensitive Groups)
- carbon monoxide (CO) - 790 (Good)
- nitrogen dioxide (NO2) - 6 (Good)
- ozone (O3) - 0 (Good)

What is the air quality in Nashik today? Is the air polluted in Nashik?. Is there smog?
What is the level of PM10 today in Nashik? (particulate matter (PM10) suspended dust)
The current level of particulate matter PM10 in Nashik is:
72 (Unhealthy for Sensitive Groups)
The highest PM10 values usually occur in month: 99 (May 2019).
The lowest value of particulate matter PM10 pollution in Nashik is usually recorded in: September (30).
What is the level of SO2 pollution? (sulfur dioxide (SO2))
5 (Good)
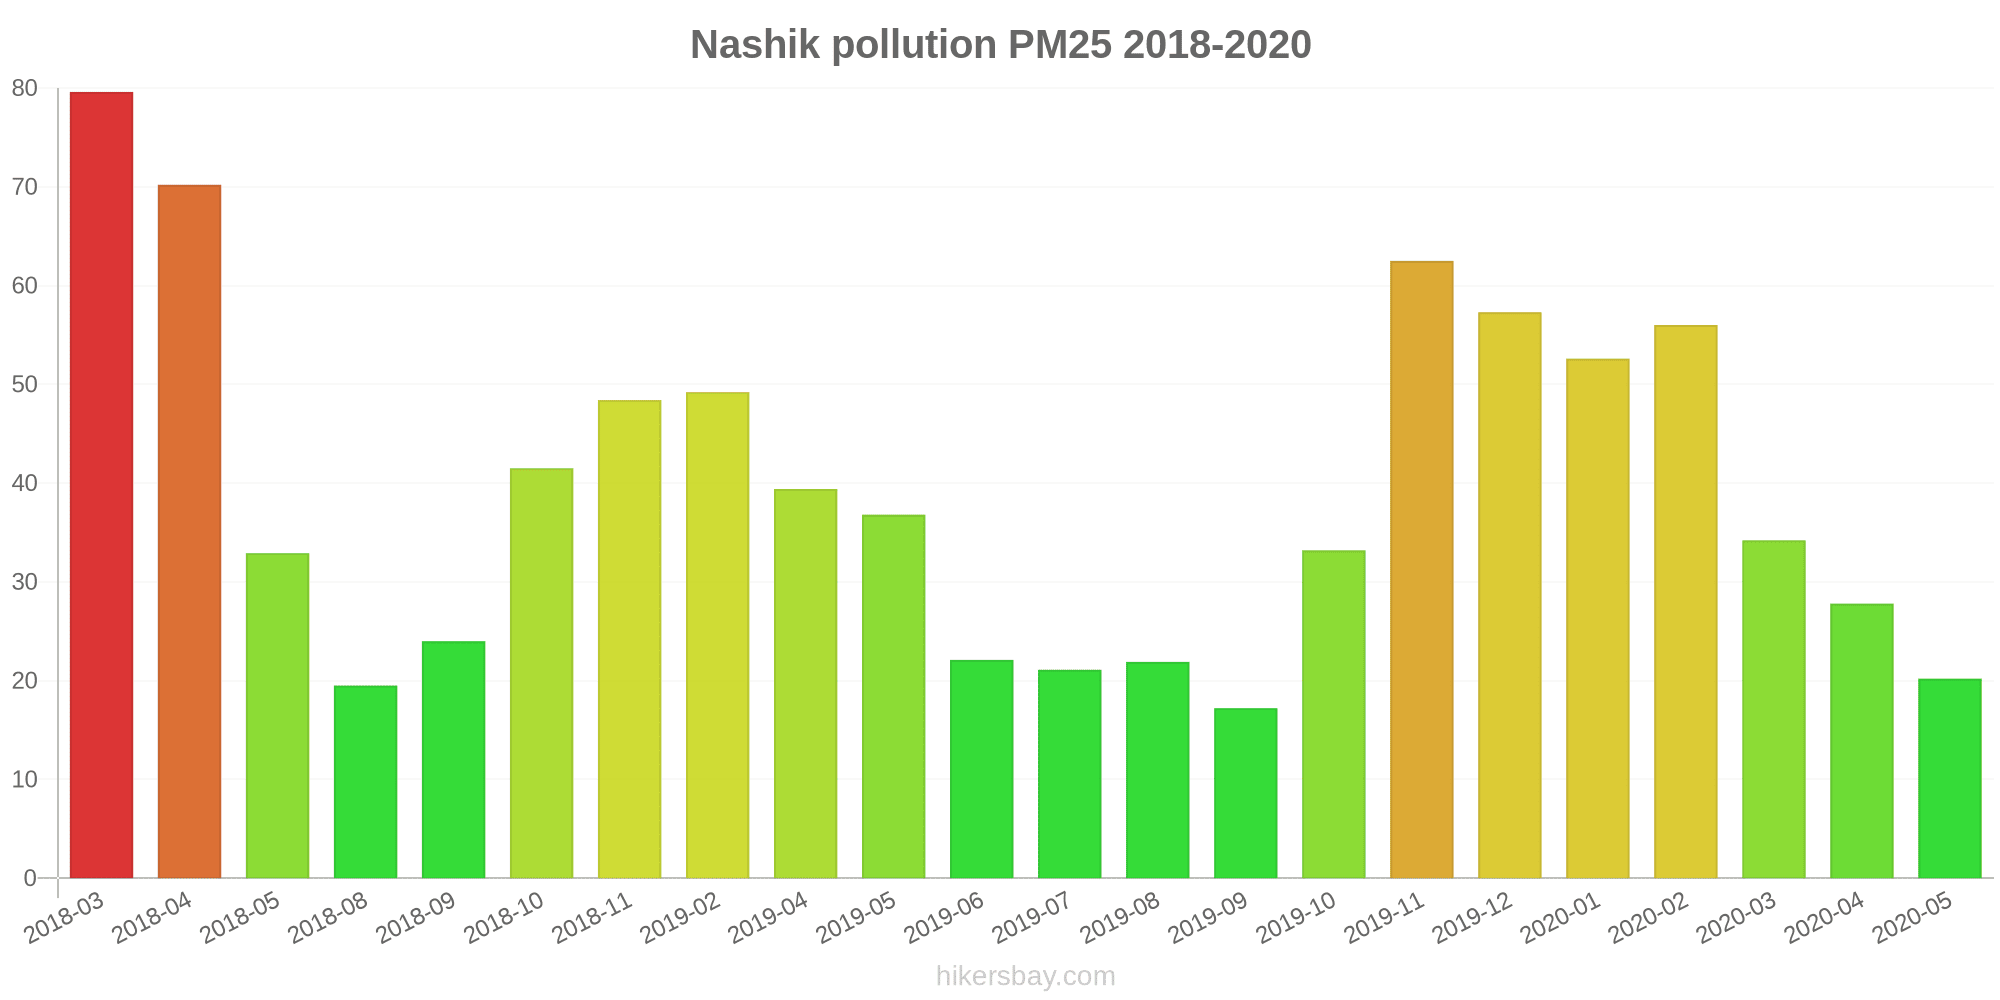
What is the current level of PM2.5 in Nashik? (particulate matter (PM2.5) dust)
Today's PM2.5 level is:
43 (Unhealthy for Sensitive Groups)
For comparison, the highest level of PM2.5 in Nashik in the last 7 days was: 42 (Monday, October 31, 2022) and the lowest: 42 (Monday, October 31, 2022).
The highest PM2.5 values were recorded: 80 (March 2018).
The lowest level of particulate matter PM2.5 pollution occurs in month: September (17).
How high is the CO level? (carbon monoxide (CO))
790 (Good)
How high is the level of NO2? (nitrogen dioxide (NO2))
6 (Good)
How is the O3 level today in Nashik? (ozone (O3))
0 (Good)
Current data Monday, October 31, 2022, 2:00 AM
PM10 72 (Unhealthy for Sensitive Groups)
SO2 5 (Good)
PM2,5 43 (Unhealthy for Sensitive Groups)
CO 790 (Good)
NO2 6 (Good)
O3 0 (Good)
Data on air pollution from recent days in Nashik
index
2022-10-31
pm10
63
Unhealthy for Sensitive Groups
so2
3
Good
pm25
42
Unhealthy for Sensitive Groups
co
780
Good
no2
7
Good
o3
0
Good
data source »
Air pollution in Nashik from March 2018 to May 2020

index
2020-05
2020-04
2020-03
2020-02
2020-01
2019-12
2019-11
2019-10
2019-09
2019-08
2019-07
2019-06
2019-05
2019-04
2019-02
2018-11
2018-10
2018-09
2018-08
2018-05
2018-04
2018-03
pm25
20 (Moderate)
28 (Moderate)
34 (Moderate)
56 (Unhealthy)
53 (Unhealthy for Sensitive Groups)
57 (Unhealthy)
63 (Unhealthy)
33 (Moderate)
17 (Moderate)
22 (Moderate)
21 (Moderate)
22 (Moderate)
37 (Unhealthy for Sensitive Groups)
39 (Unhealthy for Sensitive Groups)
49 (Unhealthy for Sensitive Groups)
48 (Unhealthy for Sensitive Groups)
42 (Unhealthy for Sensitive Groups)
24 (Moderate)
20 (Moderate)
33 (Moderate)
70 (Unhealthy)
80 (Very Unhealthy)
pm10
48 (Moderate)
52 (Unhealthy for Sensitive Groups)
74 (Unhealthy for Sensitive Groups)
88 (Unhealthy)
90 (Unhealthy)
89 (Unhealthy)
97 (Unhealthy)
45 (Moderate)
30 (Moderate)
36 (Moderate)
45 (Moderate)
49 (Moderate)
99 (Unhealthy)
95 (Unhealthy)
74 (Unhealthy for Sensitive Groups)
76 (Unhealthy for Sensitive Groups)
79 (Unhealthy for Sensitive Groups)
45 (Moderate)
38 (Moderate)
66 (Unhealthy for Sensitive Groups)
83 (Unhealthy)
94 (Unhealthy)
no2
18 (Good)
20 (Good)
29 (Good)
32 (Good)
6.3 (Good)
5.8 (Good)
9 (Good)
114 (Unhealthy for Sensitive Groups)
6.8 (Good)
7.1 (Good)
12 (Good)
15 (Good)
- (Good)
- (Good)
36 (Good)
32 (Good)
24 (Good)
7.9 (Good)
7.8 (Good)
15 (Good)
20 (Good)
34 (Good)
so2
2.2 (Good)
2.4 (Good)
3.6 (Good)
6 (Good)
4.2 (Good)
4 (Good)
2.5 (Good)
2.6 (Good)
3 (Good)
3 (Good)
1.9 (Good)
5.7 (Good)
3.9 (Good)
7.3 (Good)
5.6 (Good)
8.2 (Good)
6.1 (Good)
3 (Good)
4 (Good)
2.2 (Good)
3.9 (Good)
14 (Good)
co
335 (Good)
397 (Good)
476 (Good)
761 (Good)
968 (Good)
1 (Good)
1 (Good)
721 (Good)
598 (Good)
504 (Good)
610 (Good)
552 (Good)
452 (Good)
462 (Good)
958 (Good)
820 (Good)
678 (Good)
361 (Good)
370 (Good)
324 (Good)
12 (Good)
26 (Good)
o3
47 (Good)
62 (Good)
52 (Good)
64 (Good)
48 (Good)
56 (Good)
43 (Good)
29 (Good)
33 (Good)
32 (Good)
30 (Good)
30 (Good)
30 (Good)
33 (Good)
58 (Good)
72 (Moderate)
69 (Good)
43 (Good)
31 (Good)
81 (Moderate)
96 (Moderate)
93 (Moderate)
data source »
Quality of life in Nashik
Green and Parks in the City
Nashik
63%
Nepal: 32%
Bangladesh: 33%
Bhutan: 82%
Sri Lanka: 59%
Pakistan: 49%
particulate matter PM2.5
Nashik
45 (Unhealthy for Sensitive Groups)
Pleasure of spending time in the city
Nashik
62%
Nepal: 32%
Bangladesh: 26%
Bhutan: 61%
Sri Lanka: 52%
Pakistan: 43%
particulate matter PM10
Nashik
100 (Unhealthy)
Air Pollution
Nashik
38%
Nepal: 76%
Bangladesh: 78%
Bhutan: 45%
Sri Lanka: 53%
Pakistan: 64%
Garbage Disposal
Nashik
48%
Nepal: 25%
Bangladesh: 22%
Bhutan: 47%
Sri Lanka: 41%
Pakistan: 34%
Availability and quality of drinking water
Nashik
62%
Nepal: 36%
Bangladesh: 44%
Bhutan: 64%
Sri Lanka: 65%
Pakistan: 44%
Cleanliness and tidiness
Nashik
44%
Nepal: 27%
Bangladesh: 23%
Bhutan: 57%
Sri Lanka: 52%
Pakistan: 40%
Noise and Light pollution
Nashik
62%
Nepal: 55%
Bangladesh: 63%
Bhutan: 55%
Sri Lanka: 50%
Pakistan: 59%
Water Pollution
Nashik
61%
Nepal: 76%
Bangladesh: 74%
Bhutan: 56%
Sri Lanka: 57%
Pakistan: 70%
Source: Numbeo
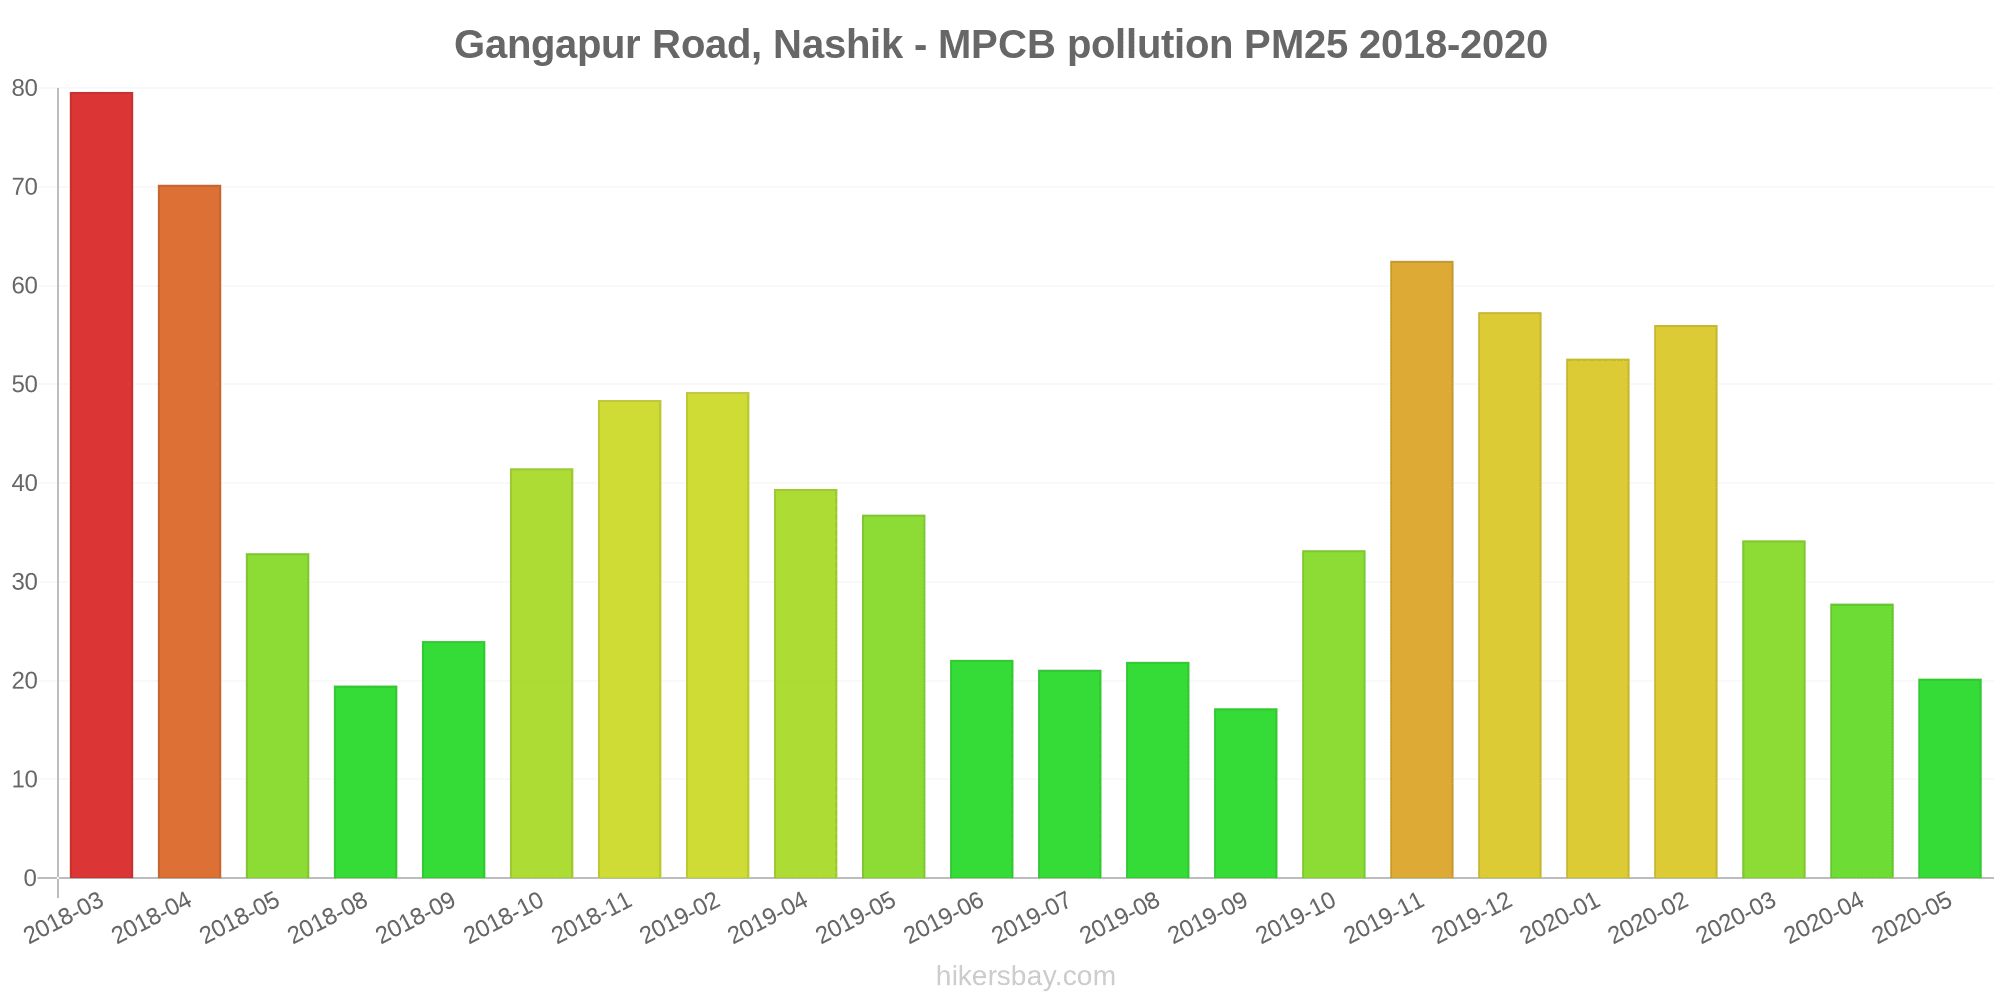
Gangapur Road, Nashik - MPCB
Monday, October 31, 2022, 2:00 AM
PM10 72 (Unhealthy for Sensitive Groups)
particulate matter (PM10) suspended dust
SO2 5.1 (Good)
sulfur dioxide (SO2)
PM2,5 43 (Unhealthy for Sensitive Groups)
particulate matter (PM2.5) dust
CO 790 (Good)
carbon monoxide (CO)
NO2 6.2 (Good)
nitrogen dioxide (NO2)
O3 0.29 (Good)
ozone (O3)
Gangapur Road, Nashik - MPCB
index
2022-10-31
pm10
63
so2
3.2
pm25
42
co
780
no2
7.3
o3
0.14
Gangapur Road, Nashik - MPCB
2018-03 2020-05

index
2020-05
2020-04
2020-03
2020-02
2020-01
2019-12
2019-11
2019-10
2019-09
2019-08
2019-07
2019-06
2019-05
2019-04
2019-02
2018-11
2018-10
2018-09
2018-08
2018-05
2018-04
2018-03
pm25
20
28
34
56
53
57
63
33
17
22
21
22
37
39
49
48
42
24
20
33
70
80
pm10
48
52
74
88
90
89
97
45
30
36
45
49
99
95
74
76
79
45
38
66
83
94
no2
18
20
29
32
6.3
5.8
9
114
6.8
7.1
12
15
-
-
36
32
24
7.9
7.8
15
20
34
so2
2.2
2.4
3.6
6
4.2
4
2.5
2.6
3
3
1.9
5.7
3.9
7.3
5.6
8.2
6.1
3
4
2.2
3.9
14
co
335
397
476
761
968
1
1
721
598
504
610
552
452
462
958
820
678
361
370
324
12
26
o3
47
62
52
64
48
56
43
29
33
32
30
30
30
33
58
72
69
43
31
81
96
93
* Pollution data source:
https://openaq.org
(caaqm)
The data is licensed under CC-By 4.0
PM10 72 (Unhealthy for Sensitive Groups)
SO2 5 (Good)
PM2,5 43 (Unhealthy for Sensitive Groups)
CO 790 (Good)
NO2 6 (Good)
O3 0 (Good)
Data on air pollution from recent days in Nashik
| index | 2022-10-31 |
|---|---|
| pm10 | 63 Unhealthy for Sensitive Groups |
| so2 | 3 Good |
| pm25 | 42 Unhealthy for Sensitive Groups |
| co | 780 Good |
| no2 | 7 Good |
| o3 | 0 Good |
| index | 2020-05 | 2020-04 | 2020-03 | 2020-02 | 2020-01 | 2019-12 | 2019-11 | 2019-10 | 2019-09 | 2019-08 | 2019-07 | 2019-06 | 2019-05 | 2019-04 | 2019-02 | 2018-11 | 2018-10 | 2018-09 | 2018-08 | 2018-05 | 2018-04 | 2018-03 |
|---|---|---|---|---|---|---|---|---|---|---|---|---|---|---|---|---|---|---|---|---|---|---|
| pm25 | 20 (Moderate) | 28 (Moderate) | 34 (Moderate) | 56 (Unhealthy) | 53 (Unhealthy for Sensitive Groups) | 57 (Unhealthy) | 63 (Unhealthy) | 33 (Moderate) | 17 (Moderate) | 22 (Moderate) | 21 (Moderate) | 22 (Moderate) | 37 (Unhealthy for Sensitive Groups) | 39 (Unhealthy for Sensitive Groups) | 49 (Unhealthy for Sensitive Groups) | 48 (Unhealthy for Sensitive Groups) | 42 (Unhealthy for Sensitive Groups) | 24 (Moderate) | 20 (Moderate) | 33 (Moderate) | 70 (Unhealthy) | 80 (Very Unhealthy) |
| pm10 | 48 (Moderate) | 52 (Unhealthy for Sensitive Groups) | 74 (Unhealthy for Sensitive Groups) | 88 (Unhealthy) | 90 (Unhealthy) | 89 (Unhealthy) | 97 (Unhealthy) | 45 (Moderate) | 30 (Moderate) | 36 (Moderate) | 45 (Moderate) | 49 (Moderate) | 99 (Unhealthy) | 95 (Unhealthy) | 74 (Unhealthy for Sensitive Groups) | 76 (Unhealthy for Sensitive Groups) | 79 (Unhealthy for Sensitive Groups) | 45 (Moderate) | 38 (Moderate) | 66 (Unhealthy for Sensitive Groups) | 83 (Unhealthy) | 94 (Unhealthy) |
| no2 | 18 (Good) | 20 (Good) | 29 (Good) | 32 (Good) | 6.3 (Good) | 5.8 (Good) | 9 (Good) | 114 (Unhealthy for Sensitive Groups) | 6.8 (Good) | 7.1 (Good) | 12 (Good) | 15 (Good) | - (Good) | - (Good) | 36 (Good) | 32 (Good) | 24 (Good) | 7.9 (Good) | 7.8 (Good) | 15 (Good) | 20 (Good) | 34 (Good) |
| so2 | 2.2 (Good) | 2.4 (Good) | 3.6 (Good) | 6 (Good) | 4.2 (Good) | 4 (Good) | 2.5 (Good) | 2.6 (Good) | 3 (Good) | 3 (Good) | 1.9 (Good) | 5.7 (Good) | 3.9 (Good) | 7.3 (Good) | 5.6 (Good) | 8.2 (Good) | 6.1 (Good) | 3 (Good) | 4 (Good) | 2.2 (Good) | 3.9 (Good) | 14 (Good) |
| co | 335 (Good) | 397 (Good) | 476 (Good) | 761 (Good) | 968 (Good) | 1 (Good) | 1 (Good) | 721 (Good) | 598 (Good) | 504 (Good) | 610 (Good) | 552 (Good) | 452 (Good) | 462 (Good) | 958 (Good) | 820 (Good) | 678 (Good) | 361 (Good) | 370 (Good) | 324 (Good) | 12 (Good) | 26 (Good) |
| o3 | 47 (Good) | 62 (Good) | 52 (Good) | 64 (Good) | 48 (Good) | 56 (Good) | 43 (Good) | 29 (Good) | 33 (Good) | 32 (Good) | 30 (Good) | 30 (Good) | 30 (Good) | 33 (Good) | 58 (Good) | 72 (Moderate) | 69 (Good) | 43 (Good) | 31 (Good) | 81 (Moderate) | 96 (Moderate) | 93 (Moderate) |
Green and Parks in the City
Nashik 63%
Nepal: 32% Bangladesh: 33% Bhutan: 82% Sri Lanka: 59% Pakistan: 49%particulate matter PM2.5
Nashik 45 (Unhealthy for Sensitive Groups)
Pleasure of spending time in the city
Nashik 62%
Nepal: 32% Bangladesh: 26% Bhutan: 61% Sri Lanka: 52% Pakistan: 43%particulate matter PM10
Nashik 100 (Unhealthy)
Air Pollution
Nashik 38%
Nepal: 76% Bangladesh: 78% Bhutan: 45% Sri Lanka: 53% Pakistan: 64%Garbage Disposal
Nashik 48%
Nepal: 25% Bangladesh: 22% Bhutan: 47% Sri Lanka: 41% Pakistan: 34%Availability and quality of drinking water
Nashik 62%
Nepal: 36% Bangladesh: 44% Bhutan: 64% Sri Lanka: 65% Pakistan: 44%Cleanliness and tidiness
Nashik 44%
Nepal: 27% Bangladesh: 23% Bhutan: 57% Sri Lanka: 52% Pakistan: 40%Noise and Light pollution
Nashik 62%
Nepal: 55% Bangladesh: 63% Bhutan: 55% Sri Lanka: 50% Pakistan: 59%Water Pollution
Nashik 61%
Nepal: 76% Bangladesh: 74% Bhutan: 56% Sri Lanka: 57% Pakistan: 70%PM10 72 (Unhealthy for Sensitive Groups)
particulate matter (PM10) suspended dustSO2 5.1 (Good)
sulfur dioxide (SO2)PM2,5 43 (Unhealthy for Sensitive Groups)
particulate matter (PM2.5) dustCO 790 (Good)
carbon monoxide (CO)NO2 6.2 (Good)
nitrogen dioxide (NO2)O3 0.29 (Good)
ozone (O3)Gangapur Road, Nashik - MPCB
| index | 2022-10-31 |
|---|---|
| pm10 | 63 |
| so2 | 3.2 |
| pm25 | 42 |
| co | 780 |
| no2 | 7.3 |
| o3 | 0.14 |
Gangapur Road, Nashik - MPCB
| index | 2020-05 | 2020-04 | 2020-03 | 2020-02 | 2020-01 | 2019-12 | 2019-11 | 2019-10 | 2019-09 | 2019-08 | 2019-07 | 2019-06 | 2019-05 | 2019-04 | 2019-02 | 2018-11 | 2018-10 | 2018-09 | 2018-08 | 2018-05 | 2018-04 | 2018-03 |
|---|---|---|---|---|---|---|---|---|---|---|---|---|---|---|---|---|---|---|---|---|---|---|
| pm25 | 20 | 28 | 34 | 56 | 53 | 57 | 63 | 33 | 17 | 22 | 21 | 22 | 37 | 39 | 49 | 48 | 42 | 24 | 20 | 33 | 70 | 80 |
| pm10 | 48 | 52 | 74 | 88 | 90 | 89 | 97 | 45 | 30 | 36 | 45 | 49 | 99 | 95 | 74 | 76 | 79 | 45 | 38 | 66 | 83 | 94 |
| no2 | 18 | 20 | 29 | 32 | 6.3 | 5.8 | 9 | 114 | 6.8 | 7.1 | 12 | 15 | - | - | 36 | 32 | 24 | 7.9 | 7.8 | 15 | 20 | 34 |
| so2 | 2.2 | 2.4 | 3.6 | 6 | 4.2 | 4 | 2.5 | 2.6 | 3 | 3 | 1.9 | 5.7 | 3.9 | 7.3 | 5.6 | 8.2 | 6.1 | 3 | 4 | 2.2 | 3.9 | 14 |
| co | 335 | 397 | 476 | 761 | 968 | 1 | 1 | 721 | 598 | 504 | 610 | 552 | 452 | 462 | 958 | 820 | 678 | 361 | 370 | 324 | 12 | 26 |
| o3 | 47 | 62 | 52 | 64 | 48 | 56 | 43 | 29 | 33 | 32 | 30 | 30 | 30 | 33 | 58 | 72 | 69 | 43 | 31 | 81 | 96 | 93 |