Air Pollution in Nagpur: Real-time Air Quality Index and smog alert.
Pollution and air quality forecast for Nagpur. Today is Wednesday, May 13, 2026. The following air pollution values have been recorded for Nagpur:- sulfur dioxide (SO2) - 0 (Good)
- carbon monoxide (CO) - 200 (Good)
- ozone (O3) - 11 (Good)
- particulate matter (PM2.5) dust - 89 (Very Unhealthy)
- particulate matter (PM10) suspended dust - 103 (Unhealthy)
- nitrogen dioxide (NO2) - 12 (Good)

What is the air quality in Nagpur today? Is the air polluted in Nagpur?. Is there smog?
What is the level of SO2 pollution? (sulfur dioxide (SO2))
0 (Good)
How high is the CO level? (carbon monoxide (CO))
200 (Good)
How is the O3 level today in Nagpur? (ozone (O3))
11 (Good)
What is the current level of PM2.5 in Nagpur? (particulate matter (PM2.5) dust)
Today's PM2.5 level is:
89 (Very Unhealthy)
For comparison, the highest level of PM2.5 in Nagpur in the last 7 days was: 89 (Monday, October 31, 2022) and the lowest: 89 (Monday, October 31, 2022).
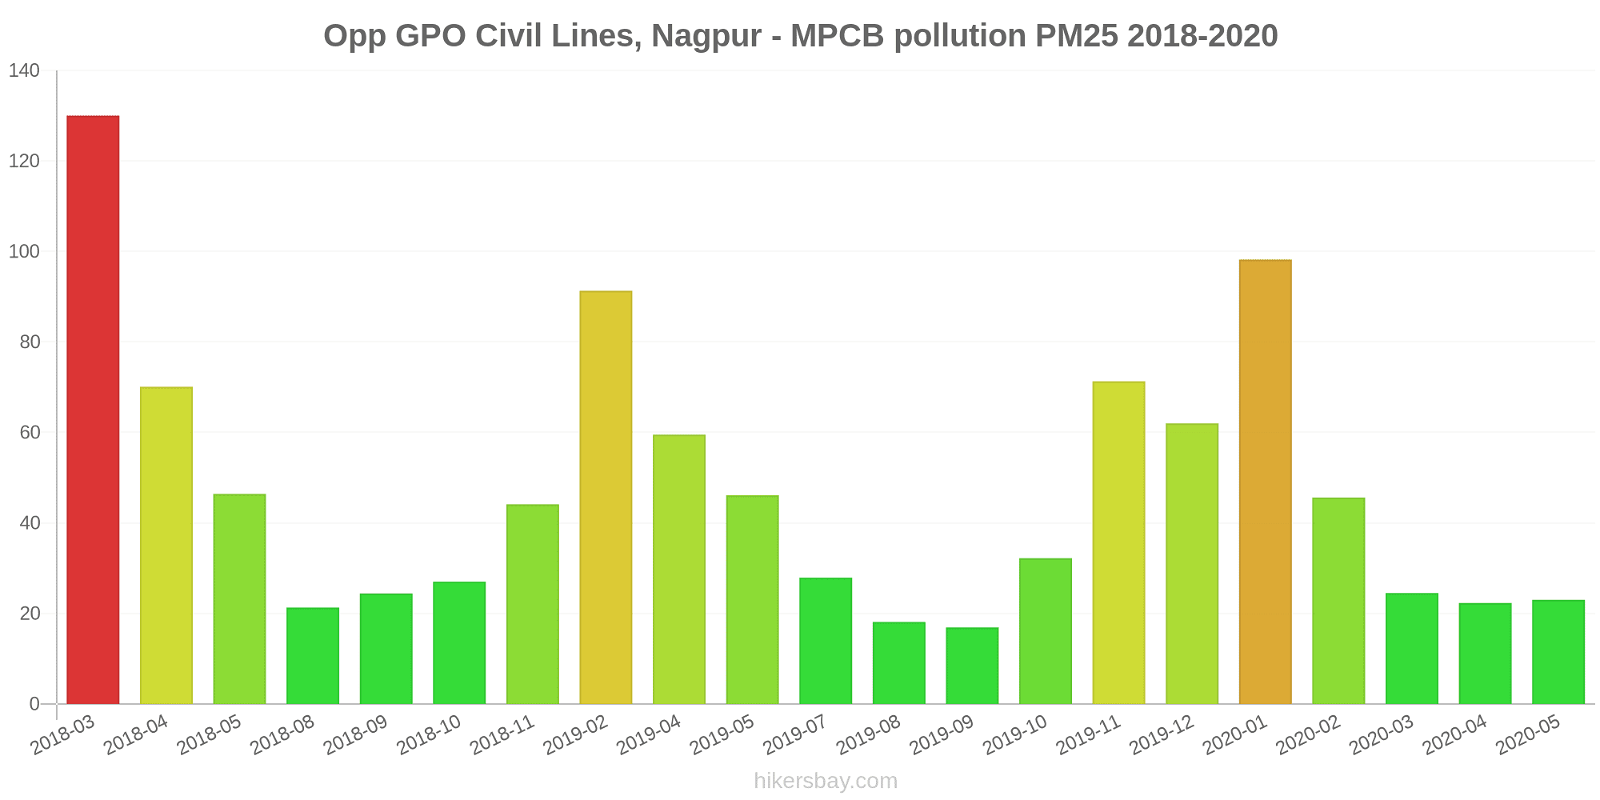
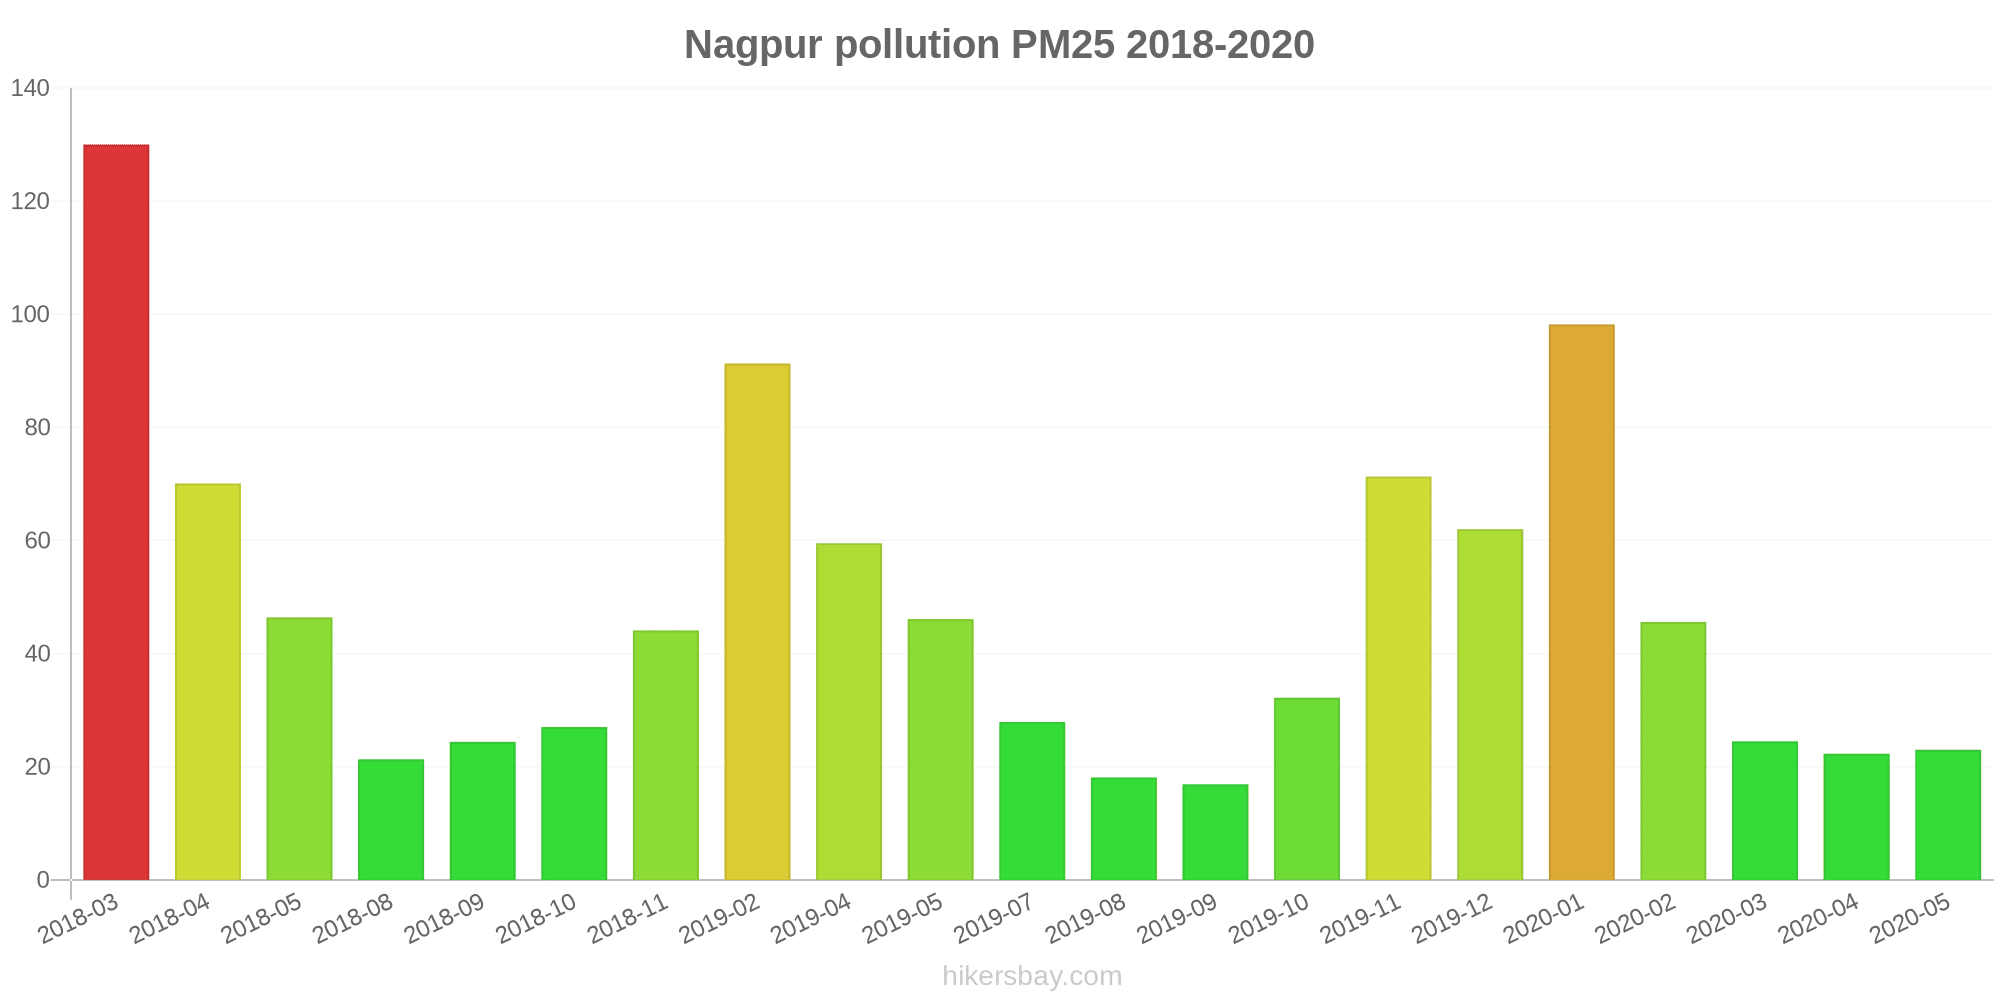
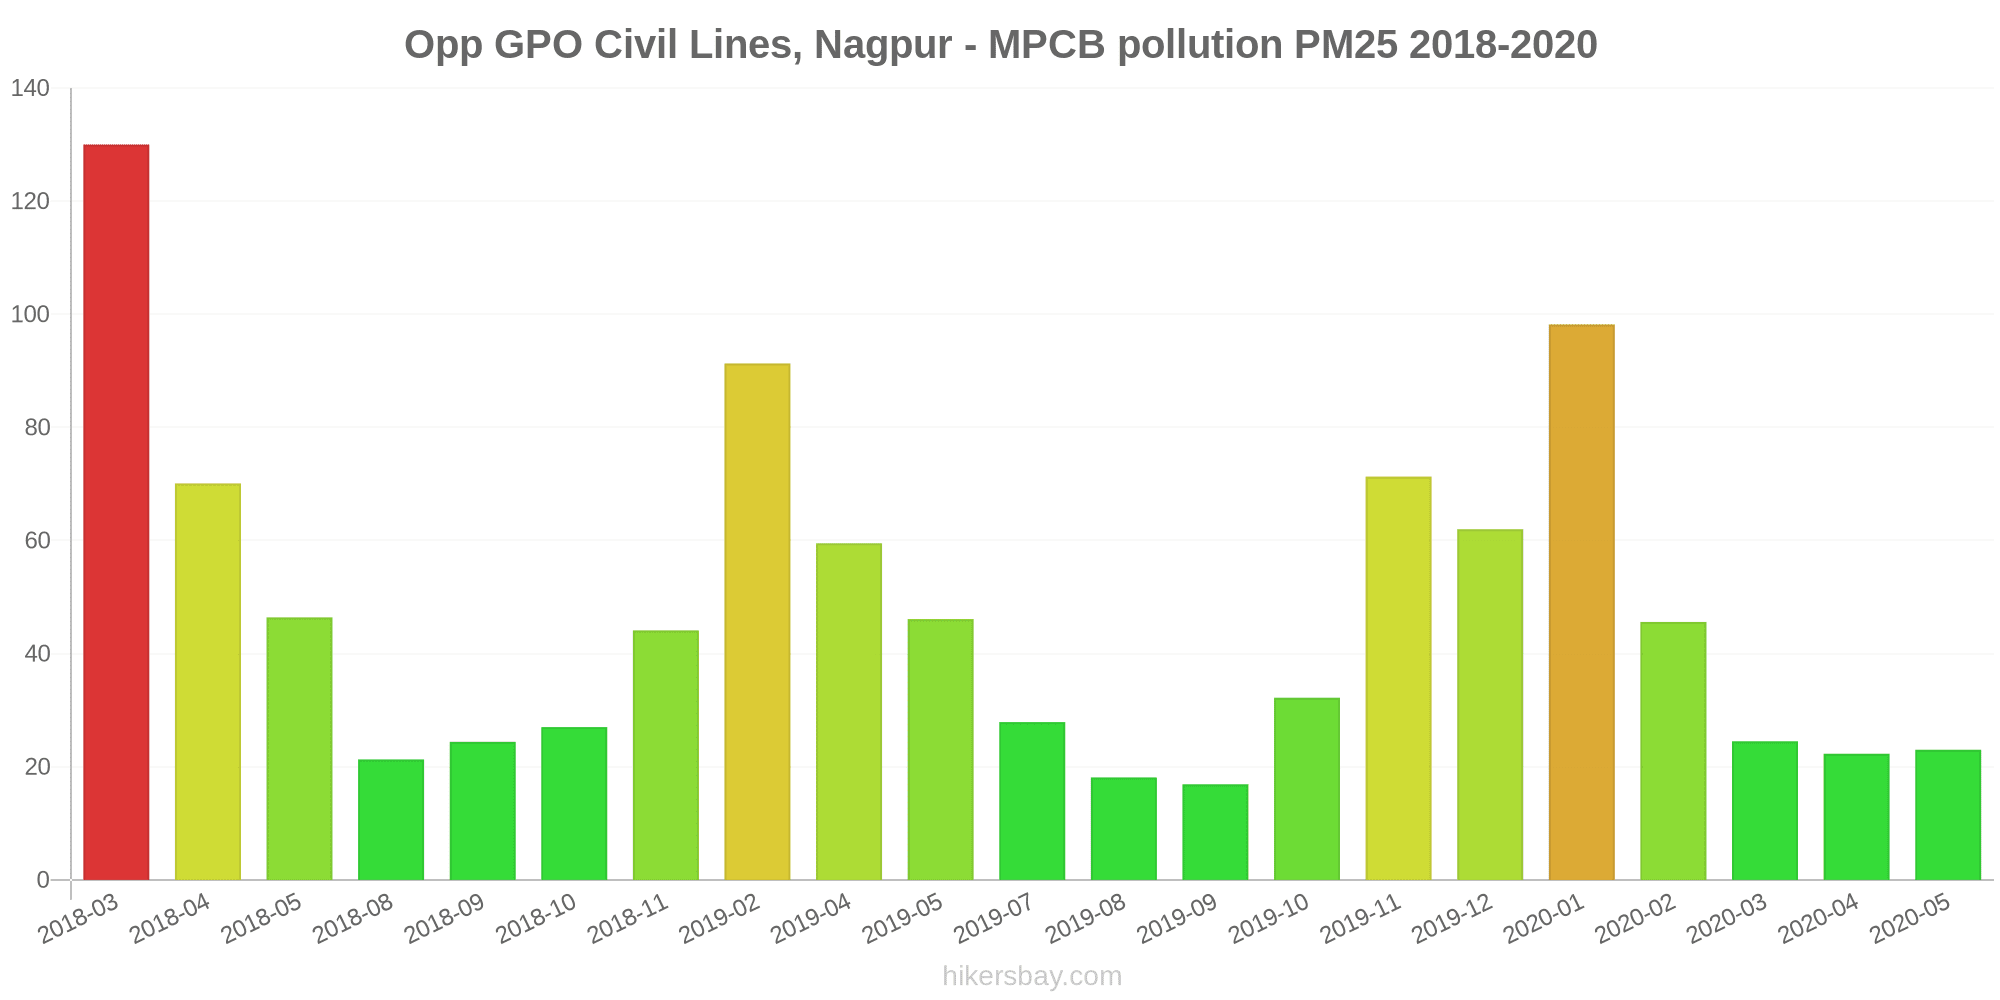
The highest PM2.5 values were recorded: 130 (March 2018).
The lowest level of particulate matter PM2.5 pollution occurs in month: September (17).
What is the level of PM10 today in Nagpur? (particulate matter (PM10) suspended dust)
The current level of particulate matter PM10 in Nagpur is:
103 (Unhealthy)
The highest PM10 values usually occur in month: 167 (February 2019).
The lowest value of particulate matter PM10 pollution in Nagpur is usually recorded in: May (36).
How high is the level of NO2? (nitrogen dioxide (NO2))
12 (Good)
Current data Monday, October 31, 2022, 12:45 AM
SO2 0 (Good)
CO 200 (Good)
O3 11 (Good)
PM2,5 89 (Very Unhealthy)
PM10 103 (Unhealthy)
NO2 12 (Good)
Data on air pollution from recent days in Nagpur
index
2022-10-31
so2
0
Good
co
200
Good
o3
11
Good
pm25
89
Very Unhealthy
pm10
103
Unhealthy
no2
12
Good
data source »
Air pollution in Nagpur from March 2018 to May 2020

index
2020-05
2020-04
2020-03
2020-02
2020-01
2019-12
2019-11
2019-10
2019-09
2019-08
2019-07
2019-05
2019-04
2019-02
2018-11
2018-10
2018-09
2018-08
2018-05
2018-04
2018-03
pm25
23 (Moderate)
22 (Moderate)
25 (Moderate)
46 (Unhealthy for Sensitive Groups)
98 (Very Unhealthy)
62 (Unhealthy)
71 (Unhealthy)
32 (Moderate)
17 (Moderate)
18 (Moderate)
28 (Moderate)
46 (Unhealthy for Sensitive Groups)
60 (Unhealthy)
91 (Very Unhealthy)
44 (Unhealthy for Sensitive Groups)
27 (Moderate)
24 (Moderate)
21 (Moderate)
46 (Unhealthy for Sensitive Groups)
70 (Unhealthy)
130 (Very bad Hazardous)
pm10
36 (Moderate)
46 (Moderate)
55 (Unhealthy for Sensitive Groups)
64 (Unhealthy for Sensitive Groups)
75 (Unhealthy for Sensitive Groups)
89 (Unhealthy)
114 (Very Unhealthy)
68 (Unhealthy for Sensitive Groups)
39 (Moderate)
37 (Moderate)
45 (Moderate)
82 (Unhealthy)
103 (Unhealthy)
167 (Very bad Hazardous)
113 (Very Unhealthy)
100 (Unhealthy)
57 (Unhealthy for Sensitive Groups)
46 (Moderate)
69 (Unhealthy for Sensitive Groups)
73 (Unhealthy for Sensitive Groups)
106 (Unhealthy)
no2
18 (Good)
19 (Good)
47 (Moderate)
47 (Moderate)
46 (Moderate)
51 (Moderate)
61 (Moderate)
47 (Moderate)
41 (Moderate)
- (Good)
22 (Good)
27 (Good)
44 (Moderate)
94 (Moderate)
47 (Moderate)
46 (Moderate)
28 (Good)
17 (Good)
31 (Good)
47 (Moderate)
54 (Moderate)
so2
1.7 (Good)
1.8 (Good)
4.8 (Good)
14 (Good)
11 (Good)
8.5 (Good)
8.6 (Good)
3.1 (Good)
1.2 (Good)
0.59 (Good)
1 (Good)
27 (Good)
20 (Good)
16 (Good)
12 (Good)
16 (Good)
7.3 (Good)
3.5 (Good)
16 (Good)
20 (Good)
19 (Good)
co
374 (Good)
481 (Good)
590 (Good)
761 (Good)
935 (Good)
949 (Good)
1 (Good)
882 (Good)
581 (Good)
396 (Good)
377 (Good)
820 (Good)
1 (Good)
1 (Good)
870 (Good)
1 (Good)
631 (Good)
637 (Good)
983 (Good)
27 (Good)
56 (Good)
o3
62 (Good)
54 (Good)
43 (Good)
38 (Good)
23 (Good)
22 (Good)
23 (Good)
12 (Good)
3.2 (Good)
3.4 (Good)
6.7 (Good)
135 (Unhealthy for Sensitive Groups)
126 (Unhealthy for Sensitive Groups)
148 (Unhealthy for Sensitive Groups)
56 (Good)
49 (Good)
29 (Good)
24 (Good)
48 (Good)
36 (Good)
30 (Good)
data source »
Quality of life in Nagpur
Green and Parks in the City
Nagpur
61%
Nepal: 32%
Bangladesh: 33%
Bhutan: 82%
Sri Lanka: 59%
Pakistan: 49%
particulate matter PM2.5
Nagpur
84 (Very Unhealthy)
Pleasure of spending time in the city
Nagpur
55%
Nepal: 32%
Bangladesh: 26%
Bhutan: 61%
Sri Lanka: 52%
Pakistan: 43%
particulate matter PM10
Nagpur
86 (Unhealthy)
Air Pollution
Nagpur
52%
Nepal: 76%
Bangladesh: 78%
Bhutan: 45%
Sri Lanka: 53%
Pakistan: 64%
Garbage Disposal
Nagpur
46%
Nepal: 25%
Bangladesh: 22%
Bhutan: 47%
Sri Lanka: 41%
Pakistan: 34%
Availability and quality of drinking water
Nagpur
55%
Nepal: 36%
Bangladesh: 44%
Bhutan: 64%
Sri Lanka: 65%
Pakistan: 44%
Cleanliness and tidiness
Nagpur
45%
Nepal: 27%
Bangladesh: 23%
Bhutan: 57%
Sri Lanka: 52%
Pakistan: 40%
Noise and Light pollution
Nagpur
51%
Nepal: 55%
Bangladesh: 63%
Bhutan: 55%
Sri Lanka: 50%
Pakistan: 59%
Water Pollution
Nagpur
70%
Nepal: 76%
Bangladesh: 74%
Bhutan: 56%
Sri Lanka: 57%
Pakistan: 70%
Source: Numbeo
Opp GPO Civil Lines, Nagpur - MPCB
Monday, October 31, 2022, 12:45 AM
SO2 0 (Good)
sulfur dioxide (SO2)
CO 200 (Good)
carbon monoxide (CO)
O3 11 (Good)
ozone (O3)
PM2,5 89 (Very Unhealthy)
particulate matter (PM2.5) dust
PM10 103 (Unhealthy)
particulate matter (PM10) suspended dust
NO2 12 (Good)
nitrogen dioxide (NO2)
Opp GPO Civil Lines, Nagpur - MPCB
index
2022-10-31
so2
0
co
200
o3
11
pm25
89
pm10
103
no2
12
Opp GPO Civil Lines, Nagpur - MPCB
2018-03 2020-05
index
2020-05
2020-04
2020-03
2020-02
2020-01
2019-12
2019-11
2019-10
2019-09
2019-08
2019-07
2019-05
2019-04
2019-02
2018-11
2018-10
2018-09
2018-08
2018-05
2018-04
2018-03
pm25
23
22
25
46
98
62
71
32
17
18
28
46
60
91
44
27
24
21
46
70
130
pm10
36
46
55
64
75
89
114
68
39
37
45
82
103
167
113
100
57
46
69
73
106
no2
18
19
47
47
46
51
61
47
41
-
22
27
44
94
47
46
28
17
31
47
54
so2
1.7
1.8
4.8
14
11
8.5
8.6
3.1
1.2
0.59
1
27
20
16
12
16
7.3
3.5
16
20
19
co
374
481
590
761
935
949
1
882
581
396
377
820
1
1
870
1
631
637
983
27
56
o3
62
54
43
38
23
22
23
12
3.2
3.4
6.7
135
126
148
56
49
29
24
48
36
30
* Pollution data source:
https://openaq.org
(caaqm)
The data is licensed under CC-By 4.0
SO2 0 (Good)
CO 200 (Good)
O3 11 (Good)
PM2,5 89 (Very Unhealthy)
PM10 103 (Unhealthy)
NO2 12 (Good)
Data on air pollution from recent days in Nagpur
| index | 2022-10-31 |
|---|---|
| so2 | 0 Good |
| co | 200 Good |
| o3 | 11 Good |
| pm25 | 89 Very Unhealthy |
| pm10 | 103 Unhealthy |
| no2 | 12 Good |
| index | 2020-05 | 2020-04 | 2020-03 | 2020-02 | 2020-01 | 2019-12 | 2019-11 | 2019-10 | 2019-09 | 2019-08 | 2019-07 | 2019-05 | 2019-04 | 2019-02 | 2018-11 | 2018-10 | 2018-09 | 2018-08 | 2018-05 | 2018-04 | 2018-03 |
|---|---|---|---|---|---|---|---|---|---|---|---|---|---|---|---|---|---|---|---|---|---|
| pm25 | 23 (Moderate) | 22 (Moderate) | 25 (Moderate) | 46 (Unhealthy for Sensitive Groups) | 98 (Very Unhealthy) | 62 (Unhealthy) | 71 (Unhealthy) | 32 (Moderate) | 17 (Moderate) | 18 (Moderate) | 28 (Moderate) | 46 (Unhealthy for Sensitive Groups) | 60 (Unhealthy) | 91 (Very Unhealthy) | 44 (Unhealthy for Sensitive Groups) | 27 (Moderate) | 24 (Moderate) | 21 (Moderate) | 46 (Unhealthy for Sensitive Groups) | 70 (Unhealthy) | 130 (Very bad Hazardous) |
| pm10 | 36 (Moderate) | 46 (Moderate) | 55 (Unhealthy for Sensitive Groups) | 64 (Unhealthy for Sensitive Groups) | 75 (Unhealthy for Sensitive Groups) | 89 (Unhealthy) | 114 (Very Unhealthy) | 68 (Unhealthy for Sensitive Groups) | 39 (Moderate) | 37 (Moderate) | 45 (Moderate) | 82 (Unhealthy) | 103 (Unhealthy) | 167 (Very bad Hazardous) | 113 (Very Unhealthy) | 100 (Unhealthy) | 57 (Unhealthy for Sensitive Groups) | 46 (Moderate) | 69 (Unhealthy for Sensitive Groups) | 73 (Unhealthy for Sensitive Groups) | 106 (Unhealthy) |
| no2 | 18 (Good) | 19 (Good) | 47 (Moderate) | 47 (Moderate) | 46 (Moderate) | 51 (Moderate) | 61 (Moderate) | 47 (Moderate) | 41 (Moderate) | - (Good) | 22 (Good) | 27 (Good) | 44 (Moderate) | 94 (Moderate) | 47 (Moderate) | 46 (Moderate) | 28 (Good) | 17 (Good) | 31 (Good) | 47 (Moderate) | 54 (Moderate) |
| so2 | 1.7 (Good) | 1.8 (Good) | 4.8 (Good) | 14 (Good) | 11 (Good) | 8.5 (Good) | 8.6 (Good) | 3.1 (Good) | 1.2 (Good) | 0.59 (Good) | 1 (Good) | 27 (Good) | 20 (Good) | 16 (Good) | 12 (Good) | 16 (Good) | 7.3 (Good) | 3.5 (Good) | 16 (Good) | 20 (Good) | 19 (Good) |
| co | 374 (Good) | 481 (Good) | 590 (Good) | 761 (Good) | 935 (Good) | 949 (Good) | 1 (Good) | 882 (Good) | 581 (Good) | 396 (Good) | 377 (Good) | 820 (Good) | 1 (Good) | 1 (Good) | 870 (Good) | 1 (Good) | 631 (Good) | 637 (Good) | 983 (Good) | 27 (Good) | 56 (Good) |
| o3 | 62 (Good) | 54 (Good) | 43 (Good) | 38 (Good) | 23 (Good) | 22 (Good) | 23 (Good) | 12 (Good) | 3.2 (Good) | 3.4 (Good) | 6.7 (Good) | 135 (Unhealthy for Sensitive Groups) | 126 (Unhealthy for Sensitive Groups) | 148 (Unhealthy for Sensitive Groups) | 56 (Good) | 49 (Good) | 29 (Good) | 24 (Good) | 48 (Good) | 36 (Good) | 30 (Good) |
Green and Parks in the City
Nagpur 61%
Nepal: 32% Bangladesh: 33% Bhutan: 82% Sri Lanka: 59% Pakistan: 49%particulate matter PM2.5
Nagpur 84 (Very Unhealthy)
Pleasure of spending time in the city
Nagpur 55%
Nepal: 32% Bangladesh: 26% Bhutan: 61% Sri Lanka: 52% Pakistan: 43%particulate matter PM10
Nagpur 86 (Unhealthy)
Air Pollution
Nagpur 52%
Nepal: 76% Bangladesh: 78% Bhutan: 45% Sri Lanka: 53% Pakistan: 64%Garbage Disposal
Nagpur 46%
Nepal: 25% Bangladesh: 22% Bhutan: 47% Sri Lanka: 41% Pakistan: 34%Availability and quality of drinking water
Nagpur 55%
Nepal: 36% Bangladesh: 44% Bhutan: 64% Sri Lanka: 65% Pakistan: 44%Cleanliness and tidiness
Nagpur 45%
Nepal: 27% Bangladesh: 23% Bhutan: 57% Sri Lanka: 52% Pakistan: 40%Noise and Light pollution
Nagpur 51%
Nepal: 55% Bangladesh: 63% Bhutan: 55% Sri Lanka: 50% Pakistan: 59%Water Pollution
Nagpur 70%
Nepal: 76% Bangladesh: 74% Bhutan: 56% Sri Lanka: 57% Pakistan: 70%SO2 0 (Good)
sulfur dioxide (SO2)CO 200 (Good)
carbon monoxide (CO)O3 11 (Good)
ozone (O3)PM2,5 89 (Very Unhealthy)
particulate matter (PM2.5) dustPM10 103 (Unhealthy)
particulate matter (PM10) suspended dustNO2 12 (Good)
nitrogen dioxide (NO2)Opp GPO Civil Lines, Nagpur - MPCB
| index | 2022-10-31 |
|---|---|
| so2 | 0 |
| co | 200 |
| o3 | 11 |
| pm25 | 89 |
| pm10 | 103 |
| no2 | 12 |
Opp GPO Civil Lines, Nagpur - MPCB
| index | 2020-05 | 2020-04 | 2020-03 | 2020-02 | 2020-01 | 2019-12 | 2019-11 | 2019-10 | 2019-09 | 2019-08 | 2019-07 | 2019-05 | 2019-04 | 2019-02 | 2018-11 | 2018-10 | 2018-09 | 2018-08 | 2018-05 | 2018-04 | 2018-03 |
|---|---|---|---|---|---|---|---|---|---|---|---|---|---|---|---|---|---|---|---|---|---|
| pm25 | 23 | 22 | 25 | 46 | 98 | 62 | 71 | 32 | 17 | 18 | 28 | 46 | 60 | 91 | 44 | 27 | 24 | 21 | 46 | 70 | 130 |
| pm10 | 36 | 46 | 55 | 64 | 75 | 89 | 114 | 68 | 39 | 37 | 45 | 82 | 103 | 167 | 113 | 100 | 57 | 46 | 69 | 73 | 106 |
| no2 | 18 | 19 | 47 | 47 | 46 | 51 | 61 | 47 | 41 | - | 22 | 27 | 44 | 94 | 47 | 46 | 28 | 17 | 31 | 47 | 54 |
| so2 | 1.7 | 1.8 | 4.8 | 14 | 11 | 8.5 | 8.6 | 3.1 | 1.2 | 0.59 | 1 | 27 | 20 | 16 | 12 | 16 | 7.3 | 3.5 | 16 | 20 | 19 |
| co | 374 | 481 | 590 | 761 | 935 | 949 | 1 | 882 | 581 | 396 | 377 | 820 | 1 | 1 | 870 | 1 | 631 | 637 | 983 | 27 | 56 |
| o3 | 62 | 54 | 43 | 38 | 23 | 22 | 23 | 12 | 3.2 | 3.4 | 6.7 | 135 | 126 | 148 | 56 | 49 | 29 | 24 | 48 | 36 | 30 |