Air Pollution in Fatehgarh Sahib: Real-time Air Quality Index and smog alert.
Pollution and air quality forecast for Fatehgarh Sahib. Today is Saturday, May 16, 2026. The following air pollution values have been recorded for Fatehgarh Sahib:- particulate matter (PM2.5) dust - 60 (Unhealthy)
- particulate matter (PM10) suspended dust - 142 (Very Unhealthy)
- nitrogen dioxide (NO2) - 20 (Good)
- sulfur dioxide (SO2) - 14 (Good)
- carbon monoxide (CO) - 660 (Good)
- ozone (O3) - 68 (Good)

What is the air quality in Fatehgarh Sahib today? Is the air polluted in Fatehgarh Sahib?. Is there smog?
What is the current level of PM2.5 in Fatehgarh Sahib? (particulate matter (PM2.5) dust)
Today's PM2.5 level is:
60 (Unhealthy)
For comparison, the highest level of PM2.5 in Fatehgarh Sahib in the last 7 days was: 60 (Monday, October 31, 2022) and the lowest: 60 (Monday, October 31, 2022).
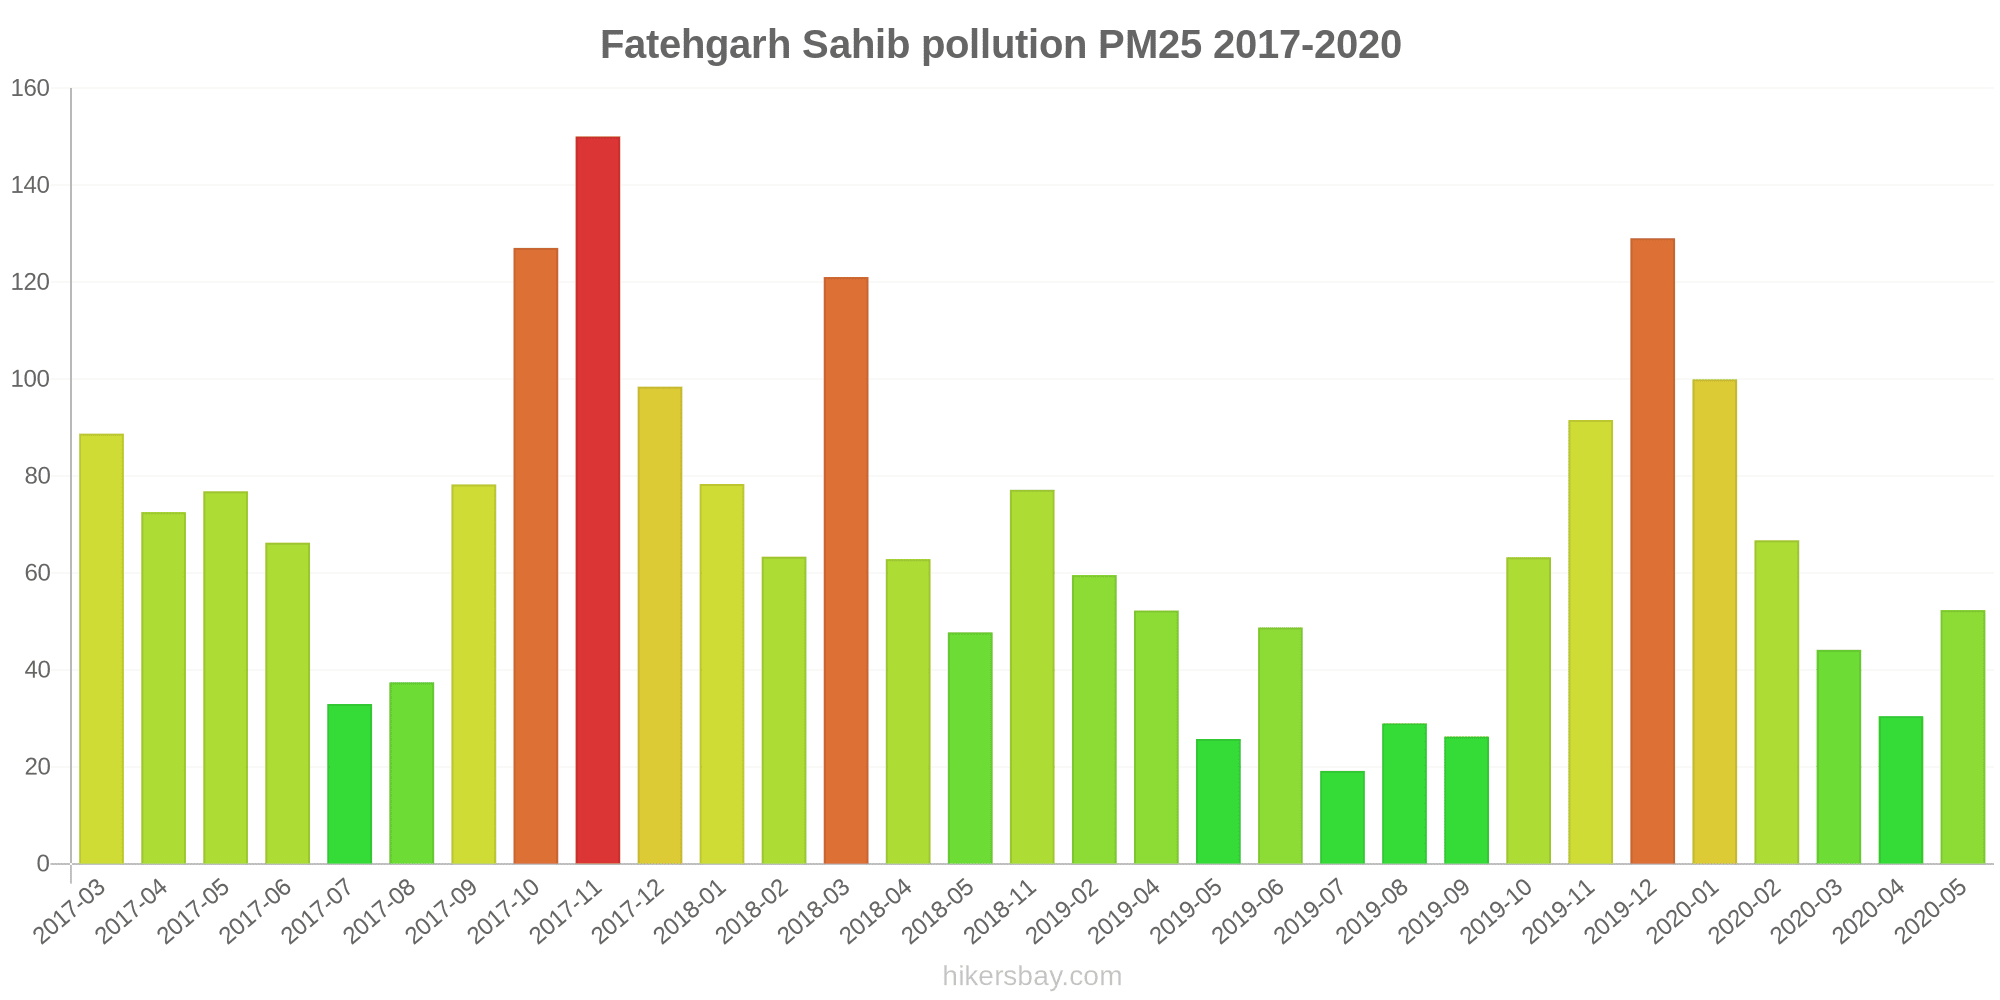
The highest PM2.5 values were recorded: 150 (November 2017).
The lowest level of particulate matter PM2.5 pollution occurs in month: July (19).
What is the level of PM10 today in Fatehgarh Sahib? (particulate matter (PM10) suspended dust)
The current level of particulate matter PM10 in Fatehgarh Sahib is:
142 (Very Unhealthy)
The highest PM10 values usually occur in month: 276 (November 2017).
The lowest value of particulate matter PM10 pollution in Fatehgarh Sahib is usually recorded in: August (55).
How high is the level of NO2? (nitrogen dioxide (NO2))
20 (Good)
What is the level of SO2 pollution? (sulfur dioxide (SO2))
14 (Good)
How high is the CO level? (carbon monoxide (CO))
660 (Good)
How is the O3 level today in Fatehgarh Sahib? (ozone (O3))
68 (Good)
Current data Monday, October 31, 2022, 2:00 AM
PM2,5 60 (Unhealthy)
PM10 142 (Very Unhealthy)
NO2 20 (Good)
SO2 14 (Good)
CO 660 (Good)
O3 68 (Good)
Data on air pollution from recent days in Fatehgarh Sahib
index
2022-10-31
pm25
60
Unhealthy
pm10
142
Very Unhealthy
no2
20
Good
so2
14
Good
co
660
Good
o3
68
Good
data source »
Air pollution in Fatehgarh Sahib from March 2017 to May 2020

index
2020-05
2020-04
2020-03
2020-02
2020-01
2019-12
2019-11
2019-10
2019-09
2019-08
2019-07
2019-06
2019-05
2019-04
2019-02
2018-11
2018-10
2018-09
2018-08
2018-05
2018-04
2018-03
2018-02
2018-01
2017-12
2017-11
2017-10
2017-09
2017-08
2017-07
2017-06
2017-05
2017-04
2017-03
pm25
52 (Unhealthy for Sensitive Groups)
30 (Moderate)
44 (Unhealthy for Sensitive Groups)
67 (Unhealthy)
100 (Very Unhealthy)
129 (Very bad Hazardous)
92 (Very Unhealthy)
63 (Unhealthy)
26 (Moderate)
29 (Moderate)
19 (Moderate)
49 (Unhealthy for Sensitive Groups)
26 (Moderate)
52 (Unhealthy for Sensitive Groups)
60 (Unhealthy)
77 (Very Unhealthy)
- (Good)
- (Good)
- (Good)
48 (Unhealthy for Sensitive Groups)
63 (Unhealthy)
121 (Very bad Hazardous)
63 (Unhealthy)
78 (Very Unhealthy)
98 (Very Unhealthy)
150 (Very bad Hazardous)
127 (Very bad Hazardous)
78 (Very Unhealthy)
37 (Unhealthy for Sensitive Groups)
33 (Moderate)
66 (Unhealthy)
77 (Very Unhealthy)
73 (Unhealthy)
89 (Very Unhealthy)
pm10
129 (Very Unhealthy)
64 (Unhealthy for Sensitive Groups)
81 (Unhealthy)
151 (Very bad Hazardous)
153 (Very bad Hazardous)
167 (Very bad Hazardous)
191 (Very bad Hazardous)
121 (Very Unhealthy)
61 (Unhealthy for Sensitive Groups)
55 (Unhealthy for Sensitive Groups)
60 (Unhealthy for Sensitive Groups)
152 (Very bad Hazardous)
80 (Unhealthy)
163 (Very bad Hazardous)
142 (Very Unhealthy)
129 (Very Unhealthy)
124 (Very Unhealthy)
57 (Unhealthy for Sensitive Groups)
64 (Unhealthy for Sensitive Groups)
107 (Unhealthy)
117 (Very Unhealthy)
109 (Unhealthy)
100 (Unhealthy)
131 (Very Unhealthy)
160 (Very bad Hazardous)
276 (Very bad Hazardous)
236 (Very bad Hazardous)
155 (Very bad Hazardous)
100 (Unhealthy)
125 (Very Unhealthy)
173 (Very bad Hazardous)
212 (Very bad Hazardous)
193 (Very bad Hazardous)
202 (Very bad Hazardous)
no2
8.3 (Good)
10 (Good)
12 (Good)
14 (Good)
16 (Good)
13 (Good)
26 (Good)
15 (Good)
- (Good)
10 (Good)
11 (Good)
11 (Good)
11 (Good)
11 (Good)
- (Good)
18 (Good)
16 (Good)
14 (Good)
25 (Good)
39 (Good)
17 (Good)
31 (Good)
45 (Moderate)
26 (Good)
60 (Moderate)
103 (Unhealthy for Sensitive Groups)
37 (Good)
11 (Good)
11 (Good)
12 (Good)
36 (Good)
11 (Good)
32 (Good)
35 (Good)
so2
22 (Good)
4.5 (Good)
13 (Good)
48 (Good)
28 (Good)
11 (Good)
24 (Good)
11 (Good)
11 (Good)
9.1 (Good)
3 (Good)
9.7 (Good)
7.2 (Good)
9.6 (Good)
11 (Good)
12 (Good)
11 (Good)
10 (Good)
37 (Good)
21 (Good)
16 (Good)
21 (Good)
8.3 (Good)
13 (Good)
9.6 (Good)
8.4 (Good)
7.8 (Good)
16 (Good)
4.2 (Good)
12 (Good)
29 (Good)
22 (Good)
13 (Good)
12 (Good)
co
798 (Good)
298 (Good)
341 (Good)
426 (Good)
513 (Good)
609 (Good)
677 (Good)
549 (Good)
670 (Good)
628 (Good)
759 (Good)
755 (Good)
392 (Good)
408 (Good)
556 (Good)
665 (Good)
1 (Good)
552 (Good)
479 (Good)
1 (Good)
27 (Good)
68 (Good)
1 (Good)
1 (Good)
1 (Good)
966 (Good)
793 (Good)
871 (Good)
525 (Good)
813 (Good)
783 (Good)
542 (Good)
662 (Good)
522 (Good)
o3
20 (Good)
18 (Good)
15 (Good)
17 (Good)
10 (Good)
10 (Good)
12 (Good)
15 (Good)
12 (Good)
11 (Good)
8.3 (Good)
22 (Good)
28 (Good)
26 (Good)
22 (Good)
18 (Good)
33 (Good)
18 (Good)
28 (Good)
13 (Good)
23 (Good)
18 (Good)
- (Good)
- (Good)
- (Good)
- (Good)
- (Good)
- (Good)
- (Good)
- (Good)
- (Good)
- (Good)
- (Good)
- (Good)
data source »
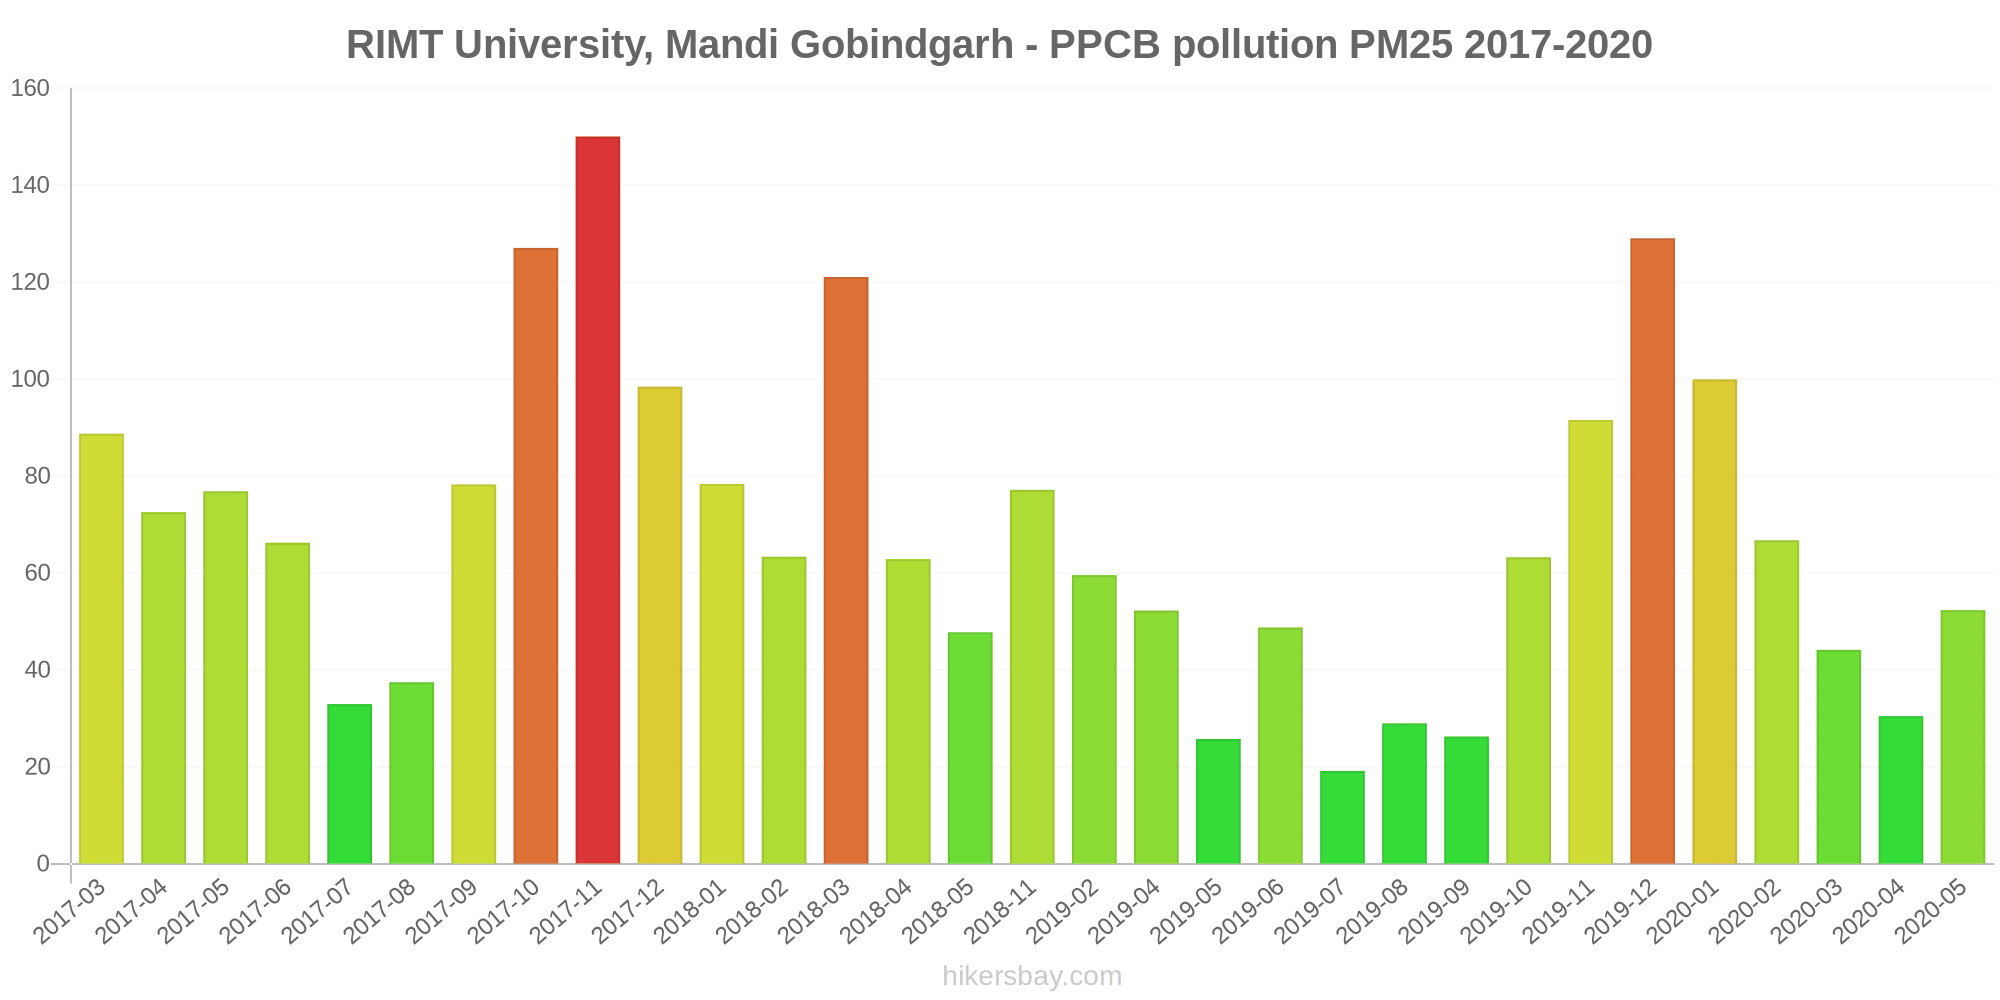
RIMT University, Mandi Gobindgarh - PPCB
Monday, October 31, 2022, 2:00 AM
PM2,5 60 (Unhealthy)
particulate matter (PM2.5) dust
PM10 142 (Very Unhealthy)
particulate matter (PM10) suspended dust
NO2 20 (Good)
nitrogen dioxide (NO2)
SO2 14 (Good)
sulfur dioxide (SO2)
CO 660 (Good)
carbon monoxide (CO)
O3 68 (Good)
ozone (O3)
RIMT University, Mandi Gobindgarh - PPCB
index
2022-10-31
pm25
60
pm10
142
no2
20
so2
14
co
660
o3
68
RIMT University, Mandi Gobindgarh - PPCB
2017-03 2020-05

index
2020-05
2020-04
2020-03
2020-02
2020-01
2019-12
2019-11
2019-10
2019-09
2019-08
2019-07
2019-06
2019-05
2019-04
2019-02
2018-11
2018-10
2018-09
2018-08
2018-05
2018-04
2018-03
2018-02
2018-01
2017-12
2017-11
2017-10
2017-09
2017-08
2017-07
2017-06
2017-05
2017-04
2017-03
pm25
52
30
44
67
100
129
92
63
26
29
19
49
26
52
60
77
-
-
-
48
63
121
63
78
98
150
127
78
37
33
66
77
73
89
no2
8.3
10
12
14
16
13
26
15
-
10
11
11
11
11
-
18
16
14
25
39
17
31
45
26
60
103
37
11
11
12
36
11
32
35
co
798
298
341
426
513
609
677
549
670
628
759
755
392
408
556
665
1
552
479
1
27
68
1
1
1
966
793
871
525
813
783
542
662
522
pm10
129
64
81
151
153
167
191
121
61
55
60
152
80
163
142
129
124
57
64
107
117
109
100
131
160
276
236
155
100
125
173
212
193
202
so2
22
4.5
13
48
28
11
24
11
11
9.1
3
9.7
7.2
9.6
11
12
11
10
37
21
16
21
8.3
13
9.6
8.4
7.8
16
4.2
12
29
22
13
12
o3
20
18
15
17
10
10
12
15
12
11
8.3
22
28
26
22
18
33
18
28
13
23
18
-
-
-
-
-
-
-
-
-
-
-
-
* Pollution data source:
https://openaq.org
(caaqm)
The data is licensed under CC-By 4.0
PM2,5 60 (Unhealthy)
PM10 142 (Very Unhealthy)
NO2 20 (Good)
SO2 14 (Good)
CO 660 (Good)
O3 68 (Good)
Data on air pollution from recent days in Fatehgarh Sahib
| index | 2022-10-31 |
|---|---|
| pm25 | 60 Unhealthy |
| pm10 | 142 Very Unhealthy |
| no2 | 20 Good |
| so2 | 14 Good |
| co | 660 Good |
| o3 | 68 Good |
| index | 2020-05 | 2020-04 | 2020-03 | 2020-02 | 2020-01 | 2019-12 | 2019-11 | 2019-10 | 2019-09 | 2019-08 | 2019-07 | 2019-06 | 2019-05 | 2019-04 | 2019-02 | 2018-11 | 2018-10 | 2018-09 | 2018-08 | 2018-05 | 2018-04 | 2018-03 | 2018-02 | 2018-01 | 2017-12 | 2017-11 | 2017-10 | 2017-09 | 2017-08 | 2017-07 | 2017-06 | 2017-05 | 2017-04 | 2017-03 |
|---|---|---|---|---|---|---|---|---|---|---|---|---|---|---|---|---|---|---|---|---|---|---|---|---|---|---|---|---|---|---|---|---|---|---|
| pm25 | 52 (Unhealthy for Sensitive Groups) | 30 (Moderate) | 44 (Unhealthy for Sensitive Groups) | 67 (Unhealthy) | 100 (Very Unhealthy) | 129 (Very bad Hazardous) | 92 (Very Unhealthy) | 63 (Unhealthy) | 26 (Moderate) | 29 (Moderate) | 19 (Moderate) | 49 (Unhealthy for Sensitive Groups) | 26 (Moderate) | 52 (Unhealthy for Sensitive Groups) | 60 (Unhealthy) | 77 (Very Unhealthy) | - (Good) | - (Good) | - (Good) | 48 (Unhealthy for Sensitive Groups) | 63 (Unhealthy) | 121 (Very bad Hazardous) | 63 (Unhealthy) | 78 (Very Unhealthy) | 98 (Very Unhealthy) | 150 (Very bad Hazardous) | 127 (Very bad Hazardous) | 78 (Very Unhealthy) | 37 (Unhealthy for Sensitive Groups) | 33 (Moderate) | 66 (Unhealthy) | 77 (Very Unhealthy) | 73 (Unhealthy) | 89 (Very Unhealthy) |
| pm10 | 129 (Very Unhealthy) | 64 (Unhealthy for Sensitive Groups) | 81 (Unhealthy) | 151 (Very bad Hazardous) | 153 (Very bad Hazardous) | 167 (Very bad Hazardous) | 191 (Very bad Hazardous) | 121 (Very Unhealthy) | 61 (Unhealthy for Sensitive Groups) | 55 (Unhealthy for Sensitive Groups) | 60 (Unhealthy for Sensitive Groups) | 152 (Very bad Hazardous) | 80 (Unhealthy) | 163 (Very bad Hazardous) | 142 (Very Unhealthy) | 129 (Very Unhealthy) | 124 (Very Unhealthy) | 57 (Unhealthy for Sensitive Groups) | 64 (Unhealthy for Sensitive Groups) | 107 (Unhealthy) | 117 (Very Unhealthy) | 109 (Unhealthy) | 100 (Unhealthy) | 131 (Very Unhealthy) | 160 (Very bad Hazardous) | 276 (Very bad Hazardous) | 236 (Very bad Hazardous) | 155 (Very bad Hazardous) | 100 (Unhealthy) | 125 (Very Unhealthy) | 173 (Very bad Hazardous) | 212 (Very bad Hazardous) | 193 (Very bad Hazardous) | 202 (Very bad Hazardous) |
| no2 | 8.3 (Good) | 10 (Good) | 12 (Good) | 14 (Good) | 16 (Good) | 13 (Good) | 26 (Good) | 15 (Good) | - (Good) | 10 (Good) | 11 (Good) | 11 (Good) | 11 (Good) | 11 (Good) | - (Good) | 18 (Good) | 16 (Good) | 14 (Good) | 25 (Good) | 39 (Good) | 17 (Good) | 31 (Good) | 45 (Moderate) | 26 (Good) | 60 (Moderate) | 103 (Unhealthy for Sensitive Groups) | 37 (Good) | 11 (Good) | 11 (Good) | 12 (Good) | 36 (Good) | 11 (Good) | 32 (Good) | 35 (Good) |
| so2 | 22 (Good) | 4.5 (Good) | 13 (Good) | 48 (Good) | 28 (Good) | 11 (Good) | 24 (Good) | 11 (Good) | 11 (Good) | 9.1 (Good) | 3 (Good) | 9.7 (Good) | 7.2 (Good) | 9.6 (Good) | 11 (Good) | 12 (Good) | 11 (Good) | 10 (Good) | 37 (Good) | 21 (Good) | 16 (Good) | 21 (Good) | 8.3 (Good) | 13 (Good) | 9.6 (Good) | 8.4 (Good) | 7.8 (Good) | 16 (Good) | 4.2 (Good) | 12 (Good) | 29 (Good) | 22 (Good) | 13 (Good) | 12 (Good) |
| co | 798 (Good) | 298 (Good) | 341 (Good) | 426 (Good) | 513 (Good) | 609 (Good) | 677 (Good) | 549 (Good) | 670 (Good) | 628 (Good) | 759 (Good) | 755 (Good) | 392 (Good) | 408 (Good) | 556 (Good) | 665 (Good) | 1 (Good) | 552 (Good) | 479 (Good) | 1 (Good) | 27 (Good) | 68 (Good) | 1 (Good) | 1 (Good) | 1 (Good) | 966 (Good) | 793 (Good) | 871 (Good) | 525 (Good) | 813 (Good) | 783 (Good) | 542 (Good) | 662 (Good) | 522 (Good) |
| o3 | 20 (Good) | 18 (Good) | 15 (Good) | 17 (Good) | 10 (Good) | 10 (Good) | 12 (Good) | 15 (Good) | 12 (Good) | 11 (Good) | 8.3 (Good) | 22 (Good) | 28 (Good) | 26 (Good) | 22 (Good) | 18 (Good) | 33 (Good) | 18 (Good) | 28 (Good) | 13 (Good) | 23 (Good) | 18 (Good) | - (Good) | - (Good) | - (Good) | - (Good) | - (Good) | - (Good) | - (Good) | - (Good) | - (Good) | - (Good) | - (Good) | - (Good) |
PM2,5 60 (Unhealthy)
particulate matter (PM2.5) dustPM10 142 (Very Unhealthy)
particulate matter (PM10) suspended dustNO2 20 (Good)
nitrogen dioxide (NO2)SO2 14 (Good)
sulfur dioxide (SO2)CO 660 (Good)
carbon monoxide (CO)O3 68 (Good)
ozone (O3)RIMT University, Mandi Gobindgarh - PPCB
| index | 2022-10-31 |
|---|---|
| pm25 | 60 |
| pm10 | 142 |
| no2 | 20 |
| so2 | 14 |
| co | 660 |
| o3 | 68 |
RIMT University, Mandi Gobindgarh - PPCB
| index | 2020-05 | 2020-04 | 2020-03 | 2020-02 | 2020-01 | 2019-12 | 2019-11 | 2019-10 | 2019-09 | 2019-08 | 2019-07 | 2019-06 | 2019-05 | 2019-04 | 2019-02 | 2018-11 | 2018-10 | 2018-09 | 2018-08 | 2018-05 | 2018-04 | 2018-03 | 2018-02 | 2018-01 | 2017-12 | 2017-11 | 2017-10 | 2017-09 | 2017-08 | 2017-07 | 2017-06 | 2017-05 | 2017-04 | 2017-03 |
|---|---|---|---|---|---|---|---|---|---|---|---|---|---|---|---|---|---|---|---|---|---|---|---|---|---|---|---|---|---|---|---|---|---|---|
| pm25 | 52 | 30 | 44 | 67 | 100 | 129 | 92 | 63 | 26 | 29 | 19 | 49 | 26 | 52 | 60 | 77 | - | - | - | 48 | 63 | 121 | 63 | 78 | 98 | 150 | 127 | 78 | 37 | 33 | 66 | 77 | 73 | 89 |
| no2 | 8.3 | 10 | 12 | 14 | 16 | 13 | 26 | 15 | - | 10 | 11 | 11 | 11 | 11 | - | 18 | 16 | 14 | 25 | 39 | 17 | 31 | 45 | 26 | 60 | 103 | 37 | 11 | 11 | 12 | 36 | 11 | 32 | 35 |
| co | 798 | 298 | 341 | 426 | 513 | 609 | 677 | 549 | 670 | 628 | 759 | 755 | 392 | 408 | 556 | 665 | 1 | 552 | 479 | 1 | 27 | 68 | 1 | 1 | 1 | 966 | 793 | 871 | 525 | 813 | 783 | 542 | 662 | 522 |
| pm10 | 129 | 64 | 81 | 151 | 153 | 167 | 191 | 121 | 61 | 55 | 60 | 152 | 80 | 163 | 142 | 129 | 124 | 57 | 64 | 107 | 117 | 109 | 100 | 131 | 160 | 276 | 236 | 155 | 100 | 125 | 173 | 212 | 193 | 202 |
| so2 | 22 | 4.5 | 13 | 48 | 28 | 11 | 24 | 11 | 11 | 9.1 | 3 | 9.7 | 7.2 | 9.6 | 11 | 12 | 11 | 10 | 37 | 21 | 16 | 21 | 8.3 | 13 | 9.6 | 8.4 | 7.8 | 16 | 4.2 | 12 | 29 | 22 | 13 | 12 |
| o3 | 20 | 18 | 15 | 17 | 10 | 10 | 12 | 15 | 12 | 11 | 8.3 | 22 | 28 | 26 | 22 | 18 | 33 | 18 | 28 | 13 | 23 | 18 | - | - | - | - | - | - | - | - | - | - | - | - |