Air Pollution in Andheri East: Real-time Air Quality Index and smog alert.
Pollution and air quality forecast for Andheri East. Today is Wednesday, May 13, 2026. The following air pollution values have been recorded for Andheri East:- particulate matter (PM2.5) dust - 44 (Unhealthy for Sensitive Groups)
- particulate matter (PM10) suspended dust - 184 (Very bad Hazardous)
- nitrogen dioxide (NO2) - 16 (Good)
- sulfur dioxide (SO2) - 7 (Good)
- carbon monoxide (CO) - 830 (Good)
- ozone (O3) - 30 (Good)

What is the air quality in Andheri East today? Is the air polluted in Andheri East?. Is there smog?
What is the current level of PM2.5 in Andheri East? (particulate matter (PM2.5) dust)
Today's PM2.5 level is:
44 (Unhealthy for Sensitive Groups)
For comparison, the highest level of PM2.5 in Andheri East in the last 7 days was: 44 (Monday, October 31, 2022) and the lowest: 44 (Monday, October 31, 2022).
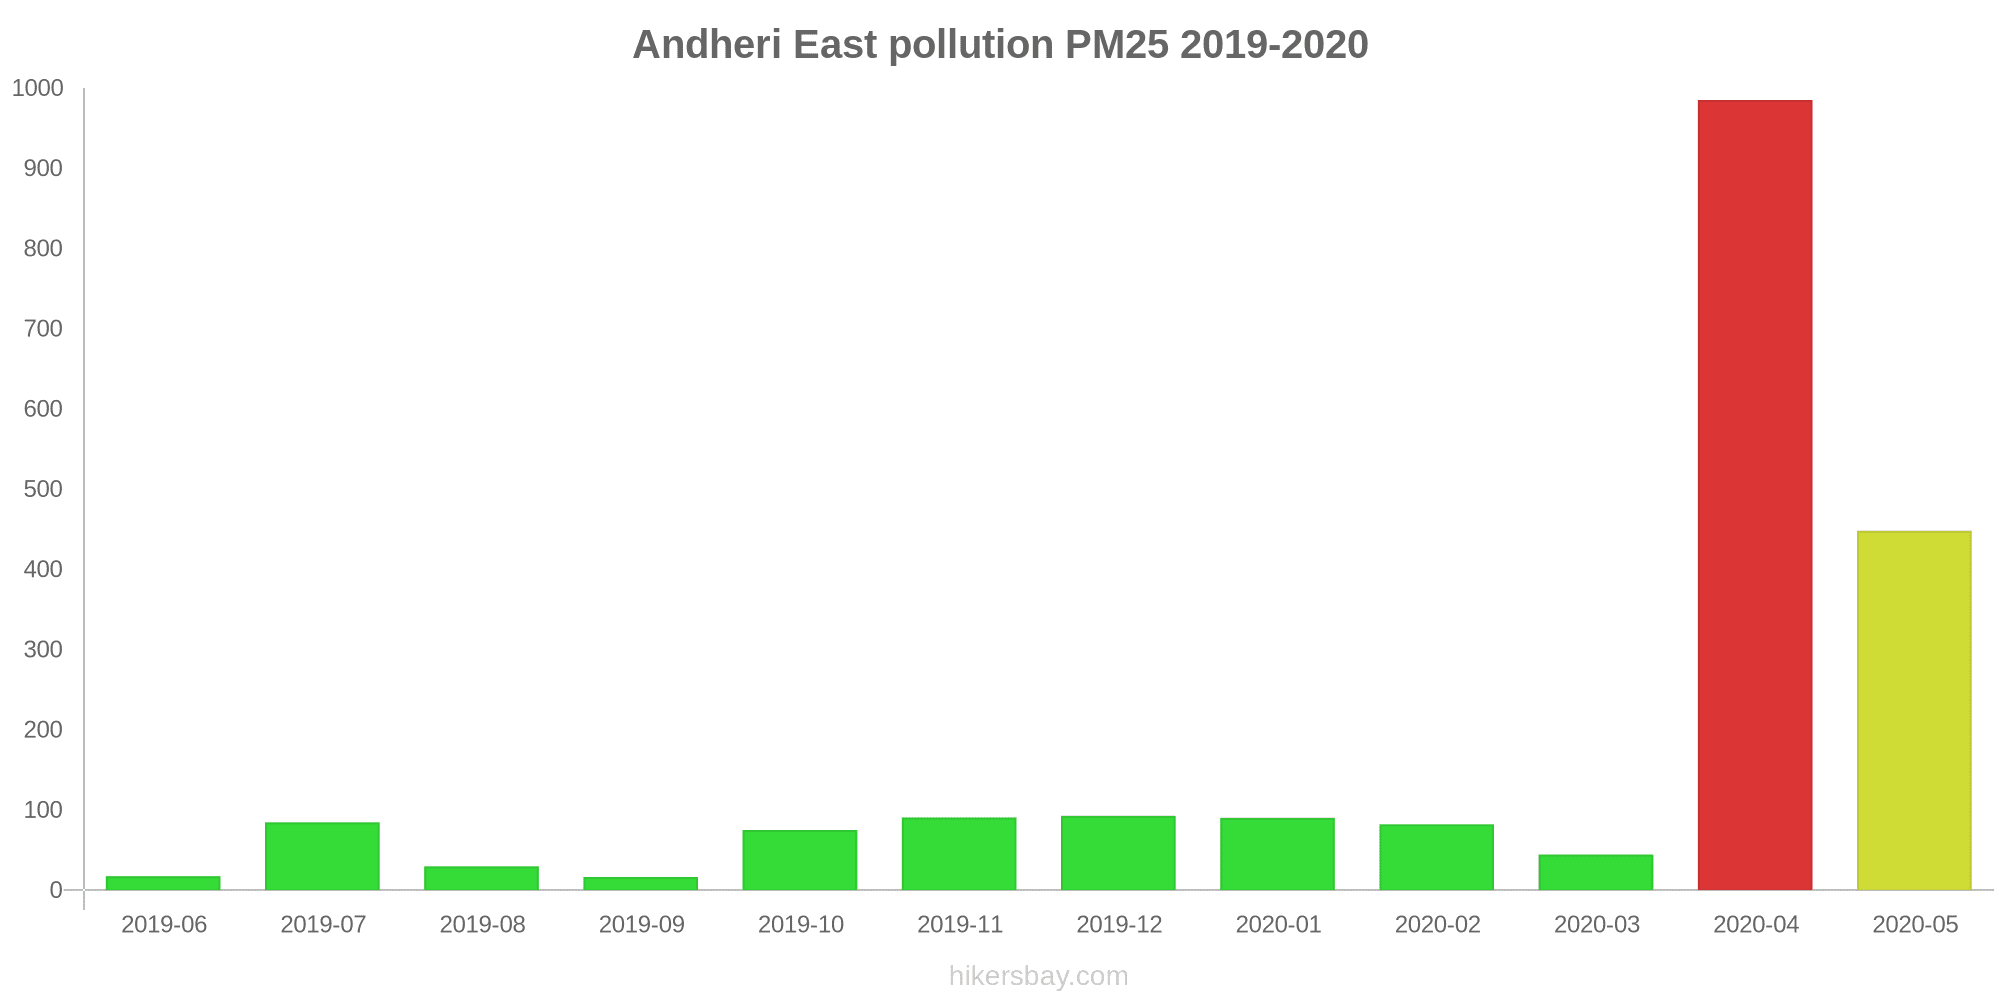
The highest PM2.5 values were recorded: 985 (April 2020).
The lowest level of particulate matter PM2.5 pollution occurs in month: September (16).
What is the level of PM10 today in Andheri East? (particulate matter (PM10) suspended dust)
The current level of particulate matter PM10 in Andheri East is:
184 (Very bad Hazardous)
The highest PM10 values usually occur in month: 236 (February 2020).
The lowest value of particulate matter PM10 pollution in Andheri East is usually recorded in: May (27).
How high is the level of NO2? (nitrogen dioxide (NO2))
16 (Good)
What is the level of SO2 pollution? (sulfur dioxide (SO2))
7 (Good)
How high is the CO level? (carbon monoxide (CO))
830 (Good)
How is the O3 level today in Andheri East? (ozone (O3))
30 (Good)
Current data Monday, October 31, 2022, 1:45 AM
PM2,5 44 (Unhealthy for Sensitive Groups)
PM10 184 (Very bad Hazardous)
NO2 16 (Good)
SO2 7 (Good)
CO 830 (Good)
O3 30 (Good)
Data on air pollution from recent days in Andheri East
index
2022-10-31
pm25
44
Unhealthy for Sensitive Groups
pm10
184
Very bad Hazardous
no2
16
Good
so2
7
Good
co
830
Good
o3
30
Good
data source »
Air pollution in Andheri East from June 2019 to May 2020

index
2020-05
2020-04
2020-03
2020-02
2020-01
2019-12
2019-11
2019-10
2019-09
2019-08
2019-07
2019-06
pm25
448 (Very bad Hazardous)
985 (Very bad Hazardous)
44 (Unhealthy for Sensitive Groups)
82 (Very Unhealthy)
90 (Very Unhealthy)
93 (Very Unhealthy)
91 (Very Unhealthy)
75 (Unhealthy)
16 (Moderate)
30 (Moderate)
85 (Very Unhealthy)
17 (Moderate)
pm10
27 (Moderate)
57 (Unhealthy for Sensitive Groups)
132 (Very Unhealthy)
236 (Very bad Hazardous)
209 (Very bad Hazardous)
189 (Very bad Hazardous)
184 (Very bad Hazardous)
104 (Unhealthy)
45 (Moderate)
109 (Unhealthy)
49 (Moderate)
62 (Unhealthy for Sensitive Groups)
no2
11 (Good)
7.5 (Good)
34 (Good)
63 (Moderate)
43 (Moderate)
42 (Moderate)
88 (Moderate)
27 (Good)
25 (Good)
12 (Good)
18 (Good)
23 (Good)
so2
2.1 (Good)
1.7 (Good)
4 (Good)
13 (Good)
9.9 (Good)
11 (Good)
11 (Good)
5.4 (Good)
6.1 (Good)
8.1 (Good)
12 (Good)
9 (Good)
co
198 (Good)
261 (Good)
659 (Good)
1 (Good)
1 (Good)
1 (Good)
1 (Good)
889 (Good)
693 (Good)
483 (Good)
467 (Good)
440 (Good)
o3
6.5 (Good)
7 (Good)
18 (Good)
24 (Good)
16 (Good)
21 (Good)
43 (Good)
17 (Good)
12 (Good)
8.3 (Good)
8.6 (Good)
9.4 (Good)
data source »
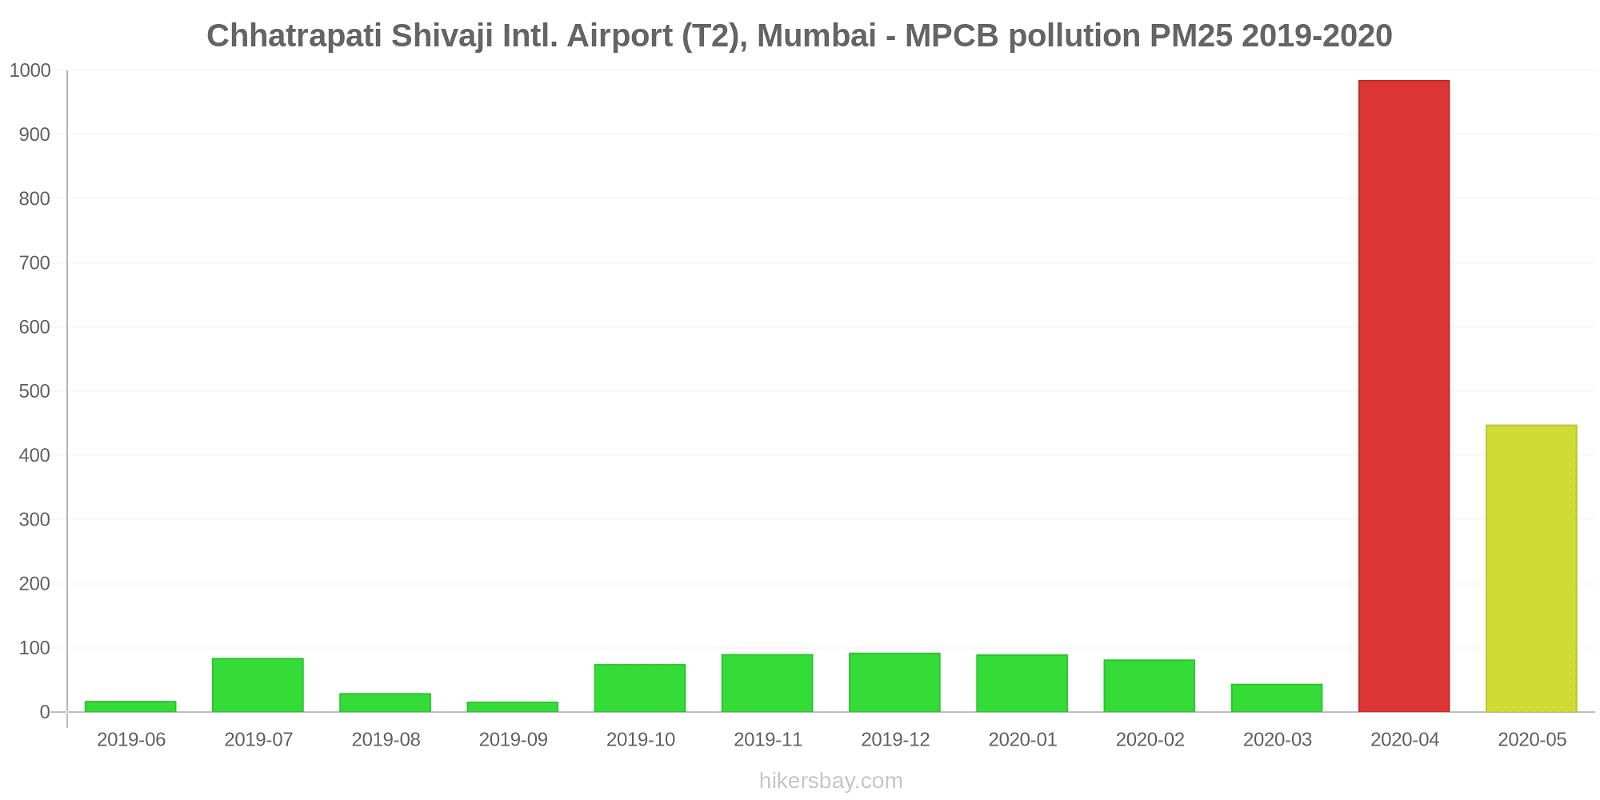
Chhatrapati Shivaji Intl. Airport (T2), Mumbai - MPCB
Monday, October 31, 2022, 1:45 AM
PM2,5 44 (Unhealthy for Sensitive Groups)
particulate matter (PM2.5) dust
PM10 184 (Very bad Hazardous)
particulate matter (PM10) suspended dust
NO2 16 (Good)
nitrogen dioxide (NO2)
SO2 6.5 (Good)
sulfur dioxide (SO2)
CO 830 (Good)
carbon monoxide (CO)
O3 30 (Good)
ozone (O3)
Chhatrapati Shivaji Intl. Airport (T2), Mumbai - MPCB
index
2022-10-31
pm25
44
pm10
184
no2
16
so2
6.5
co
830
o3
30
Chhatrapati Shivaji Intl. Airport (T2), Mumbai - MPCB
2019-06 2020-05
index
2020-05
2020-04
2020-03
2020-02
2020-01
2019-12
2019-11
2019-10
2019-09
2019-08
2019-07
2019-06
pm25
448
985
44
82
90
93
91
75
16
30
85
17
pm10
27
57
132
236
209
189
184
104
45
109
49
62
no2
11
7.5
34
63
43
42
88
27
25
12
18
23
so2
2.1
1.7
4
13
9.9
11
11
5.4
6.1
8.1
12
9
co
198
261
659
1
1
1
1
889
693
483
467
440
o3
6.5
7
18
24
16
21
43
17
12
8.3
8.6
9.4
* Pollution data source:
https://openaq.org
(caaqm)
The data is licensed under CC-By 4.0
PM2,5 44 (Unhealthy for Sensitive Groups)
PM10 184 (Very bad Hazardous)
NO2 16 (Good)
SO2 7 (Good)
CO 830 (Good)
O3 30 (Good)
Data on air pollution from recent days in Andheri East
| index | 2022-10-31 |
|---|---|
| pm25 | 44 Unhealthy for Sensitive Groups |
| pm10 | 184 Very bad Hazardous |
| no2 | 16 Good |
| so2 | 7 Good |
| co | 830 Good |
| o3 | 30 Good |
| index | 2020-05 | 2020-04 | 2020-03 | 2020-02 | 2020-01 | 2019-12 | 2019-11 | 2019-10 | 2019-09 | 2019-08 | 2019-07 | 2019-06 |
|---|---|---|---|---|---|---|---|---|---|---|---|---|
| pm25 | 448 (Very bad Hazardous) | 985 (Very bad Hazardous) | 44 (Unhealthy for Sensitive Groups) | 82 (Very Unhealthy) | 90 (Very Unhealthy) | 93 (Very Unhealthy) | 91 (Very Unhealthy) | 75 (Unhealthy) | 16 (Moderate) | 30 (Moderate) | 85 (Very Unhealthy) | 17 (Moderate) |
| pm10 | 27 (Moderate) | 57 (Unhealthy for Sensitive Groups) | 132 (Very Unhealthy) | 236 (Very bad Hazardous) | 209 (Very bad Hazardous) | 189 (Very bad Hazardous) | 184 (Very bad Hazardous) | 104 (Unhealthy) | 45 (Moderate) | 109 (Unhealthy) | 49 (Moderate) | 62 (Unhealthy for Sensitive Groups) |
| no2 | 11 (Good) | 7.5 (Good) | 34 (Good) | 63 (Moderate) | 43 (Moderate) | 42 (Moderate) | 88 (Moderate) | 27 (Good) | 25 (Good) | 12 (Good) | 18 (Good) | 23 (Good) |
| so2 | 2.1 (Good) | 1.7 (Good) | 4 (Good) | 13 (Good) | 9.9 (Good) | 11 (Good) | 11 (Good) | 5.4 (Good) | 6.1 (Good) | 8.1 (Good) | 12 (Good) | 9 (Good) |
| co | 198 (Good) | 261 (Good) | 659 (Good) | 1 (Good) | 1 (Good) | 1 (Good) | 1 (Good) | 889 (Good) | 693 (Good) | 483 (Good) | 467 (Good) | 440 (Good) |
| o3 | 6.5 (Good) | 7 (Good) | 18 (Good) | 24 (Good) | 16 (Good) | 21 (Good) | 43 (Good) | 17 (Good) | 12 (Good) | 8.3 (Good) | 8.6 (Good) | 9.4 (Good) |
PM2,5 44 (Unhealthy for Sensitive Groups)
particulate matter (PM2.5) dustPM10 184 (Very bad Hazardous)
particulate matter (PM10) suspended dustNO2 16 (Good)
nitrogen dioxide (NO2)SO2 6.5 (Good)
sulfur dioxide (SO2)CO 830 (Good)
carbon monoxide (CO)O3 30 (Good)
ozone (O3)Chhatrapati Shivaji Intl. Airport (T2), Mumbai - MPCB
| index | 2022-10-31 |
|---|---|
| pm25 | 44 |
| pm10 | 184 |
| no2 | 16 |
| so2 | 6.5 |
| co | 830 |
| o3 | 30 |
Chhatrapati Shivaji Intl. Airport (T2), Mumbai - MPCB

| index | 2020-05 | 2020-04 | 2020-03 | 2020-02 | 2020-01 | 2019-12 | 2019-11 | 2019-10 | 2019-09 | 2019-08 | 2019-07 | 2019-06 |
|---|---|---|---|---|---|---|---|---|---|---|---|---|
| pm25 | 448 | 985 | 44 | 82 | 90 | 93 | 91 | 75 | 16 | 30 | 85 | 17 |
| pm10 | 27 | 57 | 132 | 236 | 209 | 189 | 184 | 104 | 45 | 109 | 49 | 62 |
| no2 | 11 | 7.5 | 34 | 63 | 43 | 42 | 88 | 27 | 25 | 12 | 18 | 23 |
| so2 | 2.1 | 1.7 | 4 | 13 | 9.9 | 11 | 11 | 5.4 | 6.1 | 8.1 | 12 | 9 |
| co | 198 | 261 | 659 | 1 | 1 | 1 | 1 | 889 | 693 | 483 | 467 | 440 |
| o3 | 6.5 | 7 | 18 | 24 | 16 | 21 | 43 | 17 | 12 | 8.3 | 8.6 | 9.4 |