Air Pollution in Ranga Reddy: Real-time Air Quality Index and smog alert.
Pollution and air quality forecast for Ranga Reddy. Today is Wednesday, May 13, 2026. The following air pollution values have been recorded for Ranga Reddy:- carbon monoxide (CO) - 1500 (Good)
- particulate matter (PM2.5) dust - 96 (Very Unhealthy)
- sulfur dioxide (SO2) - 11 (Good)
- particulate matter (PM10) suspended dust - 144 (Very Unhealthy)
- ozone (O3) - 14 (Good)
- nitrogen dioxide (NO2) - 41 (Moderate)

What is the air quality in Ranga Reddy today? Is the air polluted in Ranga Reddy?. Is there smog?
How high is the CO level? (carbon monoxide (CO))
1500 (Good)
What is the current level of PM2.5 in Ranga Reddy? (particulate matter (PM2.5) dust)
Today's PM2.5 level is:
96 (Very Unhealthy)
For comparison, the highest level of PM2.5 in Ranga Reddy in the last 7 days was: 88 (Monday, October 31, 2022) and the lowest: 88 (Monday, October 31, 2022).
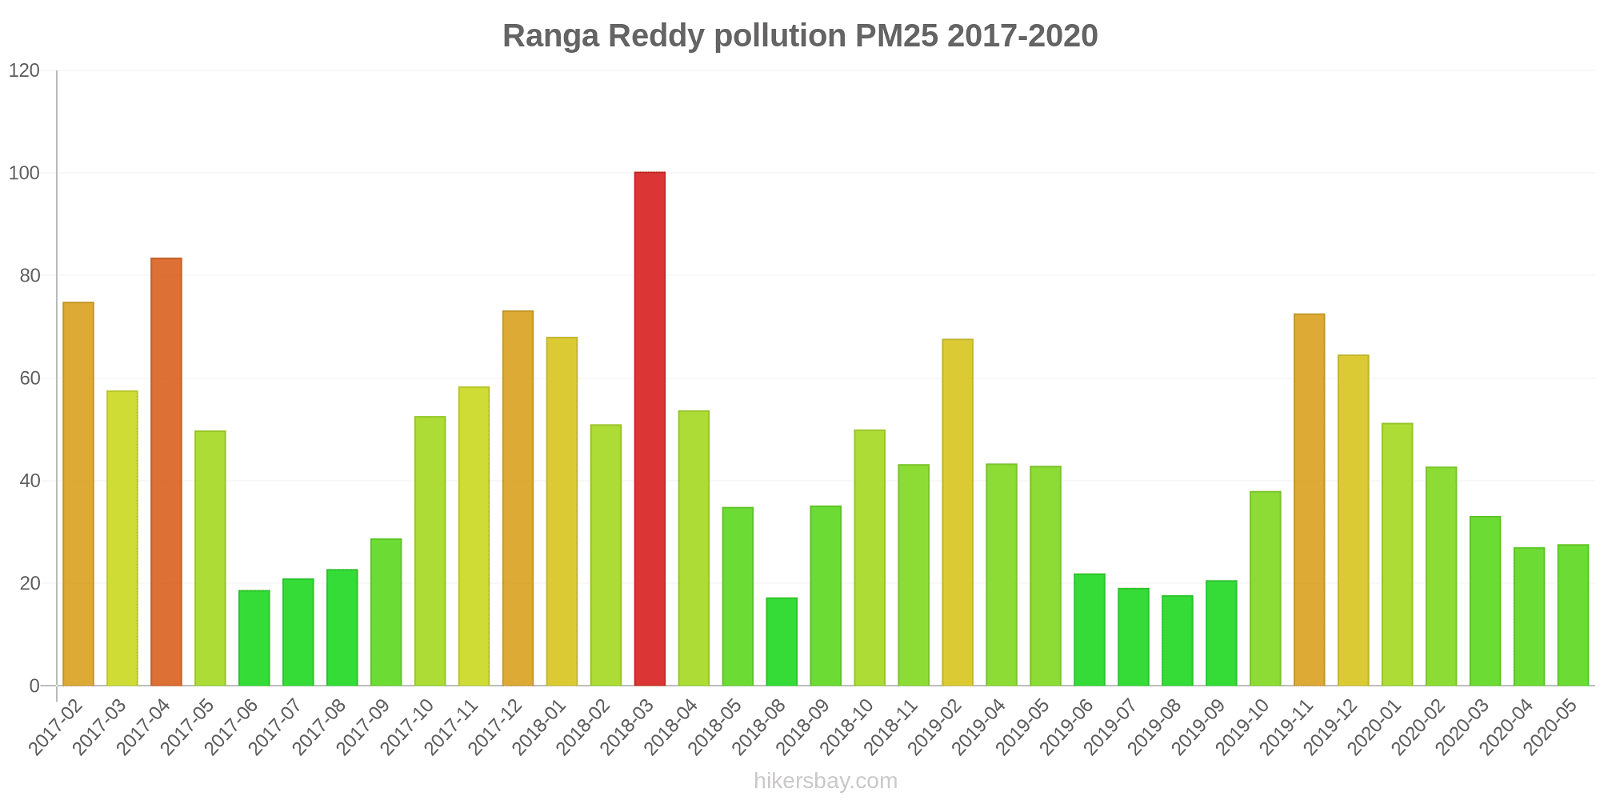
The highest PM2.5 values were recorded: 100 (March 2018).
The lowest level of particulate matter PM2.5 pollution occurs in month: August (17).
What is the level of SO2 pollution? (sulfur dioxide (SO2))
11 (Good)
What is the level of PM10 today in Ranga Reddy? (particulate matter (PM10) suspended dust)
The current level of particulate matter PM10 in Ranga Reddy is:
144 (Very Unhealthy)
The highest PM10 values usually occur in month: 200 (April 2017).
The lowest value of particulate matter PM10 pollution in Ranga Reddy is usually recorded in: September (45).
How is the O3 level today in Ranga Reddy? (ozone (O3))
14 (Good)
How high is the level of NO2? (nitrogen dioxide (NO2))
41 (Moderate)
Current data Monday, October 31, 2022, 2:00 AM
CO 1500 (Good)
PM2,5 96 (Very Unhealthy)
SO2 11 (Good)
PM10 144 (Very Unhealthy)
O3 14 (Good)
NO2 41 (Moderate)
Data on air pollution from recent days in Ranga Reddy
index
2022-10-31
co
1273
Good
pm25
88
Very Unhealthy
so2
7
Good
pm10
137
Very Unhealthy
o3
15
Good
no2
40
Moderate
data source »
Air pollution in Ranga Reddy from February 2017 to May 2020
index
2020-05
2020-04
2020-03
2020-02
2020-01
2019-12
2019-11
2019-10
2019-09
2019-08
2019-07
2019-06
2019-05
2019-04
2019-02
2018-11
2018-10
2018-09
2018-08
2018-05
2018-04
2018-03
2018-02
2018-01
2017-12
2017-11
2017-10
2017-09
2017-08
2017-07
2017-06
2017-05
2017-04
2017-03
2017-02
pm25
28 (Moderate)
27 (Moderate)
33 (Moderate)
43 (Unhealthy for Sensitive Groups)
51 (Unhealthy for Sensitive Groups)
65 (Unhealthy)
73 (Unhealthy)
38 (Unhealthy for Sensitive Groups)
21 (Moderate)
18 (Moderate)
19 (Moderate)
22 (Moderate)
43 (Unhealthy for Sensitive Groups)
43 (Unhealthy for Sensitive Groups)
68 (Unhealthy)
43 (Unhealthy for Sensitive Groups)
50 (Unhealthy for Sensitive Groups)
35 (Unhealthy for Sensitive Groups)
17 (Moderate)
35 (Moderate)
54 (Unhealthy for Sensitive Groups)
100 (Very Unhealthy)
51 (Unhealthy for Sensitive Groups)
68 (Unhealthy)
73 (Unhealthy)
58 (Unhealthy)
53 (Unhealthy for Sensitive Groups)
29 (Moderate)
23 (Moderate)
21 (Moderate)
19 (Moderate)
50 (Unhealthy for Sensitive Groups)
84 (Very Unhealthy)
58 (Unhealthy)
75 (Unhealthy)
pm10
64 (Unhealthy for Sensitive Groups)
55 (Unhealthy for Sensitive Groups)
76 (Unhealthy for Sensitive Groups)
96 (Unhealthy)
100 (Unhealthy)
114 (Very Unhealthy)
133 (Very Unhealthy)
66 (Unhealthy for Sensitive Groups)
45 (Moderate)
55 (Unhealthy for Sensitive Groups)
49 (Moderate)
51 (Unhealthy for Sensitive Groups)
145 (Very Unhealthy)
117 (Very Unhealthy)
134 (Very Unhealthy)
92 (Unhealthy)
109 (Unhealthy)
82 (Unhealthy)
50 (Unhealthy for Sensitive Groups)
90 (Unhealthy)
97 (Unhealthy)
111 (Very Unhealthy)
114 (Very Unhealthy)
140 (Very Unhealthy)
129 (Very Unhealthy)
98 (Unhealthy)
102 (Unhealthy)
67 (Unhealthy for Sensitive Groups)
59 (Unhealthy for Sensitive Groups)
55 (Unhealthy for Sensitive Groups)
50 (Moderate)
124 (Very Unhealthy)
200 (Very bad Hazardous)
134 (Very Unhealthy)
167 (Very bad Hazardous)
no2
18 (Good)
21 (Good)
20 (Good)
33 (Good)
32 (Good)
37 (Good)
38 (Good)
27 (Good)
22 (Good)
20 (Good)
19 (Good)
19 (Good)
27 (Good)
30 (Good)
42 (Moderate)
33 (Good)
34 (Good)
25 (Good)
14 (Good)
29 (Good)
41 (Moderate)
52 (Moderate)
44 (Moderate)
49 (Moderate)
51 (Moderate)
39 (Good)
32 (Good)
18 (Good)
13 (Good)
14 (Good)
14 (Good)
22 (Good)
35 (Good)
27 (Good)
38 (Good)
so2
10 (Good)
8.9 (Good)
12 (Good)
14 (Good)
18 (Good)
18 (Good)
16 (Good)
15 (Good)
18 (Good)
21 (Good)
18 (Good)
8.4 (Good)
11 (Good)
10 (Good)
15 (Good)
20 (Good)
19 (Good)
17 (Good)
16 (Good)
20 (Good)
18 (Good)
12 (Good)
25 (Good)
25 (Good)
22 (Good)
18 (Good)
21 (Good)
19 (Good)
21 (Good)
23 (Good)
21 (Good)
38 (Good)
57 (Moderate)
33 (Good)
64 (Moderate)
co
397 (Good)
398 (Good)
438 (Good)
555 (Good)
656 (Good)
761 (Good)
647 (Good)
579 (Good)
472 (Good)
442 (Good)
418 (Good)
387 (Good)
542 (Good)
647 (Good)
646 (Good)
470 (Good)
345 (Good)
436 (Good)
251 (Good)
555 (Good)
12 (Good)
40 (Good)
430 (Good)
530 (Good)
567 (Good)
385 (Good)
523 (Good)
311 (Good)
340 (Good)
215 (Good)
211 (Good)
505 (Good)
898 (Good)
832 (Good)
1 (Good)
o3
36 (Good)
30 (Good)
31 (Good)
32 (Good)
32 (Good)
33 (Good)
40 (Good)
23 (Good)
17 (Good)
17 (Good)
35 (Good)
27 (Good)
38 (Good)
43 (Good)
33 (Good)
33 (Good)
36 (Good)
23 (Good)
15 (Good)
55 (Good)
44 (Good)
38 (Good)
46 (Good)
57 (Good)
54 (Good)
57 (Good)
41 (Good)
34 (Good)
26 (Good)
22 (Good)
20 (Good)
- (Good)
- (Good)
- (Good)
- (Good)
data source »
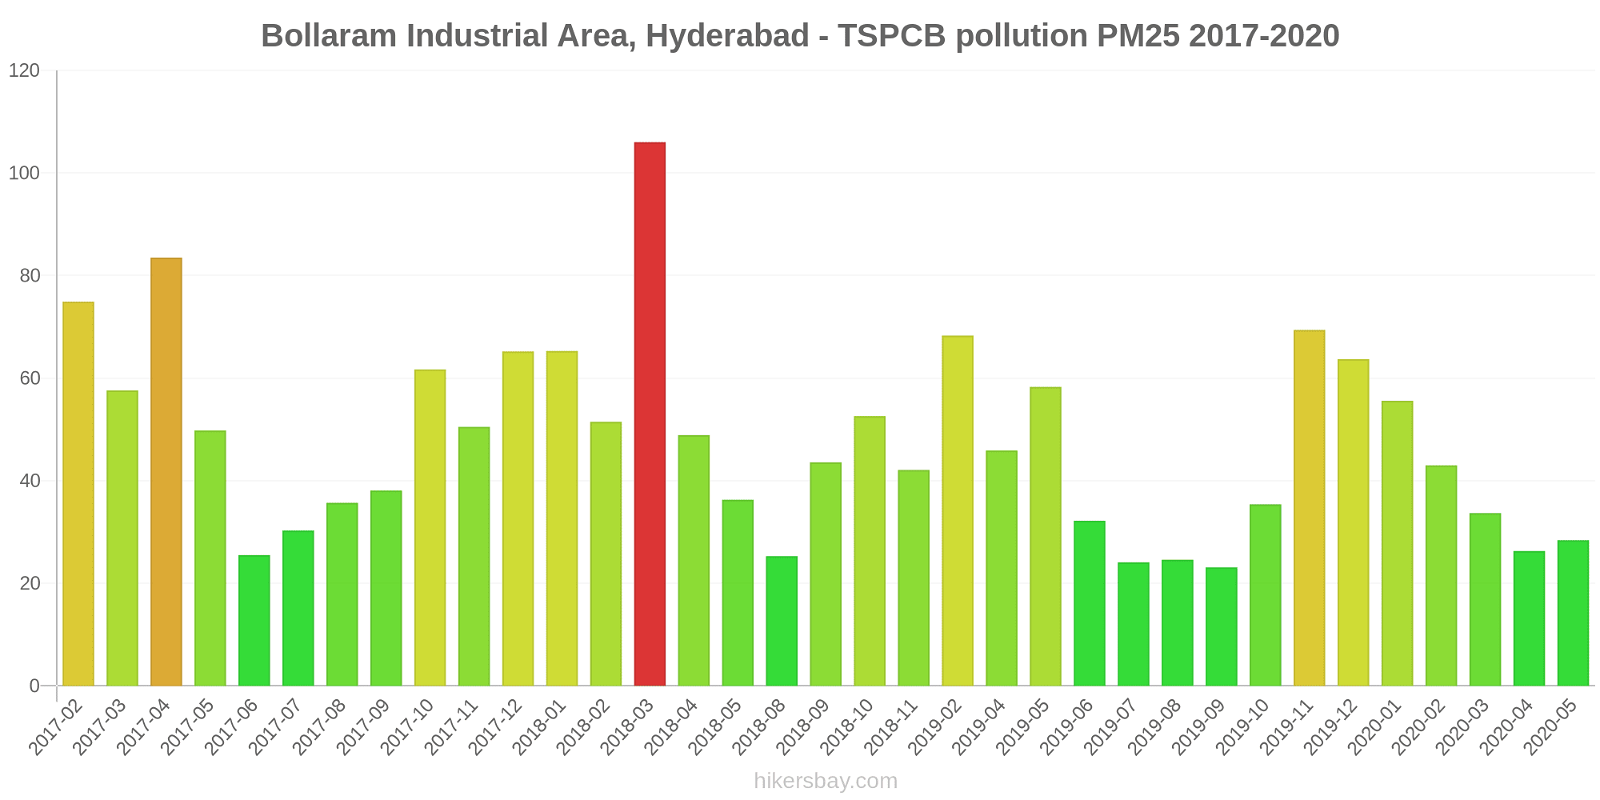
Bollaram Industrial Area, Hyderabad - TSPCB
Monday, October 31, 2022, 2:00 AM
CO 2670 (Moderate)
carbon monoxide (CO)
PM2,5 83 (Very Unhealthy)
particulate matter (PM2.5) dust
SO2 21 (Good)
sulfur dioxide (SO2)
PM10 135 (Very Unhealthy)
particulate matter (PM10) suspended dust
O3 0.7 (Good)
ozone (O3)
NO2 29 (Good)
nitrogen dioxide (NO2)
Central University, Hyderabad - TSPCB
Monday, October 31, 2022, 2:00 AM
PM10 152 (Very bad Hazardous)
particulate matter (PM10) suspended dust
SO2 8.5 (Good)
sulfur dioxide (SO2)
PM2,5 52 (Unhealthy for Sensitive Groups)
particulate matter (PM2.5) dust
CO 700 (Good)
carbon monoxide (CO)
NO2 59 (Moderate)
nitrogen dioxide (NO2)
O3 5.5 (Good)
ozone (O3)
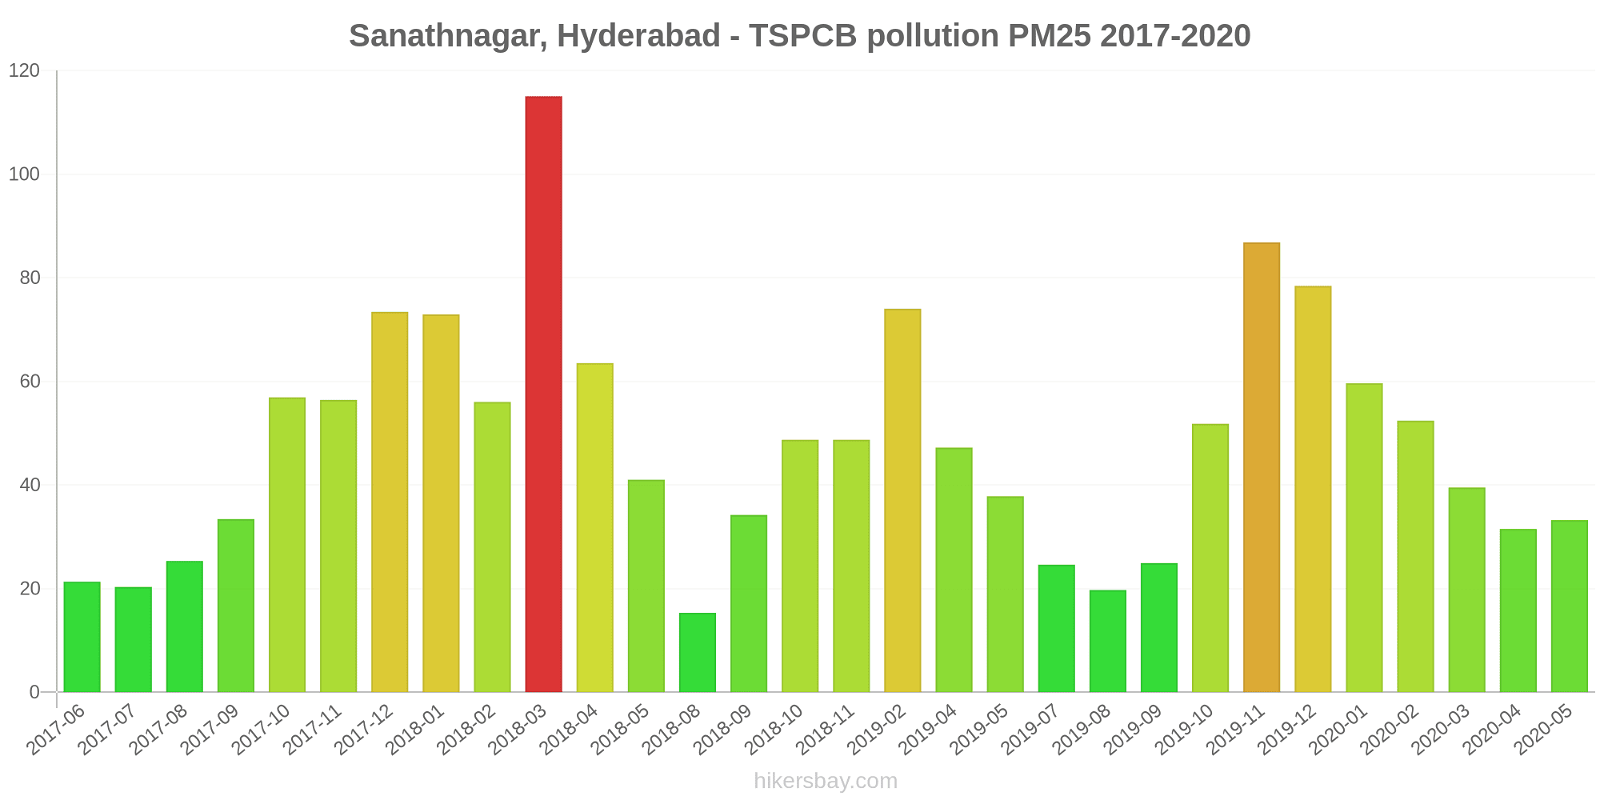
Sanathnagar - Hyderabad - TSPCB
Monday, October 31, 2022, 2:00 AM
O3 36 (Good)
ozone (O3)
PM2,5 152 (Very bad Hazardous)
particulate matter (PM2.5) dust
NO2 34 (Good)
nitrogen dioxide (NO2)
SO2 2.1 (Good)
sulfur dioxide (SO2)
CO 1130 (Good)
carbon monoxide (CO)
Bollaram Industrial Area, Hyderabad - TSPCB
index
2022-10-31
co
2095
pm25
82
so2
11
pm10
129
o3
4.8
no2
29
Central University, Hyderabad - TSPCB
index
2022-10-31
pm10
145
so2
8.6
pm25
50
co
615
no2
56
o3
2.8
Sanathnagar - Hyderabad - TSPCB
index
2022-10-31
o3
36
pm25
132
no2
35
so2
1.9
co
1110
Bollaram Industrial Area, Hyderabad - TSPCB
2017-02 2020-05
index
2020-05
2020-04
2020-03
2020-02
2020-01
2019-12
2019-11
2019-10
2019-09
2019-08
2019-07
2019-06
2019-05
2019-04
2019-02
2018-11
2018-10
2018-09
2018-08
2018-05
2018-04
2018-03
2018-02
2018-01
2017-12
2017-11
2017-10
2017-09
2017-08
2017-07
2017-06
2017-05
2017-04
2017-03
2017-02
pm25
28
26
34
43
56
64
69
35
23
25
24
32
58
46
68
42
53
44
25
36
49
106
52
65
65
51
62
38
36
30
26
50
84
58
75
co
363
329
372
419
496
576
604
517
449
347
302
389
651
550
666
452
442
426
285
413
6
37
637
743
736
514
802
413
545
246
276
505
898
832
1
so2
14
9
17
18
13
6.7
10
14
23
31
22
9
18
5.3
12
9.4
13
15
18
30
28
13
14
17
14
22
39
30
37
42
39
38
57
33
64
pm10
69
55
80
102
107
122
141
74
55
71
65
61
159
124
133
86
99
93
68
103
106
115
122
137
123
100
121
85
83
74
63
124
200
134
167
no2
18
16
22
27
29
34
34
24
23
31
27
26
33
27
24
18
19
17
13
24
30
38
35
35
36
27
28
19
15
17
19
22
35
27
38
o3
27
29
26
29
31
34
44
31
24
23
20
19
24
36
17
20
21
12
7.2
43
40
37
-
-
-
-
-
-
-
-
-
-
-
-
-
Central University, Hyderabad - TSPCB
2017-06 2020-05

index
2020-05
2020-04
2020-03
2020-02
2020-01
2019-12
2019-11
2019-10
2019-09
2019-08
2019-07
2019-06
2019-05
2019-04
2019-02
2018-11
2018-10
2018-09
2018-08
2018-05
2018-04
2018-03
2018-02
2018-01
2017-12
2017-11
2017-10
2017-09
2017-08
2017-07
2017-06
co
355
431
358
-
784
836
530
512
264
393
386
385
438
633
614
461
496
402
196
726
15
47
1
1
2
1
1
1
1
1
1
o3
38
21
35
34
30
31
33
18
14
17
75
35
55
56
54
47
48
31
24
75
57
55
63
75
68
64
49
46
37
25
22
no2
25
40
21
42
32
36
41
27
19
14
11
13
17
25
54
43
43
26
12
29
48
65
53
62
67
51
37
17
12
11
10
pm10
59
55
73
89
93
106
125
57
36
39
34
42
130
109
134
98
118
71
32
77
89
106
105
142
134
96
82
49
35
37
36
pm25
21
23
26
33
39
52
62
27
14
8.8
8.7
12
33
37
61
39
49
28
11
27
49
80
46
66
81
68
39
15
7.3
12
9.3
so2
16
12
11
11
12
23
11
11
13
10
12
7.8
5.1
15
13
19
16
12
9.2
8.7
8.6
9
32
28
25
27
16
22
20
23
18
Sanathnagar, Hyderabad - TSPCB
2017-06 2020-05
index
2020-05
2020-04
2020-03
2020-02
2020-01
2019-12
2019-11
2019-10
2019-09
2019-08
2019-07
2019-05
2019-04
2019-02
2018-11
2018-10
2018-09
2018-08
2018-05
2018-04
2018-03
2018-02
2018-01
2017-12
2017-11
2017-10
2017-09
2017-08
2017-07
2017-06
co
474
433
584
690
688
871
806
708
702
587
565
538
759
657
498
98
480
273
526
16
37
653
845
962
641
765
519
475
398
355
o3
43
42
34
34
36
35
43
19
14
10
11
35
38
29
32
38
26
15
46
35
22
30
39
40
51
34
22
14
19
19
so2
0.41
6
9.5
12
29
26
26
19
19
23
21
9.1
10
21
32
29
25
21
22
18
14
29
29
28
5.7
6.6
5.2
5.1
4.8
4.9
pm25
33
32
40
52
60
78
87
52
25
20
25
38
47
74
49
49
34
15
41
64
115
56
73
73
56
57
33
25
20
21
no2
9.8
6
15
29
36
41
39
31
23
15
20
30
37
47
39
39
31
17
34
45
53
-
-
-
-
-
-
-
-
-
* Pollution data source:
https://openaq.org
(caaqm, CPCB)
The data is licensed under CC-By 4.0
CO 1500 (Good)
PM2,5 96 (Very Unhealthy)
SO2 11 (Good)
PM10 144 (Very Unhealthy)
O3 14 (Good)
NO2 41 (Moderate)
Data on air pollution from recent days in Ranga Reddy
| index | 2022-10-31 |
|---|---|
| co | 1273 Good |
| pm25 | 88 Very Unhealthy |
| so2 | 7 Good |
| pm10 | 137 Very Unhealthy |
| o3 | 15 Good |
| no2 | 40 Moderate |

| index | 2020-05 | 2020-04 | 2020-03 | 2020-02 | 2020-01 | 2019-12 | 2019-11 | 2019-10 | 2019-09 | 2019-08 | 2019-07 | 2019-06 | 2019-05 | 2019-04 | 2019-02 | 2018-11 | 2018-10 | 2018-09 | 2018-08 | 2018-05 | 2018-04 | 2018-03 | 2018-02 | 2018-01 | 2017-12 | 2017-11 | 2017-10 | 2017-09 | 2017-08 | 2017-07 | 2017-06 | 2017-05 | 2017-04 | 2017-03 | 2017-02 |
|---|---|---|---|---|---|---|---|---|---|---|---|---|---|---|---|---|---|---|---|---|---|---|---|---|---|---|---|---|---|---|---|---|---|---|---|
| pm25 | 28 (Moderate) | 27 (Moderate) | 33 (Moderate) | 43 (Unhealthy for Sensitive Groups) | 51 (Unhealthy for Sensitive Groups) | 65 (Unhealthy) | 73 (Unhealthy) | 38 (Unhealthy for Sensitive Groups) | 21 (Moderate) | 18 (Moderate) | 19 (Moderate) | 22 (Moderate) | 43 (Unhealthy for Sensitive Groups) | 43 (Unhealthy for Sensitive Groups) | 68 (Unhealthy) | 43 (Unhealthy for Sensitive Groups) | 50 (Unhealthy for Sensitive Groups) | 35 (Unhealthy for Sensitive Groups) | 17 (Moderate) | 35 (Moderate) | 54 (Unhealthy for Sensitive Groups) | 100 (Very Unhealthy) | 51 (Unhealthy for Sensitive Groups) | 68 (Unhealthy) | 73 (Unhealthy) | 58 (Unhealthy) | 53 (Unhealthy for Sensitive Groups) | 29 (Moderate) | 23 (Moderate) | 21 (Moderate) | 19 (Moderate) | 50 (Unhealthy for Sensitive Groups) | 84 (Very Unhealthy) | 58 (Unhealthy) | 75 (Unhealthy) |
| pm10 | 64 (Unhealthy for Sensitive Groups) | 55 (Unhealthy for Sensitive Groups) | 76 (Unhealthy for Sensitive Groups) | 96 (Unhealthy) | 100 (Unhealthy) | 114 (Very Unhealthy) | 133 (Very Unhealthy) | 66 (Unhealthy for Sensitive Groups) | 45 (Moderate) | 55 (Unhealthy for Sensitive Groups) | 49 (Moderate) | 51 (Unhealthy for Sensitive Groups) | 145 (Very Unhealthy) | 117 (Very Unhealthy) | 134 (Very Unhealthy) | 92 (Unhealthy) | 109 (Unhealthy) | 82 (Unhealthy) | 50 (Unhealthy for Sensitive Groups) | 90 (Unhealthy) | 97 (Unhealthy) | 111 (Very Unhealthy) | 114 (Very Unhealthy) | 140 (Very Unhealthy) | 129 (Very Unhealthy) | 98 (Unhealthy) | 102 (Unhealthy) | 67 (Unhealthy for Sensitive Groups) | 59 (Unhealthy for Sensitive Groups) | 55 (Unhealthy for Sensitive Groups) | 50 (Moderate) | 124 (Very Unhealthy) | 200 (Very bad Hazardous) | 134 (Very Unhealthy) | 167 (Very bad Hazardous) |
| no2 | 18 (Good) | 21 (Good) | 20 (Good) | 33 (Good) | 32 (Good) | 37 (Good) | 38 (Good) | 27 (Good) | 22 (Good) | 20 (Good) | 19 (Good) | 19 (Good) | 27 (Good) | 30 (Good) | 42 (Moderate) | 33 (Good) | 34 (Good) | 25 (Good) | 14 (Good) | 29 (Good) | 41 (Moderate) | 52 (Moderate) | 44 (Moderate) | 49 (Moderate) | 51 (Moderate) | 39 (Good) | 32 (Good) | 18 (Good) | 13 (Good) | 14 (Good) | 14 (Good) | 22 (Good) | 35 (Good) | 27 (Good) | 38 (Good) |
| so2 | 10 (Good) | 8.9 (Good) | 12 (Good) | 14 (Good) | 18 (Good) | 18 (Good) | 16 (Good) | 15 (Good) | 18 (Good) | 21 (Good) | 18 (Good) | 8.4 (Good) | 11 (Good) | 10 (Good) | 15 (Good) | 20 (Good) | 19 (Good) | 17 (Good) | 16 (Good) | 20 (Good) | 18 (Good) | 12 (Good) | 25 (Good) | 25 (Good) | 22 (Good) | 18 (Good) | 21 (Good) | 19 (Good) | 21 (Good) | 23 (Good) | 21 (Good) | 38 (Good) | 57 (Moderate) | 33 (Good) | 64 (Moderate) |
| co | 397 (Good) | 398 (Good) | 438 (Good) | 555 (Good) | 656 (Good) | 761 (Good) | 647 (Good) | 579 (Good) | 472 (Good) | 442 (Good) | 418 (Good) | 387 (Good) | 542 (Good) | 647 (Good) | 646 (Good) | 470 (Good) | 345 (Good) | 436 (Good) | 251 (Good) | 555 (Good) | 12 (Good) | 40 (Good) | 430 (Good) | 530 (Good) | 567 (Good) | 385 (Good) | 523 (Good) | 311 (Good) | 340 (Good) | 215 (Good) | 211 (Good) | 505 (Good) | 898 (Good) | 832 (Good) | 1 (Good) |
| o3 | 36 (Good) | 30 (Good) | 31 (Good) | 32 (Good) | 32 (Good) | 33 (Good) | 40 (Good) | 23 (Good) | 17 (Good) | 17 (Good) | 35 (Good) | 27 (Good) | 38 (Good) | 43 (Good) | 33 (Good) | 33 (Good) | 36 (Good) | 23 (Good) | 15 (Good) | 55 (Good) | 44 (Good) | 38 (Good) | 46 (Good) | 57 (Good) | 54 (Good) | 57 (Good) | 41 (Good) | 34 (Good) | 26 (Good) | 22 (Good) | 20 (Good) | - (Good) | - (Good) | - (Good) | - (Good) |
CO 2670 (Moderate)
carbon monoxide (CO)PM2,5 83 (Very Unhealthy)
particulate matter (PM2.5) dustSO2 21 (Good)
sulfur dioxide (SO2)PM10 135 (Very Unhealthy)
particulate matter (PM10) suspended dustO3 0.7 (Good)
ozone (O3)NO2 29 (Good)
nitrogen dioxide (NO2)PM10 152 (Very bad Hazardous)
particulate matter (PM10) suspended dustSO2 8.5 (Good)
sulfur dioxide (SO2)PM2,5 52 (Unhealthy for Sensitive Groups)
particulate matter (PM2.5) dustCO 700 (Good)
carbon monoxide (CO)NO2 59 (Moderate)
nitrogen dioxide (NO2)O3 5.5 (Good)
ozone (O3)O3 36 (Good)
ozone (O3)PM2,5 152 (Very bad Hazardous)
particulate matter (PM2.5) dustNO2 34 (Good)
nitrogen dioxide (NO2)SO2 2.1 (Good)
sulfur dioxide (SO2)CO 1130 (Good)
carbon monoxide (CO)Bollaram Industrial Area, Hyderabad - TSPCB
| index | 2022-10-31 |
|---|---|
| co | 2095 |
| pm25 | 82 |
| so2 | 11 |
| pm10 | 129 |
| o3 | 4.8 |
| no2 | 29 |
Central University, Hyderabad - TSPCB
| index | 2022-10-31 |
|---|---|
| pm10 | 145 |
| so2 | 8.6 |
| pm25 | 50 |
| co | 615 |
| no2 | 56 |
| o3 | 2.8 |
Sanathnagar - Hyderabad - TSPCB
| index | 2022-10-31 |
|---|---|
| o3 | 36 |
| pm25 | 132 |
| no2 | 35 |
| so2 | 1.9 |
| co | 1110 |
Bollaram Industrial Area, Hyderabad - TSPCB
| index | 2020-05 | 2020-04 | 2020-03 | 2020-02 | 2020-01 | 2019-12 | 2019-11 | 2019-10 | 2019-09 | 2019-08 | 2019-07 | 2019-06 | 2019-05 | 2019-04 | 2019-02 | 2018-11 | 2018-10 | 2018-09 | 2018-08 | 2018-05 | 2018-04 | 2018-03 | 2018-02 | 2018-01 | 2017-12 | 2017-11 | 2017-10 | 2017-09 | 2017-08 | 2017-07 | 2017-06 | 2017-05 | 2017-04 | 2017-03 | 2017-02 |
|---|---|---|---|---|---|---|---|---|---|---|---|---|---|---|---|---|---|---|---|---|---|---|---|---|---|---|---|---|---|---|---|---|---|---|---|
| pm25 | 28 | 26 | 34 | 43 | 56 | 64 | 69 | 35 | 23 | 25 | 24 | 32 | 58 | 46 | 68 | 42 | 53 | 44 | 25 | 36 | 49 | 106 | 52 | 65 | 65 | 51 | 62 | 38 | 36 | 30 | 26 | 50 | 84 | 58 | 75 |
| co | 363 | 329 | 372 | 419 | 496 | 576 | 604 | 517 | 449 | 347 | 302 | 389 | 651 | 550 | 666 | 452 | 442 | 426 | 285 | 413 | 6 | 37 | 637 | 743 | 736 | 514 | 802 | 413 | 545 | 246 | 276 | 505 | 898 | 832 | 1 |
| so2 | 14 | 9 | 17 | 18 | 13 | 6.7 | 10 | 14 | 23 | 31 | 22 | 9 | 18 | 5.3 | 12 | 9.4 | 13 | 15 | 18 | 30 | 28 | 13 | 14 | 17 | 14 | 22 | 39 | 30 | 37 | 42 | 39 | 38 | 57 | 33 | 64 |
| pm10 | 69 | 55 | 80 | 102 | 107 | 122 | 141 | 74 | 55 | 71 | 65 | 61 | 159 | 124 | 133 | 86 | 99 | 93 | 68 | 103 | 106 | 115 | 122 | 137 | 123 | 100 | 121 | 85 | 83 | 74 | 63 | 124 | 200 | 134 | 167 |
| no2 | 18 | 16 | 22 | 27 | 29 | 34 | 34 | 24 | 23 | 31 | 27 | 26 | 33 | 27 | 24 | 18 | 19 | 17 | 13 | 24 | 30 | 38 | 35 | 35 | 36 | 27 | 28 | 19 | 15 | 17 | 19 | 22 | 35 | 27 | 38 |
| o3 | 27 | 29 | 26 | 29 | 31 | 34 | 44 | 31 | 24 | 23 | 20 | 19 | 24 | 36 | 17 | 20 | 21 | 12 | 7.2 | 43 | 40 | 37 | - | - | - | - | - | - | - | - | - | - | - | - | - |
Central University, Hyderabad - TSPCB
| index | 2020-05 | 2020-04 | 2020-03 | 2020-02 | 2020-01 | 2019-12 | 2019-11 | 2019-10 | 2019-09 | 2019-08 | 2019-07 | 2019-06 | 2019-05 | 2019-04 | 2019-02 | 2018-11 | 2018-10 | 2018-09 | 2018-08 | 2018-05 | 2018-04 | 2018-03 | 2018-02 | 2018-01 | 2017-12 | 2017-11 | 2017-10 | 2017-09 | 2017-08 | 2017-07 | 2017-06 |
|---|---|---|---|---|---|---|---|---|---|---|---|---|---|---|---|---|---|---|---|---|---|---|---|---|---|---|---|---|---|---|---|
| co | 355 | 431 | 358 | - | 784 | 836 | 530 | 512 | 264 | 393 | 386 | 385 | 438 | 633 | 614 | 461 | 496 | 402 | 196 | 726 | 15 | 47 | 1 | 1 | 2 | 1 | 1 | 1 | 1 | 1 | 1 |
| o3 | 38 | 21 | 35 | 34 | 30 | 31 | 33 | 18 | 14 | 17 | 75 | 35 | 55 | 56 | 54 | 47 | 48 | 31 | 24 | 75 | 57 | 55 | 63 | 75 | 68 | 64 | 49 | 46 | 37 | 25 | 22 |
| no2 | 25 | 40 | 21 | 42 | 32 | 36 | 41 | 27 | 19 | 14 | 11 | 13 | 17 | 25 | 54 | 43 | 43 | 26 | 12 | 29 | 48 | 65 | 53 | 62 | 67 | 51 | 37 | 17 | 12 | 11 | 10 |
| pm10 | 59 | 55 | 73 | 89 | 93 | 106 | 125 | 57 | 36 | 39 | 34 | 42 | 130 | 109 | 134 | 98 | 118 | 71 | 32 | 77 | 89 | 106 | 105 | 142 | 134 | 96 | 82 | 49 | 35 | 37 | 36 |
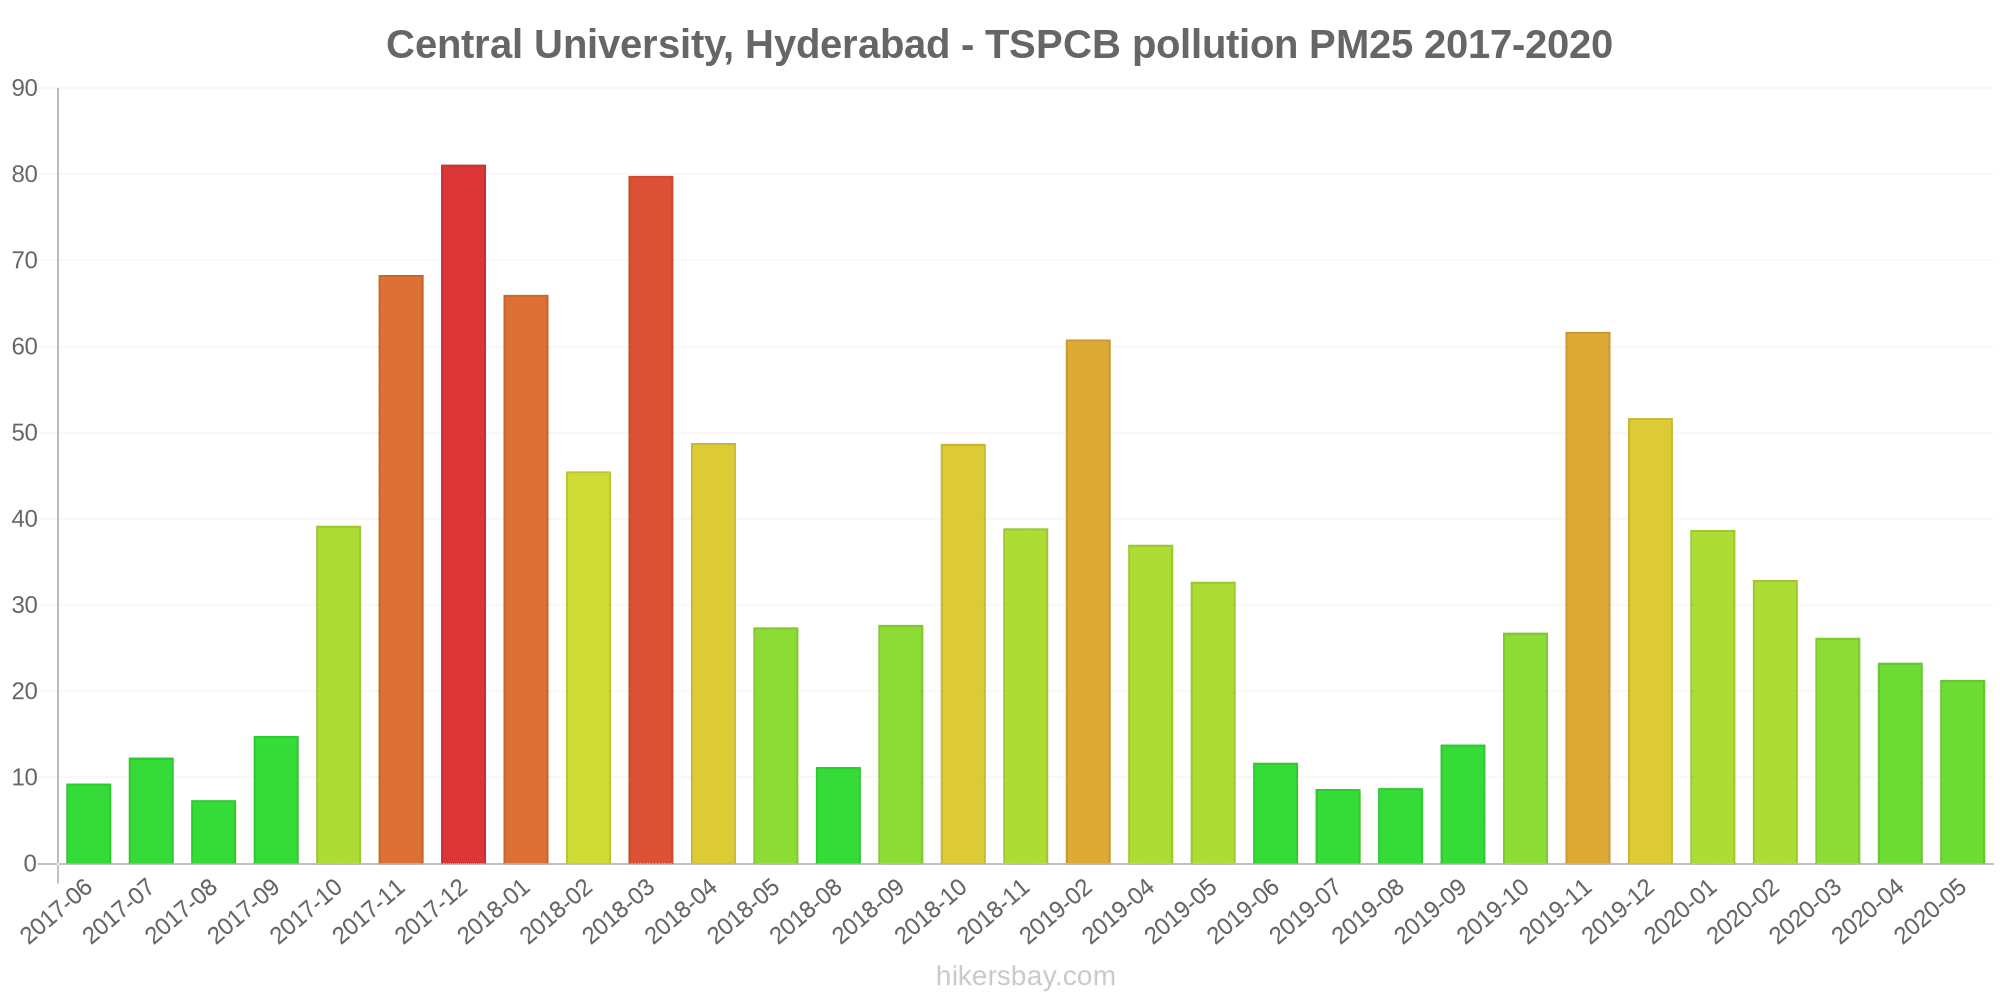
| pm25 | 21 | 23 | 26 | 33 | 39 | 52 | 62 | 27 | 14 | 8.8 | 8.7 | 12 | 33 | 37 | 61 | 39 | 49 | 28 | 11 | 27 | 49 | 80 | 46 | 66 | 81 | 68 | 39 | 15 | 7.3 | 12 | 9.3 |
| so2 | 16 | 12 | 11 | 11 | 12 | 23 | 11 | 11 | 13 | 10 | 12 | 7.8 | 5.1 | 15 | 13 | 19 | 16 | 12 | 9.2 | 8.7 | 8.6 | 9 | 32 | 28 | 25 | 27 | 16 | 22 | 20 | 23 | 18 |
Sanathnagar, Hyderabad - TSPCB

| index | 2020-05 | 2020-04 | 2020-03 | 2020-02 | 2020-01 | 2019-12 | 2019-11 | 2019-10 | 2019-09 | 2019-08 | 2019-07 | 2019-05 | 2019-04 | 2019-02 | 2018-11 | 2018-10 | 2018-09 | 2018-08 | 2018-05 | 2018-04 | 2018-03 | 2018-02 | 2018-01 | 2017-12 | 2017-11 | 2017-10 | 2017-09 | 2017-08 | 2017-07 | 2017-06 |
|---|---|---|---|---|---|---|---|---|---|---|---|---|---|---|---|---|---|---|---|---|---|---|---|---|---|---|---|---|---|---|
| co | 474 | 433 | 584 | 690 | 688 | 871 | 806 | 708 | 702 | 587 | 565 | 538 | 759 | 657 | 498 | 98 | 480 | 273 | 526 | 16 | 37 | 653 | 845 | 962 | 641 | 765 | 519 | 475 | 398 | 355 |
| o3 | 43 | 42 | 34 | 34 | 36 | 35 | 43 | 19 | 14 | 10 | 11 | 35 | 38 | 29 | 32 | 38 | 26 | 15 | 46 | 35 | 22 | 30 | 39 | 40 | 51 | 34 | 22 | 14 | 19 | 19 |
| so2 | 0.41 | 6 | 9.5 | 12 | 29 | 26 | 26 | 19 | 19 | 23 | 21 | 9.1 | 10 | 21 | 32 | 29 | 25 | 21 | 22 | 18 | 14 | 29 | 29 | 28 | 5.7 | 6.6 | 5.2 | 5.1 | 4.8 | 4.9 |
| pm25 | 33 | 32 | 40 | 52 | 60 | 78 | 87 | 52 | 25 | 20 | 25 | 38 | 47 | 74 | 49 | 49 | 34 | 15 | 41 | 64 | 115 | 56 | 73 | 73 | 56 | 57 | 33 | 25 | 20 | 21 |
| no2 | 9.8 | 6 | 15 | 29 | 36 | 41 | 39 | 31 | 23 | 15 | 20 | 30 | 37 | 47 | 39 | 39 | 31 | 17 | 34 | 45 | 53 | - | - | - | - | - | - | - | - | - |