Air Pollution in Kopar Khairane: Real-time Air Quality Index and smog alert.
Pollution and air quality forecast for Kopar Khairane. Today is Wednesday, May 13, 2026. The following air pollution values have been recorded for Kopar Khairane:- nitrogen dioxide (NO2) - 50 (Moderate)
- ozone (O3) - 16 (Good)
- carbon monoxide (CO) - 500 (Good)
- particulate matter (PM2.5) dust - 985 (Very bad Hazardous)
- sulfur dioxide (SO2) - 35 (Good)
- particulate matter (PM10) suspended dust - 985 (Very bad Hazardous)

What is the air quality in Kopar Khairane today? Is the air polluted in Kopar Khairane?. Is there smog?
How high is the level of NO2? (nitrogen dioxide (NO2))
50 (Moderate)
How is the O3 level today in Kopar Khairane? (ozone (O3))
16 (Good)
How high is the CO level? (carbon monoxide (CO))
500 (Good)
What is the current level of PM2.5 in Kopar Khairane? (particulate matter (PM2.5) dust)
Today's PM2.5 level is:
985 (Very bad Hazardous)
For comparison, the highest level of PM2.5 in Kopar Khairane in the last 7 days was: 265 (Friday, October 14, 2022) and the lowest: 15 (Sunday, October 9, 2022).
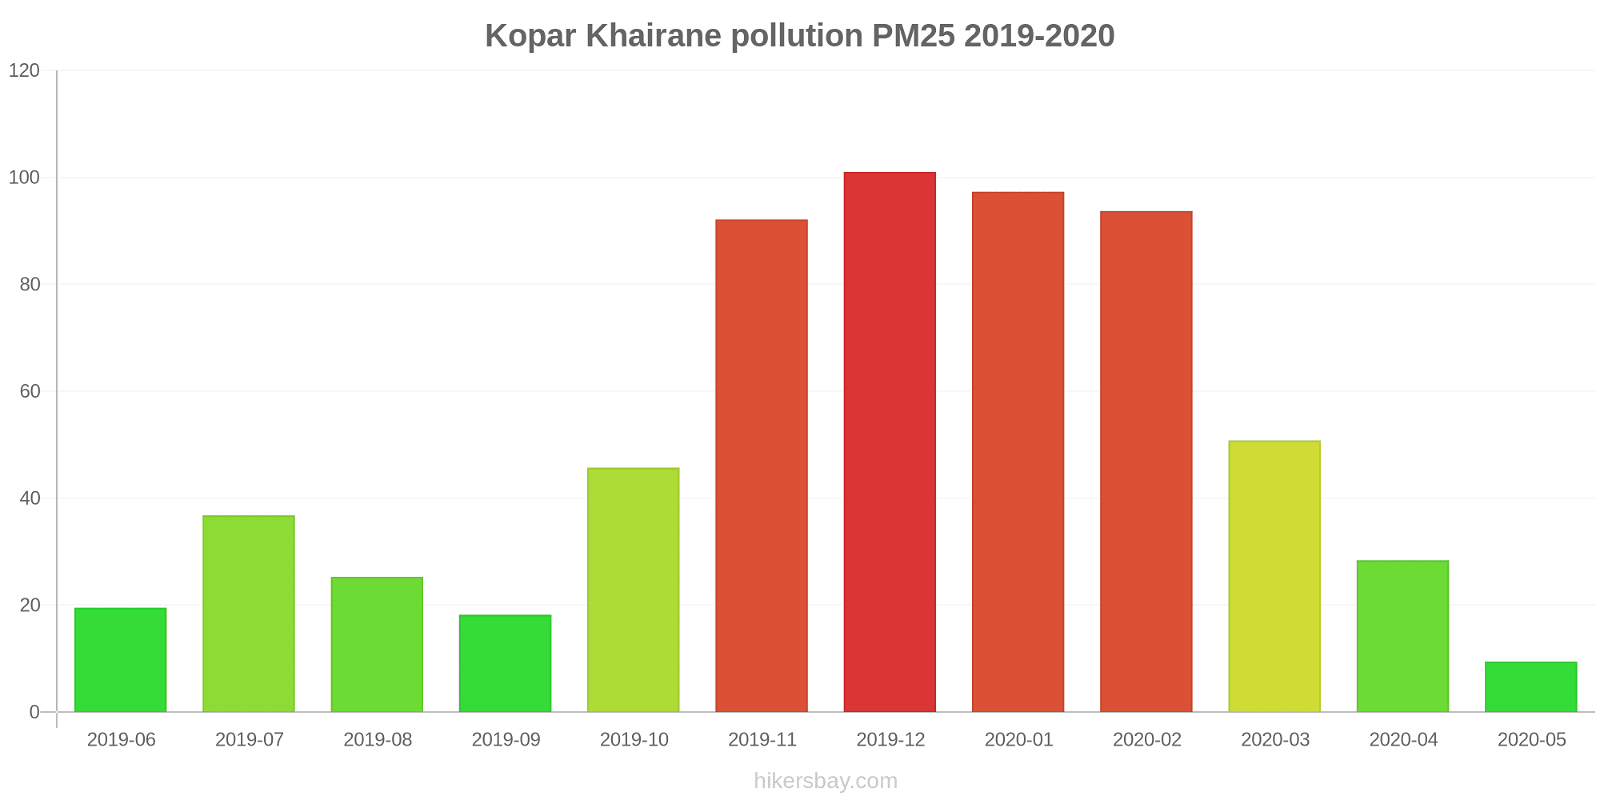
The highest PM2.5 values were recorded: 101 (December 2019).
The lowest level of particulate matter PM2.5 pollution occurs in month: May (9.4).
What is the level of SO2 pollution? (sulfur dioxide (SO2))
35 (Good)
What is the level of PM10 today in Kopar Khairane? (particulate matter (PM10) suspended dust)
The current level of particulate matter PM10 in Kopar Khairane is:
985 (Very bad Hazardous)
The highest PM10 values usually occur in month: 201 (February 2020).
The lowest value of particulate matter PM10 pollution in Kopar Khairane is usually recorded in: June (38).
Current data Friday, October 14, 2022, 6:00 AM
NO2 50 (Moderate)
O3 16 (Good)
CO 500 (Good)
PM2,5 985 (Very bad Hazardous)
SO2 35 (Good)
PM10 985 (Very bad Hazardous)
Data on air pollution from recent days in Kopar Khairane
index
2022-10-07
2022-10-08
2022-10-09
2022-10-10
2022-10-11
2022-10-12
2022-10-13
2022-10-14
no2
42
Moderate
34
Good
37
Good
18
Good
21
Good
38
Good
32
Good
27
Good
pm10
66
Unhealthy for Sensitive Groups
177
Very bad Hazardous
67
Unhealthy for Sensitive Groups
85
Unhealthy
95
Unhealthy
68
Unhealthy for Sensitive Groups
74
Unhealthy for Sensitive Groups
320
Very bad Hazardous
so2
15
Good
48
Good
6
Good
5
Good
7
Good
5
Good
7
Good
13
Good
pm25
20
Moderate
239
Very bad Hazardous
15
Moderate
23
Moderate
61
Unhealthy
20
Moderate
21
Moderate
265
Very bad Hazardous
co
710
Good
695
Good
799
Good
480
Good
339
Good
676
Good
520
Good
723
Good
o3
13
Good
15
Good
15
Good
15
Good
15
Good
15
Good
15
Good
15
Good
data source »
Air pollution in Kopar Khairane from June 2019 to May 2020
index
2020-05
2020-04
2020-03
2020-02
2020-01
2019-12
2019-11
2019-10
2019-09
2019-08
2019-07
2019-06
pm25
9.4 (Good)
28 (Moderate)
51 (Unhealthy for Sensitive Groups)
94 (Very Unhealthy)
97 (Very Unhealthy)
101 (Very Unhealthy)
92 (Very Unhealthy)
46 (Unhealthy for Sensitive Groups)
18 (Moderate)
25 (Moderate)
37 (Unhealthy for Sensitive Groups)
20 (Moderate)
pm10
62 (Unhealthy for Sensitive Groups)
99 (Unhealthy)
138 (Very Unhealthy)
201 (Very bad Hazardous)
181 (Very bad Hazardous)
175 (Very bad Hazardous)
188 (Very bad Hazardous)
128 (Very Unhealthy)
54 (Unhealthy for Sensitive Groups)
71 (Unhealthy for Sensitive Groups)
71 (Unhealthy for Sensitive Groups)
38 (Moderate)
no2
10 (Good)
15 (Good)
39 (Good)
65 (Moderate)
53 (Moderate)
53 (Moderate)
50 (Moderate)
27 (Good)
19 (Good)
14 (Good)
20 (Good)
29 (Good)
so2
39 (Good)
11 (Good)
27 (Good)
26 (Good)
12 (Good)
19 (Good)
9.8 (Good)
17 (Good)
27 (Good)
25 (Good)
15 (Good)
18 (Good)
co
1 (Good)
1 (Good)
1 (Good)
1 (Good)
1 (Good)
1 (Good)
1 (Good)
572 (Good)
574 (Good)
437 (Good)
580 (Good)
552 (Good)
o3
22 (Good)
32 (Good)
41 (Good)
60 (Good)
52 (Good)
53 (Good)
45 (Good)
30 (Good)
12 (Good)
9.5 (Good)
9.3 (Good)
20 (Good)
data source »
Mahape, Navi Mumbai - MPCB
Friday, October 14, 2022, 6:00 AM
NO2 50 (Moderate)
nitrogen dioxide (NO2)
O3 16 (Good)
ozone (O3)
CO 500 (Good)
carbon monoxide (CO)
PM2,5 985 (Very bad Hazardous)
particulate matter (PM2.5) dust
SO2 35 (Good)
sulfur dioxide (SO2)
PM10 985 (Very bad Hazardous)
particulate matter (PM10) suspended dust
Mahape, Navi Mumbai - MPCB
index
2022-10-14
2022-10-13
2022-10-12
2022-10-11
2022-10-10
2022-10-09
2022-10-08
2022-10-07
no2
27
32
38
21
18
37
34
42
pm10
320
74
68
95
85
67
177
66
so2
13
6.7
5.2
6.9
5.4
6.4
48
15
pm25
265
21
20
61
23
15
239
20
co
723
520
676
339
480
799
695
710
o3
15
15
15
15
15
15
15
13
Mahape, Navi Mumbai - MPCB
2019-06 2020-05

index
2020-05
2020-04
2020-03
2020-02
2020-01
2019-12
2019-11
2019-10
2019-09
2019-08
2019-07
2019-06
pm25
9.4
28
51
94
97
101
92
46
18
25
37
20
pm10
62
99
138
201
181
175
188
128
54
71
71
38
no2
10
15
39
65
53
53
50
27
19
14
20
29
so2
39
11
27
26
12
19
9.8
17
27
25
15
18
co
1
1
1
1
1
1
1
572
574
437
580
552
o3
22
32
41
60
52
53
45
30
12
9.5
9.3
20
* Pollution data source:
https://openaq.org
(caaqm)
The data is licensed under CC-By 4.0
NO2 50 (Moderate)
O3 16 (Good)
CO 500 (Good)
PM2,5 985 (Very bad Hazardous)
SO2 35 (Good)
PM10 985 (Very bad Hazardous)
Data on air pollution from recent days in Kopar Khairane
| index | 2022-10-07 | 2022-10-08 | 2022-10-09 | 2022-10-10 | 2022-10-11 | 2022-10-12 | 2022-10-13 | 2022-10-14 |
|---|---|---|---|---|---|---|---|---|
| no2 | 42 Moderate |
34 Good |
37 Good |
18 Good |
21 Good |
38 Good |
32 Good |
27 Good |
| pm10 | 66 Unhealthy for Sensitive Groups |
177 Very bad Hazardous |
67 Unhealthy for Sensitive Groups |
85 Unhealthy |
95 Unhealthy |
68 Unhealthy for Sensitive Groups |
74 Unhealthy for Sensitive Groups |
320 Very bad Hazardous |
| so2 | 15 Good |
48 Good |
6 Good |
5 Good |
7 Good |
5 Good |
7 Good |
13 Good |
| pm25 | 20 Moderate |
239 Very bad Hazardous |
15 Moderate |
23 Moderate |
61 Unhealthy |
20 Moderate |
21 Moderate |
265 Very bad Hazardous |
| co | 710 Good |
695 Good |
799 Good |
480 Good |
339 Good |
676 Good |
520 Good |
723 Good |
| o3 | 13 Good |
15 Good |
15 Good |
15 Good |
15 Good |
15 Good |
15 Good |
15 Good |

| index | 2020-05 | 2020-04 | 2020-03 | 2020-02 | 2020-01 | 2019-12 | 2019-11 | 2019-10 | 2019-09 | 2019-08 | 2019-07 | 2019-06 |
|---|---|---|---|---|---|---|---|---|---|---|---|---|
| pm25 | 9.4 (Good) | 28 (Moderate) | 51 (Unhealthy for Sensitive Groups) | 94 (Very Unhealthy) | 97 (Very Unhealthy) | 101 (Very Unhealthy) | 92 (Very Unhealthy) | 46 (Unhealthy for Sensitive Groups) | 18 (Moderate) | 25 (Moderate) | 37 (Unhealthy for Sensitive Groups) | 20 (Moderate) |
| pm10 | 62 (Unhealthy for Sensitive Groups) | 99 (Unhealthy) | 138 (Very Unhealthy) | 201 (Very bad Hazardous) | 181 (Very bad Hazardous) | 175 (Very bad Hazardous) | 188 (Very bad Hazardous) | 128 (Very Unhealthy) | 54 (Unhealthy for Sensitive Groups) | 71 (Unhealthy for Sensitive Groups) | 71 (Unhealthy for Sensitive Groups) | 38 (Moderate) |
| no2 | 10 (Good) | 15 (Good) | 39 (Good) | 65 (Moderate) | 53 (Moderate) | 53 (Moderate) | 50 (Moderate) | 27 (Good) | 19 (Good) | 14 (Good) | 20 (Good) | 29 (Good) |
| so2 | 39 (Good) | 11 (Good) | 27 (Good) | 26 (Good) | 12 (Good) | 19 (Good) | 9.8 (Good) | 17 (Good) | 27 (Good) | 25 (Good) | 15 (Good) | 18 (Good) |
| co | 1 (Good) | 1 (Good) | 1 (Good) | 1 (Good) | 1 (Good) | 1 (Good) | 1 (Good) | 572 (Good) | 574 (Good) | 437 (Good) | 580 (Good) | 552 (Good) |
| o3 | 22 (Good) | 32 (Good) | 41 (Good) | 60 (Good) | 52 (Good) | 53 (Good) | 45 (Good) | 30 (Good) | 12 (Good) | 9.5 (Good) | 9.3 (Good) | 20 (Good) |
NO2 50 (Moderate)
nitrogen dioxide (NO2)O3 16 (Good)
ozone (O3)CO 500 (Good)
carbon monoxide (CO)PM2,5 985 (Very bad Hazardous)
particulate matter (PM2.5) dustSO2 35 (Good)
sulfur dioxide (SO2)PM10 985 (Very bad Hazardous)
particulate matter (PM10) suspended dustMahape, Navi Mumbai - MPCB
| index | 2022-10-14 | 2022-10-13 | 2022-10-12 | 2022-10-11 | 2022-10-10 | 2022-10-09 | 2022-10-08 | 2022-10-07 |
|---|---|---|---|---|---|---|---|---|
| no2 | 27 | 32 | 38 | 21 | 18 | 37 | 34 | 42 |
| pm10 | 320 | 74 | 68 | 95 | 85 | 67 | 177 | 66 |
| so2 | 13 | 6.7 | 5.2 | 6.9 | 5.4 | 6.4 | 48 | 15 |
| pm25 | 265 | 21 | 20 | 61 | 23 | 15 | 239 | 20 |
| co | 723 | 520 | 676 | 339 | 480 | 799 | 695 | 710 |
| o3 | 15 | 15 | 15 | 15 | 15 | 15 | 15 | 13 |
Mahape, Navi Mumbai - MPCB
| index | 2020-05 | 2020-04 | 2020-03 | 2020-02 | 2020-01 | 2019-12 | 2019-11 | 2019-10 | 2019-09 | 2019-08 | 2019-07 | 2019-06 |
|---|---|---|---|---|---|---|---|---|---|---|---|---|
| pm25 | 9.4 | 28 | 51 | 94 | 97 | 101 | 92 | 46 | 18 | 25 | 37 | 20 |
| pm10 | 62 | 99 | 138 | 201 | 181 | 175 | 188 | 128 | 54 | 71 | 71 | 38 |
| no2 | 10 | 15 | 39 | 65 | 53 | 53 | 50 | 27 | 19 | 14 | 20 | 29 |
| so2 | 39 | 11 | 27 | 26 | 12 | 19 | 9.8 | 17 | 27 | 25 | 15 | 18 |
| co | 1 | 1 | 1 | 1 | 1 | 1 | 1 | 572 | 574 | 437 | 580 | 552 |
| o3 | 22 | 32 | 41 | 60 | 52 | 53 | 45 | 30 | 12 | 9.5 | 9.3 | 20 |