Air Pollution in Vapi: Real-time Air Quality Index and smog alert.
Pollution and air quality forecast for Vapi. Today is Wednesday, May 13, 2026. The following air pollution values have been recorded for Vapi:- particulate matter (PM10) suspended dust - 54 (Unhealthy for Sensitive Groups)
- nitrogen dioxide (NO2) - 7 (Good)
- ozone (O3) - 0 (Good)
- particulate matter (PM2.5) dust - 53 (Unhealthy for Sensitive Groups)
- carbon monoxide (CO) - 900 (Good)
- sulfur dioxide (SO2) - 29 (Good)

What is the air quality in Vapi today? Is the air polluted in Vapi?. Is there smog?
What is the level of PM10 today in Vapi? (particulate matter (PM10) suspended dust)
The current level of particulate matter PM10 in Vapi is:
54 (Unhealthy for Sensitive Groups)
The highest PM10 values usually occur in month: 187 (January 2020).
The lowest value of particulate matter PM10 pollution in Vapi is usually recorded in: September (49).
How high is the level of NO2? (nitrogen dioxide (NO2))
7 (Good)
How is the O3 level today in Vapi? (ozone (O3))
0 (Good)
What is the current level of PM2.5 in Vapi? (particulate matter (PM2.5) dust)
Today's PM2.5 level is:
53 (Unhealthy for Sensitive Groups)
For comparison, the highest level of PM2.5 in Vapi in the last 7 days was: 58 (Tuesday, October 11, 2022) and the lowest: 22 (Saturday, October 8, 2022).
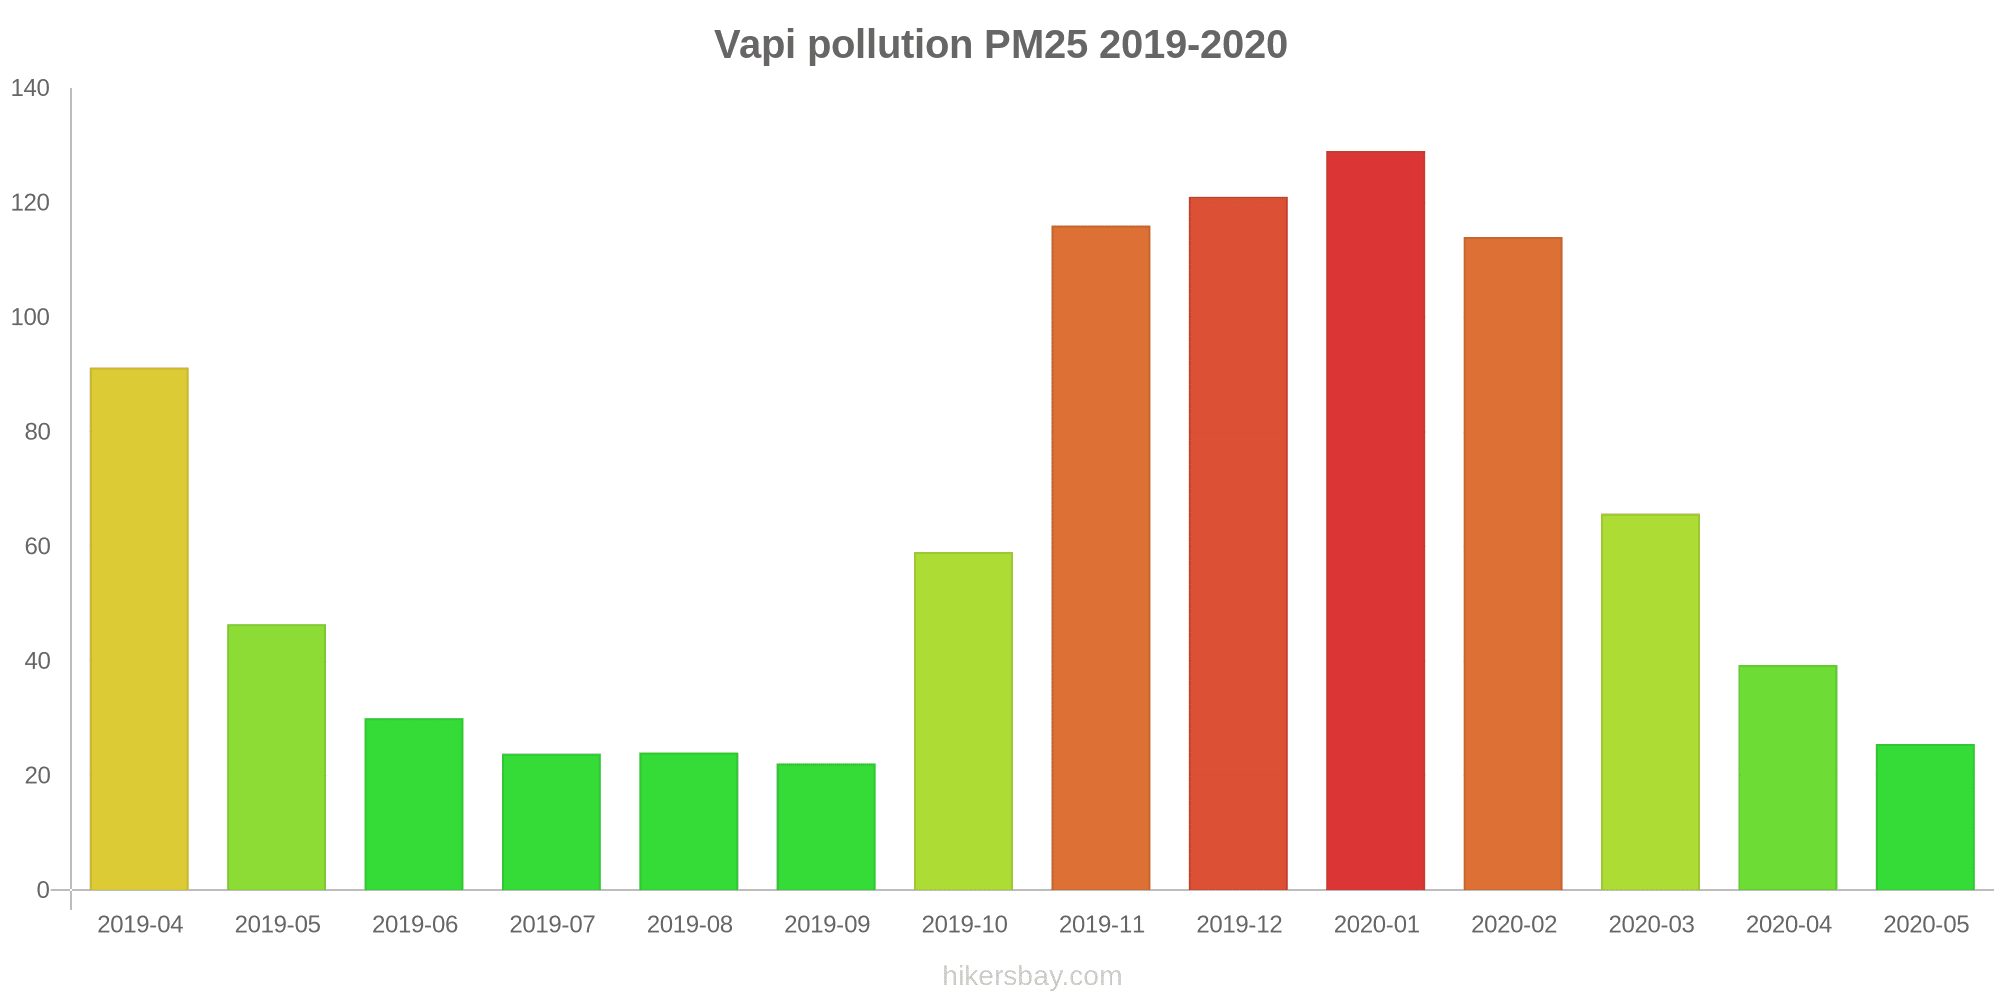
The highest PM2.5 values were recorded: 129 (January 2020).
The lowest level of particulate matter PM2.5 pollution occurs in month: September (22).
How high is the CO level? (carbon monoxide (CO))
900 (Good)
What is the level of SO2 pollution? (sulfur dioxide (SO2))
29 (Good)
Current data Wednesday, October 12, 2022, 4:45 AM
PM10 54 (Unhealthy for Sensitive Groups)
NO2 7 (Good)
O3 0 (Good)
PM2,5 53 (Unhealthy for Sensitive Groups)
CO 900 (Good)
SO2 29 (Good)
Data on air pollution from recent days in Vapi
index
2022-10-07
2022-10-08
2022-10-10
2022-10-11
2022-10-12
so2
28
Good
28
Good
28
Good
28
Good
29
Good
co
500
Good
400
Good
600
Good
550
Good
900
Good
pm10
63
Unhealthy for Sensitive Groups
24
Moderate
39
Moderate
67
Unhealthy for Sensitive Groups
54
Unhealthy for Sensitive Groups
no2
7
Good
8
Good
8
Good
8
Good
7
Good
o3
0
Good
0
Good
0
Good
0
Good
0
Good
pm25
56
Unhealthy
22
Moderate
25
Moderate
58
Unhealthy
53
Unhealthy for Sensitive Groups
data source »
Air pollution in Vapi from April 2019 to May 2020

index
2020-05
2020-04
2020-03
2020-02
2020-01
2019-12
2019-11
2019-10
2019-09
2019-08
2019-07
2019-06
2019-05
2019-04
pm25
26 (Moderate)
39 (Unhealthy for Sensitive Groups)
66 (Unhealthy)
114 (Very bad Hazardous)
129 (Very bad Hazardous)
121 (Very bad Hazardous)
116 (Very bad Hazardous)
59 (Unhealthy)
22 (Moderate)
24 (Moderate)
24 (Moderate)
30 (Moderate)
46 (Unhealthy for Sensitive Groups)
91 (Very Unhealthy)
pm10
55 (Unhealthy for Sensitive Groups)
70 (Unhealthy for Sensitive Groups)
115 (Very Unhealthy)
175 (Very bad Hazardous)
187 (Very bad Hazardous)
182 (Very bad Hazardous)
168 (Very bad Hazardous)
106 (Unhealthy)
49 (Moderate)
62 (Unhealthy for Sensitive Groups)
54 (Unhealthy for Sensitive Groups)
60 (Unhealthy for Sensitive Groups)
116 (Very Unhealthy)
178 (Very bad Hazardous)
no2
16 (Good)
16 (Good)
19 (Good)
18 (Good)
24 (Good)
25 (Good)
18 (Good)
9.1 (Good)
4.9 (Good)
4.1 (Good)
9.3 (Good)
24 (Good)
22 (Good)
36 (Good)
so2
21 (Good)
5.4 (Good)
18 (Good)
25 (Good)
53 (Moderate)
88 (Moderate)
46 (Good)
17 (Good)
4.5 (Good)
4.3 (Good)
18 (Good)
26 (Good)
25 (Good)
39 (Good)
co
421 (Good)
1 (Good)
1 (Good)
1 (Good)
1 (Good)
1 (Good)
1 (Good)
1 (Good)
490 (Good)
265 (Good)
374 (Good)
835 (Good)
419 (Good)
885 (Good)
o3
14 (Good)
25 (Good)
14 (Good)
5.5 (Good)
5.4 (Good)
5.3 (Good)
5.3 (Good)
3.8 (Good)
5 (Good)
0.85 (Good)
1.8 (Good)
5.7 (Good)
18 (Good)
32 (Good)
data source »
Quality of life in Vapi
Green and Parks in the City
Vapi
38%
Nepal: 32%
Bangladesh: 33%
Bhutan: 82%
Sri Lanka: 59%
Pakistan: 49%
particulate matter PM2.5
Vapi
54 (Unhealthy for Sensitive Groups)
Pleasure of spending time in the city
Vapi
24%
Nepal: 32%
Bangladesh: 26%
Bhutan: 61%
Sri Lanka: 52%
Pakistan: 43%
particulate matter PM10
Vapi
100 (Unhealthy)
Air Pollution
Vapi
91%
Nepal: 76%
Bangladesh: 78%
Bhutan: 45%
Sri Lanka: 53%
Pakistan: 64%
Garbage Disposal
Vapi
28%
Nepal: 25%
Bangladesh: 22%
Bhutan: 47%
Sri Lanka: 41%
Pakistan: 34%
Availability and quality of drinking water
Vapi
34%
Nepal: 36%
Bangladesh: 44%
Bhutan: 64%
Sri Lanka: 65%
Pakistan: 44%
Cleanliness and tidiness
Vapi
30%
Nepal: 27%
Bangladesh: 23%
Bhutan: 57%
Sri Lanka: 52%
Pakistan: 40%
Noise and Light pollution
Vapi
39%
Nepal: 55%
Bangladesh: 63%
Bhutan: 55%
Sri Lanka: 50%
Pakistan: 59%
Water Pollution
Vapi
69%
Nepal: 76%
Bangladesh: 74%
Bhutan: 56%
Sri Lanka: 57%
Pakistan: 70%
Source: Numbeo
Phase-1 GIDC, Vapi - GPCB
Wednesday, October 12, 2022, 4:45 AM
PM10 54 (Unhealthy for Sensitive Groups)
particulate matter (PM10) suspended dust
NO2 6.6 (Good)
nitrogen dioxide (NO2)
O3 0 (Good)
ozone (O3)
PM2,5 53 (Unhealthy for Sensitive Groups)
particulate matter (PM2.5) dust
CO 900 (Good)
carbon monoxide (CO)
SO2 29 (Good)
sulfur dioxide (SO2)
Phase-1 GIDC, Vapi - GPCB
index
2022-10-12
2022-10-11
2022-10-10
2022-10-08
2022-10-07
so2
29
28
28
28
28
co
900
550
600
400
500
pm10
54
67
39
24
63
no2
6.6
7.5
7.5
7.6
7.4
o3
0
0
0
0
0
pm25
53
58
25
22
56
Phase-1 GIDC, Vapi - GPCB
2019-04 2020-05

index
2020-05
2020-04
2020-03
2020-02
2020-01
2019-12
2019-11
2019-10
2019-09
2019-08
2019-07
2019-06
2019-05
2019-04
pm25
26
39
66
114
129
121
116
59
22
24
24
30
46
91
pm10
55
70
115
175
187
182
168
106
49
62
54
60
116
178
no2
16
16
19
18
24
25
18
9.1
4.9
4.1
9.3
24
22
36
so2
21
5.4
18
25
53
88
46
17
4.5
4.3
18
26
25
39
co
421
1
1
1
1
1
1
1
490
265
374
835
419
885
o3
14
25
14
5.5
5.4
5.3
5.3
3.8
5
0.85
1.8
5.7
18
32
* Pollution data source:
https://openaq.org
(caaqm)
The data is licensed under CC-By 4.0
PM10 54 (Unhealthy for Sensitive Groups)
NO2 7 (Good)
O3 0 (Good)
PM2,5 53 (Unhealthy for Sensitive Groups)
CO 900 (Good)
SO2 29 (Good)
Data on air pollution from recent days in Vapi
| index | 2022-10-07 | 2022-10-08 | 2022-10-10 | 2022-10-11 | 2022-10-12 |
|---|---|---|---|---|---|
| so2 | 28 Good |
28 Good |
28 Good |
28 Good |
29 Good |
| co | 500 Good |
400 Good |
600 Good |
550 Good |
900 Good |
| pm10 | 63 Unhealthy for Sensitive Groups |
24 Moderate |
39 Moderate |
67 Unhealthy for Sensitive Groups |
54 Unhealthy for Sensitive Groups |
| no2 | 7 Good |
8 Good |
8 Good |
8 Good |
7 Good |
| o3 | 0 Good |
0 Good |
0 Good |
0 Good |
0 Good |
| pm25 | 56 Unhealthy |
22 Moderate |
25 Moderate |
58 Unhealthy |
53 Unhealthy for Sensitive Groups |
| index | 2020-05 | 2020-04 | 2020-03 | 2020-02 | 2020-01 | 2019-12 | 2019-11 | 2019-10 | 2019-09 | 2019-08 | 2019-07 | 2019-06 | 2019-05 | 2019-04 |
|---|---|---|---|---|---|---|---|---|---|---|---|---|---|---|
| pm25 | 26 (Moderate) | 39 (Unhealthy for Sensitive Groups) | 66 (Unhealthy) | 114 (Very bad Hazardous) | 129 (Very bad Hazardous) | 121 (Very bad Hazardous) | 116 (Very bad Hazardous) | 59 (Unhealthy) | 22 (Moderate) | 24 (Moderate) | 24 (Moderate) | 30 (Moderate) | 46 (Unhealthy for Sensitive Groups) | 91 (Very Unhealthy) |
| pm10 | 55 (Unhealthy for Sensitive Groups) | 70 (Unhealthy for Sensitive Groups) | 115 (Very Unhealthy) | 175 (Very bad Hazardous) | 187 (Very bad Hazardous) | 182 (Very bad Hazardous) | 168 (Very bad Hazardous) | 106 (Unhealthy) | 49 (Moderate) | 62 (Unhealthy for Sensitive Groups) | 54 (Unhealthy for Sensitive Groups) | 60 (Unhealthy for Sensitive Groups) | 116 (Very Unhealthy) | 178 (Very bad Hazardous) |
| no2 | 16 (Good) | 16 (Good) | 19 (Good) | 18 (Good) | 24 (Good) | 25 (Good) | 18 (Good) | 9.1 (Good) | 4.9 (Good) | 4.1 (Good) | 9.3 (Good) | 24 (Good) | 22 (Good) | 36 (Good) |
| so2 | 21 (Good) | 5.4 (Good) | 18 (Good) | 25 (Good) | 53 (Moderate) | 88 (Moderate) | 46 (Good) | 17 (Good) | 4.5 (Good) | 4.3 (Good) | 18 (Good) | 26 (Good) | 25 (Good) | 39 (Good) |
| co | 421 (Good) | 1 (Good) | 1 (Good) | 1 (Good) | 1 (Good) | 1 (Good) | 1 (Good) | 1 (Good) | 490 (Good) | 265 (Good) | 374 (Good) | 835 (Good) | 419 (Good) | 885 (Good) |
| o3 | 14 (Good) | 25 (Good) | 14 (Good) | 5.5 (Good) | 5.4 (Good) | 5.3 (Good) | 5.3 (Good) | 3.8 (Good) | 5 (Good) | 0.85 (Good) | 1.8 (Good) | 5.7 (Good) | 18 (Good) | 32 (Good) |
Green and Parks in the City
Vapi 38%
Nepal: 32% Bangladesh: 33% Bhutan: 82% Sri Lanka: 59% Pakistan: 49%particulate matter PM2.5
Vapi 54 (Unhealthy for Sensitive Groups)
Pleasure of spending time in the city
Vapi 24%
Nepal: 32% Bangladesh: 26% Bhutan: 61% Sri Lanka: 52% Pakistan: 43%particulate matter PM10
Vapi 100 (Unhealthy)
Air Pollution
Vapi 91%
Nepal: 76% Bangladesh: 78% Bhutan: 45% Sri Lanka: 53% Pakistan: 64%Garbage Disposal
Vapi 28%
Nepal: 25% Bangladesh: 22% Bhutan: 47% Sri Lanka: 41% Pakistan: 34%Availability and quality of drinking water
Vapi 34%
Nepal: 36% Bangladesh: 44% Bhutan: 64% Sri Lanka: 65% Pakistan: 44%Cleanliness and tidiness
Vapi 30%
Nepal: 27% Bangladesh: 23% Bhutan: 57% Sri Lanka: 52% Pakistan: 40%Noise and Light pollution
Vapi 39%
Nepal: 55% Bangladesh: 63% Bhutan: 55% Sri Lanka: 50% Pakistan: 59%Water Pollution
Vapi 69%
Nepal: 76% Bangladesh: 74% Bhutan: 56% Sri Lanka: 57% Pakistan: 70%PM10 54 (Unhealthy for Sensitive Groups)
particulate matter (PM10) suspended dustNO2 6.6 (Good)
nitrogen dioxide (NO2)O3 0 (Good)
ozone (O3)PM2,5 53 (Unhealthy for Sensitive Groups)
particulate matter (PM2.5) dustCO 900 (Good)
carbon monoxide (CO)SO2 29 (Good)
sulfur dioxide (SO2)Phase-1 GIDC, Vapi - GPCB
| index | 2022-10-12 | 2022-10-11 | 2022-10-10 | 2022-10-08 | 2022-10-07 |
|---|---|---|---|---|---|
| so2 | 29 | 28 | 28 | 28 | 28 |
| co | 900 | 550 | 600 | 400 | 500 |
| pm10 | 54 | 67 | 39 | 24 | 63 |
| no2 | 6.6 | 7.5 | 7.5 | 7.6 | 7.4 |
| o3 | 0 | 0 | 0 | 0 | 0 |
| pm25 | 53 | 58 | 25 | 22 | 56 |
Phase-1 GIDC, Vapi - GPCB

| index | 2020-05 | 2020-04 | 2020-03 | 2020-02 | 2020-01 | 2019-12 | 2019-11 | 2019-10 | 2019-09 | 2019-08 | 2019-07 | 2019-06 | 2019-05 | 2019-04 |
|---|---|---|---|---|---|---|---|---|---|---|---|---|---|---|
| pm25 | 26 | 39 | 66 | 114 | 129 | 121 | 116 | 59 | 22 | 24 | 24 | 30 | 46 | 91 |
| pm10 | 55 | 70 | 115 | 175 | 187 | 182 | 168 | 106 | 49 | 62 | 54 | 60 | 116 | 178 |
| no2 | 16 | 16 | 19 | 18 | 24 | 25 | 18 | 9.1 | 4.9 | 4.1 | 9.3 | 24 | 22 | 36 |
| so2 | 21 | 5.4 | 18 | 25 | 53 | 88 | 46 | 17 | 4.5 | 4.3 | 18 | 26 | 25 | 39 |
| co | 421 | 1 | 1 | 1 | 1 | 1 | 1 | 1 | 490 | 265 | 374 | 835 | 419 | 885 |
| o3 | 14 | 25 | 14 | 5.5 | 5.4 | 5.3 | 5.3 | 3.8 | 5 | 0.85 | 1.8 | 5.7 | 18 | 32 |