Air Pollution in Harnāthpura: Real-time Air Quality Index and smog alert.
Pollution and air quality forecast for Harnāthpura. Today is Wednesday, May 13, 2026. The following air pollution values have been recorded for Harnāthpura:- particulate matter (PM10) suspended dust - 116 (Very Unhealthy)
- sulfur dioxide (SO2) - 20 (Good)
- particulate matter (PM2.5) dust - 72 (Unhealthy)
- carbon monoxide (CO) - 30 (Good)
- nitrogen dioxide (NO2) - 81 (Moderate)
- ozone (O3) - 38 (Good)

What is the air quality in Harnāthpura today? Is the air polluted in Harnāthpura?. Is there smog?
What is the level of PM10 today in Harnāthpura? (particulate matter (PM10) suspended dust)
The current level of particulate matter PM10 in Harnāthpura is:
116 (Very Unhealthy)
The highest PM10 values usually occur in month: 177 (May 2019).
The lowest value of particulate matter PM10 pollution in Harnāthpura is usually recorded in: August (57).
What is the level of SO2 pollution? (sulfur dioxide (SO2))
20 (Good)
What is the current level of PM2.5 in Harnāthpura? (particulate matter (PM2.5) dust)
Today's PM2.5 level is:
72 (Unhealthy)
For comparison, the highest level of PM2.5 in Harnāthpura in the last 7 days was: 66 (Monday, October 31, 2022) and the lowest: 66 (Monday, October 31, 2022).
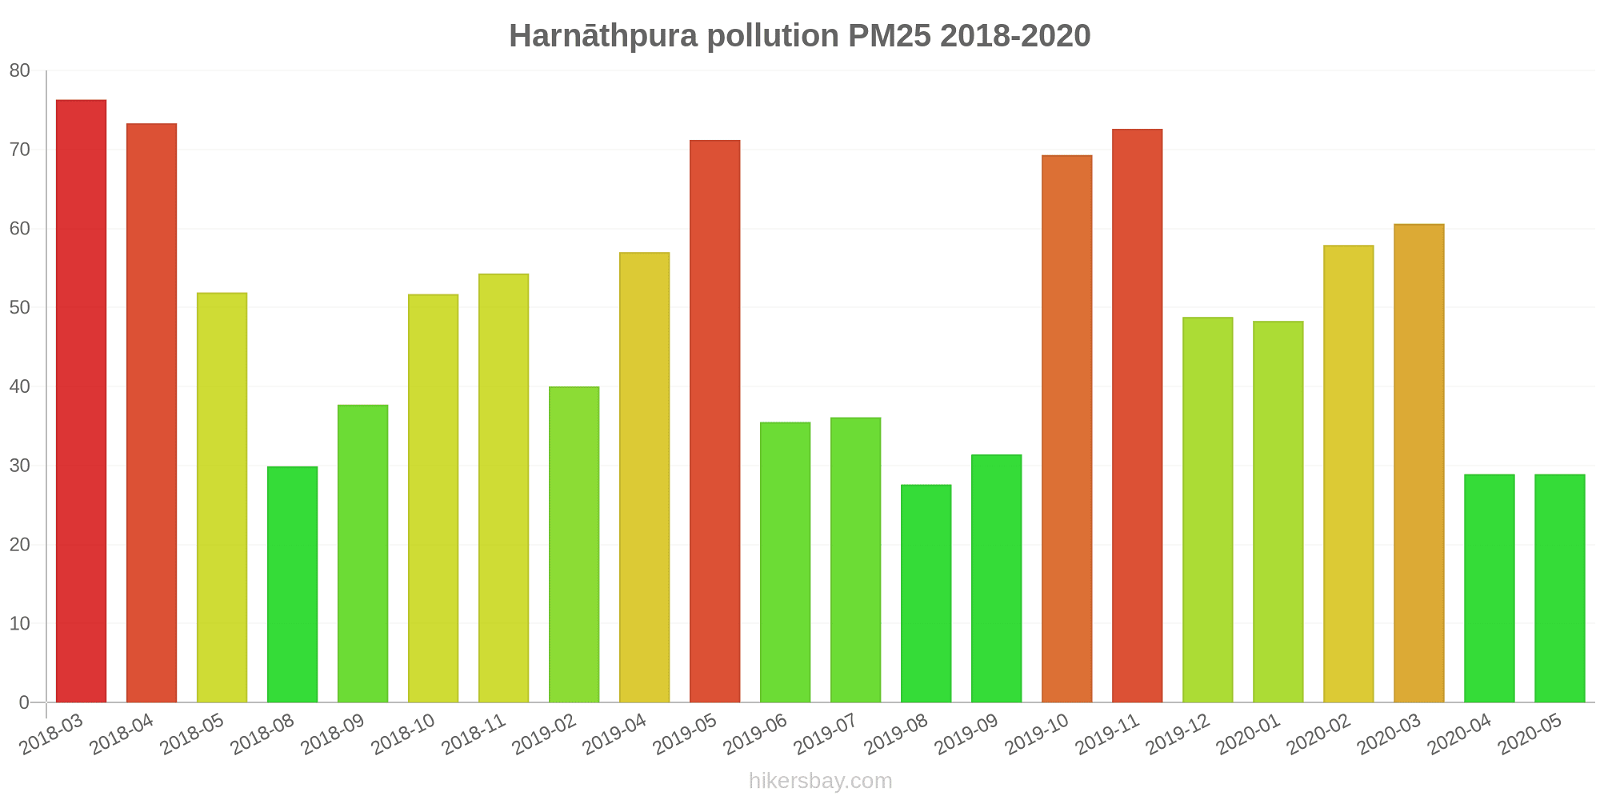
The highest PM2.5 values were recorded: 76 (March 2018).
The lowest level of particulate matter PM2.5 pollution occurs in month: August (28).
How high is the CO level? (carbon monoxide (CO))
30 (Good)
How high is the level of NO2? (nitrogen dioxide (NO2))
81 (Moderate)
How is the O3 level today in Harnāthpura? (ozone (O3))
38 (Good)
Current data Monday, October 31, 2022, 1:45 AM
PM10 116 (Very Unhealthy)
SO2 20 (Good)
PM2,5 72 (Unhealthy)
CO 30 (Good)
NO2 81 (Moderate)
O3 38 (Good)
Data on air pollution from recent days in Harnāthpura
index
2022-10-31
pm10
109
Unhealthy
so2
16
Good
pm25
66
Unhealthy
co
125
Good
no2
91
Moderate
o3
42
Good
data source »
Air pollution in Harnāthpura from March 2018 to May 2020
index
2020-05
2020-04
2020-03
2020-02
2020-01
2019-12
2019-11
2019-10
2019-09
2019-08
2019-07
2019-06
2019-05
2019-04
2019-02
2018-11
2018-10
2018-09
2018-08
2018-05
2018-04
2018-03
pm25
29 (Moderate)
29 (Moderate)
61 (Unhealthy)
58 (Unhealthy)
48 (Unhealthy for Sensitive Groups)
49 (Unhealthy for Sensitive Groups)
73 (Unhealthy)
69 (Unhealthy)
31 (Moderate)
28 (Moderate)
36 (Unhealthy for Sensitive Groups)
36 (Unhealthy for Sensitive Groups)
71 (Unhealthy)
57 (Unhealthy)
40 (Unhealthy for Sensitive Groups)
54 (Unhealthy for Sensitive Groups)
52 (Unhealthy for Sensitive Groups)
38 (Unhealthy for Sensitive Groups)
30 (Moderate)
52 (Unhealthy for Sensitive Groups)
73 (Unhealthy)
76 (Very Unhealthy)
pm10
78 (Unhealthy for Sensitive Groups)
77 (Unhealthy for Sensitive Groups)
78 (Unhealthy for Sensitive Groups)
117 (Very Unhealthy)
97 (Unhealthy)
126 (Very Unhealthy)
138 (Very Unhealthy)
138 (Very Unhealthy)
68 (Unhealthy for Sensitive Groups)
57 (Unhealthy for Sensitive Groups)
72 (Unhealthy for Sensitive Groups)
89 (Unhealthy)
177 (Very bad Hazardous)
152 (Very bad Hazardous)
78 (Unhealthy for Sensitive Groups)
128 (Very Unhealthy)
82 (Unhealthy)
69 (Unhealthy for Sensitive Groups)
83 (Unhealthy)
174 (Very bad Hazardous)
150 (Very bad Hazardous)
115 (Very Unhealthy)
no2
14 (Good)
14 (Good)
26 (Good)
42 (Moderate)
41 (Moderate)
47 (Moderate)
29 (Good)
30 (Good)
18 (Good)
18 (Good)
16 (Good)
20 (Good)
16 (Good)
19 (Good)
25 (Good)
51 (Moderate)
33 (Good)
13 (Good)
12 (Good)
29 (Good)
43 (Moderate)
51 (Moderate)
so2
16 (Good)
14 (Good)
14 (Good)
14 (Good)
13 (Good)
16 (Good)
12 (Good)
15 (Good)
12 (Good)
11 (Good)
11 (Good)
19 (Good)
14 (Good)
18 (Good)
9.9 (Good)
13 (Good)
13 (Good)
13 (Good)
8.8 (Good)
9.3 (Good)
8.5 (Good)
14 (Good)
co
673 (Good)
509 (Good)
696 (Good)
1 (Good)
931 (Good)
1 (Good)
937 (Good)
1 (Good)
572 (Good)
417 (Good)
455 (Good)
711 (Good)
704 (Good)
867 (Good)
1 (Good)
1 (Good)
1 (Good)
701 (Good)
510 (Good)
1 (Good)
13 (Good)
32 (Good)
o3
59 (Good)
63 (Good)
77 (Moderate)
65 (Good)
56 (Good)
46 (Good)
47 (Good)
38 (Good)
30 (Good)
23 (Good)
31 (Good)
57 (Good)
69 (Good)
65 (Good)
60 (Good)
35 (Good)
52 (Good)
26 (Good)
26 (Good)
70 (Good)
74 (Moderate)
67 (Good)
data source »
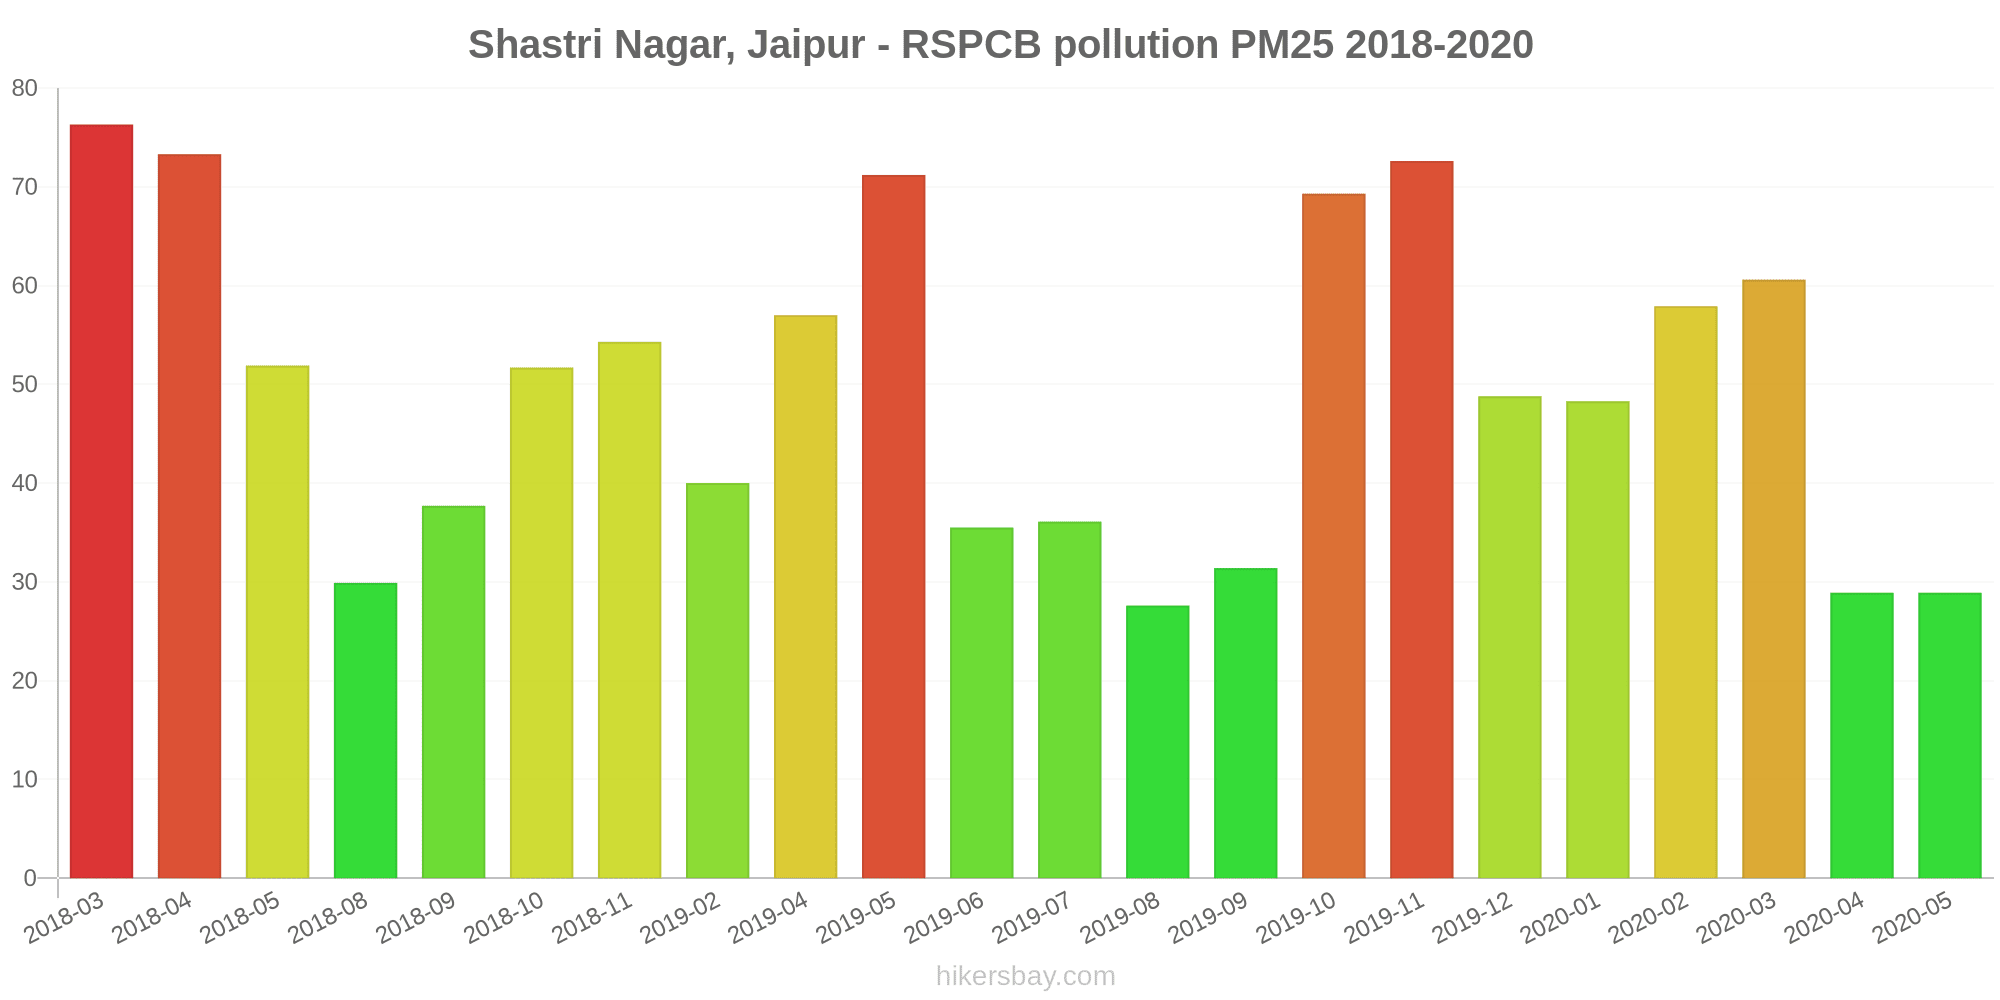
Shastri Nagar, Jaipur - RSPCB
Monday, October 31, 2022, 1:45 AM
PM10 116 (Very Unhealthy)
particulate matter (PM10) suspended dust
SO2 20 (Good)
sulfur dioxide (SO2)
PM2,5 72 (Unhealthy)
particulate matter (PM2.5) dust
CO 30 (Good)
carbon monoxide (CO)
NO2 81 (Moderate)
nitrogen dioxide (NO2)
O3 38 (Good)
ozone (O3)
Shastri Nagar, Jaipur - RSPCB
index
2022-10-31
pm10
109
so2
16
pm25
66
co
125
no2
91
o3
42
Shastri Nagar, Jaipur - RSPCB
2018-03 2020-05

index
2020-05
2020-04
2020-03
2020-02
2020-01
2019-12
2019-11
2019-10
2019-09
2019-08
2019-07
2019-06
2019-05
2019-04
2019-02
2018-11
2018-10
2018-09
2018-08
2018-05
2018-04
2018-03
pm25
29
29
61
58
48
49
73
69
31
28
36
36
71
57
40
54
52
38
30
52
73
76
pm10
78
77
78
117
97
126
138
138
68
57
72
89
177
152
78
128
82
69
83
174
150
115
no2
14
14
26
42
41
47
29
30
18
18
16
20
16
19
25
51
33
13
12
29
43
51
so2
16
14
14
14
13
16
12
15
12
11
11
19
14
18
9.9
13
13
13
8.8
9.3
8.5
14
co
673
509
696
1
931
1
937
1
572
417
455
711
704
867
1
1
1
701
510
1
13
32
o3
59
63
77
65
56
46
47
38
30
23
31
57
69
65
60
35
52
26
26
70
74
67
* Pollution data source:
https://openaq.org
(caaqm)
The data is licensed under CC-By 4.0
PM10 116 (Very Unhealthy)
SO2 20 (Good)
PM2,5 72 (Unhealthy)
CO 30 (Good)
NO2 81 (Moderate)
O3 38 (Good)
Data on air pollution from recent days in Harnāthpura
| index | 2022-10-31 |
|---|---|
| pm10 | 109 Unhealthy |
| so2 | 16 Good |
| pm25 | 66 Unhealthy |
| co | 125 Good |
| no2 | 91 Moderate |
| o3 | 42 Good |

| index | 2020-05 | 2020-04 | 2020-03 | 2020-02 | 2020-01 | 2019-12 | 2019-11 | 2019-10 | 2019-09 | 2019-08 | 2019-07 | 2019-06 | 2019-05 | 2019-04 | 2019-02 | 2018-11 | 2018-10 | 2018-09 | 2018-08 | 2018-05 | 2018-04 | 2018-03 |
|---|---|---|---|---|---|---|---|---|---|---|---|---|---|---|---|---|---|---|---|---|---|---|
| pm25 | 29 (Moderate) | 29 (Moderate) | 61 (Unhealthy) | 58 (Unhealthy) | 48 (Unhealthy for Sensitive Groups) | 49 (Unhealthy for Sensitive Groups) | 73 (Unhealthy) | 69 (Unhealthy) | 31 (Moderate) | 28 (Moderate) | 36 (Unhealthy for Sensitive Groups) | 36 (Unhealthy for Sensitive Groups) | 71 (Unhealthy) | 57 (Unhealthy) | 40 (Unhealthy for Sensitive Groups) | 54 (Unhealthy for Sensitive Groups) | 52 (Unhealthy for Sensitive Groups) | 38 (Unhealthy for Sensitive Groups) | 30 (Moderate) | 52 (Unhealthy for Sensitive Groups) | 73 (Unhealthy) | 76 (Very Unhealthy) |
| pm10 | 78 (Unhealthy for Sensitive Groups) | 77 (Unhealthy for Sensitive Groups) | 78 (Unhealthy for Sensitive Groups) | 117 (Very Unhealthy) | 97 (Unhealthy) | 126 (Very Unhealthy) | 138 (Very Unhealthy) | 138 (Very Unhealthy) | 68 (Unhealthy for Sensitive Groups) | 57 (Unhealthy for Sensitive Groups) | 72 (Unhealthy for Sensitive Groups) | 89 (Unhealthy) | 177 (Very bad Hazardous) | 152 (Very bad Hazardous) | 78 (Unhealthy for Sensitive Groups) | 128 (Very Unhealthy) | 82 (Unhealthy) | 69 (Unhealthy for Sensitive Groups) | 83 (Unhealthy) | 174 (Very bad Hazardous) | 150 (Very bad Hazardous) | 115 (Very Unhealthy) |
| no2 | 14 (Good) | 14 (Good) | 26 (Good) | 42 (Moderate) | 41 (Moderate) | 47 (Moderate) | 29 (Good) | 30 (Good) | 18 (Good) | 18 (Good) | 16 (Good) | 20 (Good) | 16 (Good) | 19 (Good) | 25 (Good) | 51 (Moderate) | 33 (Good) | 13 (Good) | 12 (Good) | 29 (Good) | 43 (Moderate) | 51 (Moderate) |
| so2 | 16 (Good) | 14 (Good) | 14 (Good) | 14 (Good) | 13 (Good) | 16 (Good) | 12 (Good) | 15 (Good) | 12 (Good) | 11 (Good) | 11 (Good) | 19 (Good) | 14 (Good) | 18 (Good) | 9.9 (Good) | 13 (Good) | 13 (Good) | 13 (Good) | 8.8 (Good) | 9.3 (Good) | 8.5 (Good) | 14 (Good) |
| co | 673 (Good) | 509 (Good) | 696 (Good) | 1 (Good) | 931 (Good) | 1 (Good) | 937 (Good) | 1 (Good) | 572 (Good) | 417 (Good) | 455 (Good) | 711 (Good) | 704 (Good) | 867 (Good) | 1 (Good) | 1 (Good) | 1 (Good) | 701 (Good) | 510 (Good) | 1 (Good) | 13 (Good) | 32 (Good) |
| o3 | 59 (Good) | 63 (Good) | 77 (Moderate) | 65 (Good) | 56 (Good) | 46 (Good) | 47 (Good) | 38 (Good) | 30 (Good) | 23 (Good) | 31 (Good) | 57 (Good) | 69 (Good) | 65 (Good) | 60 (Good) | 35 (Good) | 52 (Good) | 26 (Good) | 26 (Good) | 70 (Good) | 74 (Moderate) | 67 (Good) |
PM10 116 (Very Unhealthy)
particulate matter (PM10) suspended dustSO2 20 (Good)
sulfur dioxide (SO2)PM2,5 72 (Unhealthy)
particulate matter (PM2.5) dustCO 30 (Good)
carbon monoxide (CO)NO2 81 (Moderate)
nitrogen dioxide (NO2)O3 38 (Good)
ozone (O3)Shastri Nagar, Jaipur - RSPCB
| index | 2022-10-31 |
|---|---|
| pm10 | 109 |
| so2 | 16 |
| pm25 | 66 |
| co | 125 |
| no2 | 91 |
| o3 | 42 |
Shastri Nagar, Jaipur - RSPCB
| index | 2020-05 | 2020-04 | 2020-03 | 2020-02 | 2020-01 | 2019-12 | 2019-11 | 2019-10 | 2019-09 | 2019-08 | 2019-07 | 2019-06 | 2019-05 | 2019-04 | 2019-02 | 2018-11 | 2018-10 | 2018-09 | 2018-08 | 2018-05 | 2018-04 | 2018-03 |
|---|---|---|---|---|---|---|---|---|---|---|---|---|---|---|---|---|---|---|---|---|---|---|
| pm25 | 29 | 29 | 61 | 58 | 48 | 49 | 73 | 69 | 31 | 28 | 36 | 36 | 71 | 57 | 40 | 54 | 52 | 38 | 30 | 52 | 73 | 76 |
| pm10 | 78 | 77 | 78 | 117 | 97 | 126 | 138 | 138 | 68 | 57 | 72 | 89 | 177 | 152 | 78 | 128 | 82 | 69 | 83 | 174 | 150 | 115 |
| no2 | 14 | 14 | 26 | 42 | 41 | 47 | 29 | 30 | 18 | 18 | 16 | 20 | 16 | 19 | 25 | 51 | 33 | 13 | 12 | 29 | 43 | 51 |
| so2 | 16 | 14 | 14 | 14 | 13 | 16 | 12 | 15 | 12 | 11 | 11 | 19 | 14 | 18 | 9.9 | 13 | 13 | 13 | 8.8 | 9.3 | 8.5 | 14 |
| co | 673 | 509 | 696 | 1 | 931 | 1 | 937 | 1 | 572 | 417 | 455 | 711 | 704 | 867 | 1 | 1 | 1 | 701 | 510 | 1 | 13 | 32 |
| o3 | 59 | 63 | 77 | 65 | 56 | 46 | 47 | 38 | 30 | 23 | 31 | 57 | 69 | 65 | 60 | 35 | 52 | 26 | 26 | 70 | 74 | 67 |