Air Pollution in Shāhpur: Real-time Air Quality Index and smog alert.
Pollution and air quality forecast for Shāhpur. Today is Wednesday, May 13, 2026. The following air pollution values have been recorded for Shāhpur:- nitrogen dioxide (NO2) - 4 (Good)
- sulfur dioxide (SO2) - 5 (Good)
- carbon monoxide (CO) - 1060 (Good)
- particulate matter (PM2.5) dust - 70 (Unhealthy)
- particulate matter (PM10) suspended dust - 62 (Unhealthy for Sensitive Groups)

What is the air quality in Shāhpur today? Is the air polluted in Shāhpur?. Is there smog?
How high is the level of NO2? (nitrogen dioxide (NO2))
4 (Good)
What is the level of SO2 pollution? (sulfur dioxide (SO2))
5 (Good)
How high is the CO level? (carbon monoxide (CO))
1060 (Good)
What is the current level of PM2.5 in Shāhpur? (particulate matter (PM2.5) dust)
Today's PM2.5 level is:
70 (Unhealthy)
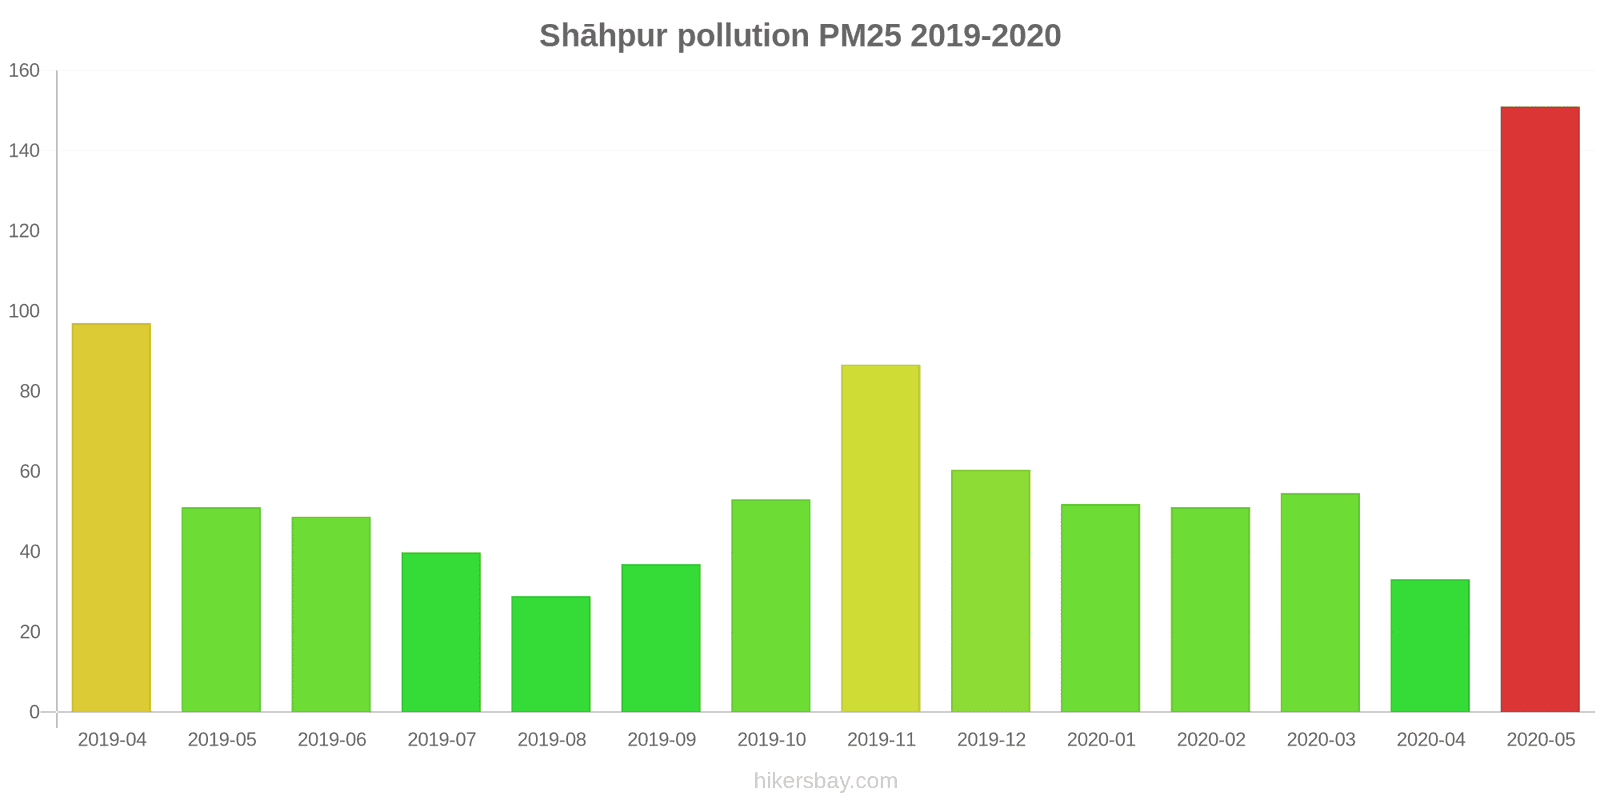
For comparison, the highest level of PM2.5 in Shāhpur in the last 7 days was: 73 (Monday, October 31, 2022) and the lowest: 73 (Monday, October 31, 2022).
The highest PM2.5 values were recorded: 151 (May 2020).
The lowest level of particulate matter PM2.5 pollution occurs in month: August (29).
What is the level of PM10 today in Shāhpur? (particulate matter (PM10) suspended dust)
The current level of particulate matter PM10 in Shāhpur is:
62 (Unhealthy for Sensitive Groups)
The highest PM10 values usually occur in month: 173 (April 2019).
The lowest value of particulate matter PM10 pollution in Shāhpur is usually recorded in: April (51).
Current data Monday, October 31, 2022, 1:45 AM
NO2 4 (Good)
SO2 5 (Good)
CO 1060 (Good)
PM2,5 70 (Unhealthy)
PM10 62 (Unhealthy for Sensitive Groups)
Data on air pollution from recent days in Shāhpur
index
2022-10-31
no2
4
Good
so2
5
Good
co
1225
Good
pm25
73
Unhealthy
pm10
73
Unhealthy for Sensitive Groups
data source »
Air pollution in Shāhpur from April 2019 to May 2020
index
2020-05
2020-04
2020-03
2020-02
2020-01
2019-12
2019-11
2019-10
2019-09
2019-08
2019-07
2019-06
2019-05
2019-04
pm25
151 (Very bad Hazardous)
33 (Moderate)
55 (Unhealthy for Sensitive Groups)
51 (Unhealthy for Sensitive Groups)
52 (Unhealthy for Sensitive Groups)
60 (Unhealthy)
87 (Very Unhealthy)
53 (Unhealthy for Sensitive Groups)
37 (Unhealthy for Sensitive Groups)
29 (Moderate)
40 (Unhealthy for Sensitive Groups)
49 (Unhealthy for Sensitive Groups)
51 (Unhealthy for Sensitive Groups)
97 (Very Unhealthy)
pm10
78 (Unhealthy for Sensitive Groups)
51 (Unhealthy for Sensitive Groups)
83 (Unhealthy)
109 (Unhealthy)
100 (Unhealthy)
106 (Unhealthy)
158 (Very bad Hazardous)
97 (Unhealthy)
80 (Unhealthy for Sensitive Groups)
63 (Unhealthy for Sensitive Groups)
72 (Unhealthy for Sensitive Groups)
108 (Unhealthy)
75 (Unhealthy for Sensitive Groups)
173 (Very bad Hazardous)
no2
7.3 (Good)
9.7 (Good)
9 (Good)
4.1 (Good)
5 (Good)
5.2 (Good)
3.6 (Good)
6.4 (Good)
8.5 (Good)
11 (Good)
6.3 (Good)
1.1 (Good)
8.1 (Good)
8 (Good)
so2
8.2 (Good)
8.3 (Good)
8.2 (Good)
10 (Good)
10 (Good)
9.8 (Good)
9.8 (Good)
9.5 (Good)
8.3 (Good)
7.8 (Good)
5 (Good)
6.6 (Good)
8 (Good)
8.6 (Good)
co
386 (Good)
359 (Good)
347 (Good)
232 (Good)
229 (Good)
219 (Good)
226 (Good)
227 (Good)
238 (Good)
153 (Good)
184 (Good)
201 (Good)
236 (Good)
217 (Good)
data source »
Ratanpura, Rupnagar - Ambuja Cements
Monday, October 31, 2022, 1:45 AM
NO2 3.8 (Good)
nitrogen dioxide (NO2)
SO2 4.7 (Good)
sulfur dioxide (SO2)
CO 1060 (Good)
carbon monoxide (CO)
PM2,5 70 (Unhealthy)
particulate matter (PM2.5) dust
PM10 62 (Unhealthy for Sensitive Groups)
particulate matter (PM10) suspended dust
Ratanpura, Rupnagar - Ambuja Cements
index
2022-10-31
no2
4.5
so2
4.7
co
1225
pm25
73
pm10
73
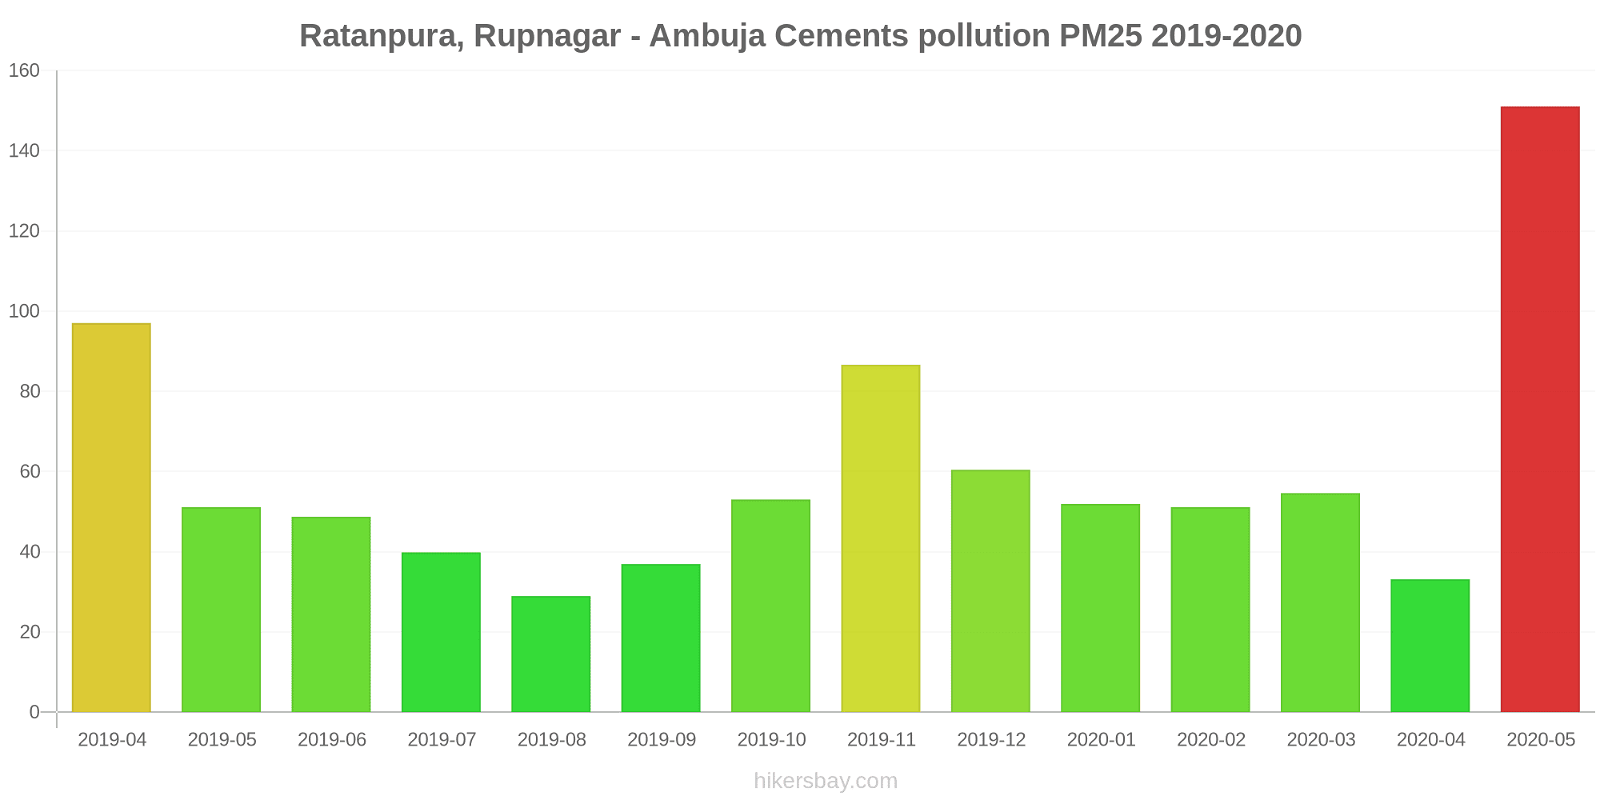
Ratanpura, Rupnagar - Ambuja Cements
2019-04 2020-05
index
2020-05
2020-04
2020-03
2020-02
2020-01
2019-12
2019-11
2019-10
2019-09
2019-08
2019-07
2019-06
2019-05
2019-04
pm25
151
33
55
51
52
60
87
53
37
29
40
49
51
97
pm10
78
51
83
109
100
106
158
97
80
63
72
108
75
173
no2
7.3
9.7
9
4.1
5
5.2
3.6
6.4
8.5
11
6.3
1.1
8.1
8
so2
8.2
8.3
8.2
10
10
9.8
9.8
9.5
8.3
7.8
5
6.6
8
8.6
co
386
359
347
232
229
219
226
227
238
153
184
201
236
217
* Pollution data source:
https://openaq.org
(caaqm)
The data is licensed under CC-By 4.0
NO2 4 (Good)
SO2 5 (Good)
CO 1060 (Good)
PM2,5 70 (Unhealthy)
PM10 62 (Unhealthy for Sensitive Groups)
Data on air pollution from recent days in Shāhpur
| index | 2022-10-31 |
|---|---|
| no2 | 4 Good |
| so2 | 5 Good |
| co | 1225 Good |
| pm25 | 73 Unhealthy |
| pm10 | 73 Unhealthy for Sensitive Groups |

| index | 2020-05 | 2020-04 | 2020-03 | 2020-02 | 2020-01 | 2019-12 | 2019-11 | 2019-10 | 2019-09 | 2019-08 | 2019-07 | 2019-06 | 2019-05 | 2019-04 |
|---|---|---|---|---|---|---|---|---|---|---|---|---|---|---|
| pm25 | 151 (Very bad Hazardous) | 33 (Moderate) | 55 (Unhealthy for Sensitive Groups) | 51 (Unhealthy for Sensitive Groups) | 52 (Unhealthy for Sensitive Groups) | 60 (Unhealthy) | 87 (Very Unhealthy) | 53 (Unhealthy for Sensitive Groups) | 37 (Unhealthy for Sensitive Groups) | 29 (Moderate) | 40 (Unhealthy for Sensitive Groups) | 49 (Unhealthy for Sensitive Groups) | 51 (Unhealthy for Sensitive Groups) | 97 (Very Unhealthy) |
| pm10 | 78 (Unhealthy for Sensitive Groups) | 51 (Unhealthy for Sensitive Groups) | 83 (Unhealthy) | 109 (Unhealthy) | 100 (Unhealthy) | 106 (Unhealthy) | 158 (Very bad Hazardous) | 97 (Unhealthy) | 80 (Unhealthy for Sensitive Groups) | 63 (Unhealthy for Sensitive Groups) | 72 (Unhealthy for Sensitive Groups) | 108 (Unhealthy) | 75 (Unhealthy for Sensitive Groups) | 173 (Very bad Hazardous) |
| no2 | 7.3 (Good) | 9.7 (Good) | 9 (Good) | 4.1 (Good) | 5 (Good) | 5.2 (Good) | 3.6 (Good) | 6.4 (Good) | 8.5 (Good) | 11 (Good) | 6.3 (Good) | 1.1 (Good) | 8.1 (Good) | 8 (Good) |
| so2 | 8.2 (Good) | 8.3 (Good) | 8.2 (Good) | 10 (Good) | 10 (Good) | 9.8 (Good) | 9.8 (Good) | 9.5 (Good) | 8.3 (Good) | 7.8 (Good) | 5 (Good) | 6.6 (Good) | 8 (Good) | 8.6 (Good) |
| co | 386 (Good) | 359 (Good) | 347 (Good) | 232 (Good) | 229 (Good) | 219 (Good) | 226 (Good) | 227 (Good) | 238 (Good) | 153 (Good) | 184 (Good) | 201 (Good) | 236 (Good) | 217 (Good) |
NO2 3.8 (Good)
nitrogen dioxide (NO2)SO2 4.7 (Good)
sulfur dioxide (SO2)CO 1060 (Good)
carbon monoxide (CO)PM2,5 70 (Unhealthy)
particulate matter (PM2.5) dustPM10 62 (Unhealthy for Sensitive Groups)
particulate matter (PM10) suspended dustRatanpura, Rupnagar - Ambuja Cements
| index | 2022-10-31 |
|---|---|
| no2 | 4.5 |
| so2 | 4.7 |
| co | 1225 |
| pm25 | 73 |
| pm10 | 73 |
Ratanpura, Rupnagar - Ambuja Cements

| index | 2020-05 | 2020-04 | 2020-03 | 2020-02 | 2020-01 | 2019-12 | 2019-11 | 2019-10 | 2019-09 | 2019-08 | 2019-07 | 2019-06 | 2019-05 | 2019-04 |
|---|---|---|---|---|---|---|---|---|---|---|---|---|---|---|
| pm25 | 151 | 33 | 55 | 51 | 52 | 60 | 87 | 53 | 37 | 29 | 40 | 49 | 51 | 97 |
| pm10 | 78 | 51 | 83 | 109 | 100 | 106 | 158 | 97 | 80 | 63 | 72 | 108 | 75 | 173 |
| no2 | 7.3 | 9.7 | 9 | 4.1 | 5 | 5.2 | 3.6 | 6.4 | 8.5 | 11 | 6.3 | 1.1 | 8.1 | 8 |
| so2 | 8.2 | 8.3 | 8.2 | 10 | 10 | 9.8 | 9.8 | 9.5 | 8.3 | 7.8 | 5 | 6.6 | 8 | 8.6 |
| co | 386 | 359 | 347 | 232 | 229 | 219 | 226 | 227 | 238 | 153 | 184 | 201 | 236 | 217 |