Air Pollution in CBI: Real-time Air Quality Index and smog alert.
Pollution and air quality forecast for CBI. Today is Friday, May 15, 2026. The following air pollution values have been recorded for CBI:- particulate matter (PM10) suspended dust - 94 (Unhealthy)
- carbon monoxide (CO) - 610 (Good)
- particulate matter (PM2.5) dust - 67 (Unhealthy)
- ozone (O3) - 17 (Good)
- nitrogen dioxide (NO2) - 27 (Good)
- sulfur dioxide (SO2) - 3 (Good)

What is the air quality in CBI today? Is the air polluted in CBI?. Is there smog?
What is the level of PM10 today in CBI? (particulate matter (PM10) suspended dust)
The current level of particulate matter PM10 in CBI is:
94 (Unhealthy)
The highest PM10 values usually occur in month: 101 (April 2019).
The lowest value of particulate matter PM10 pollution in CBI is usually recorded in: August (26).
How high is the CO level? (carbon monoxide (CO))
610 (Good)
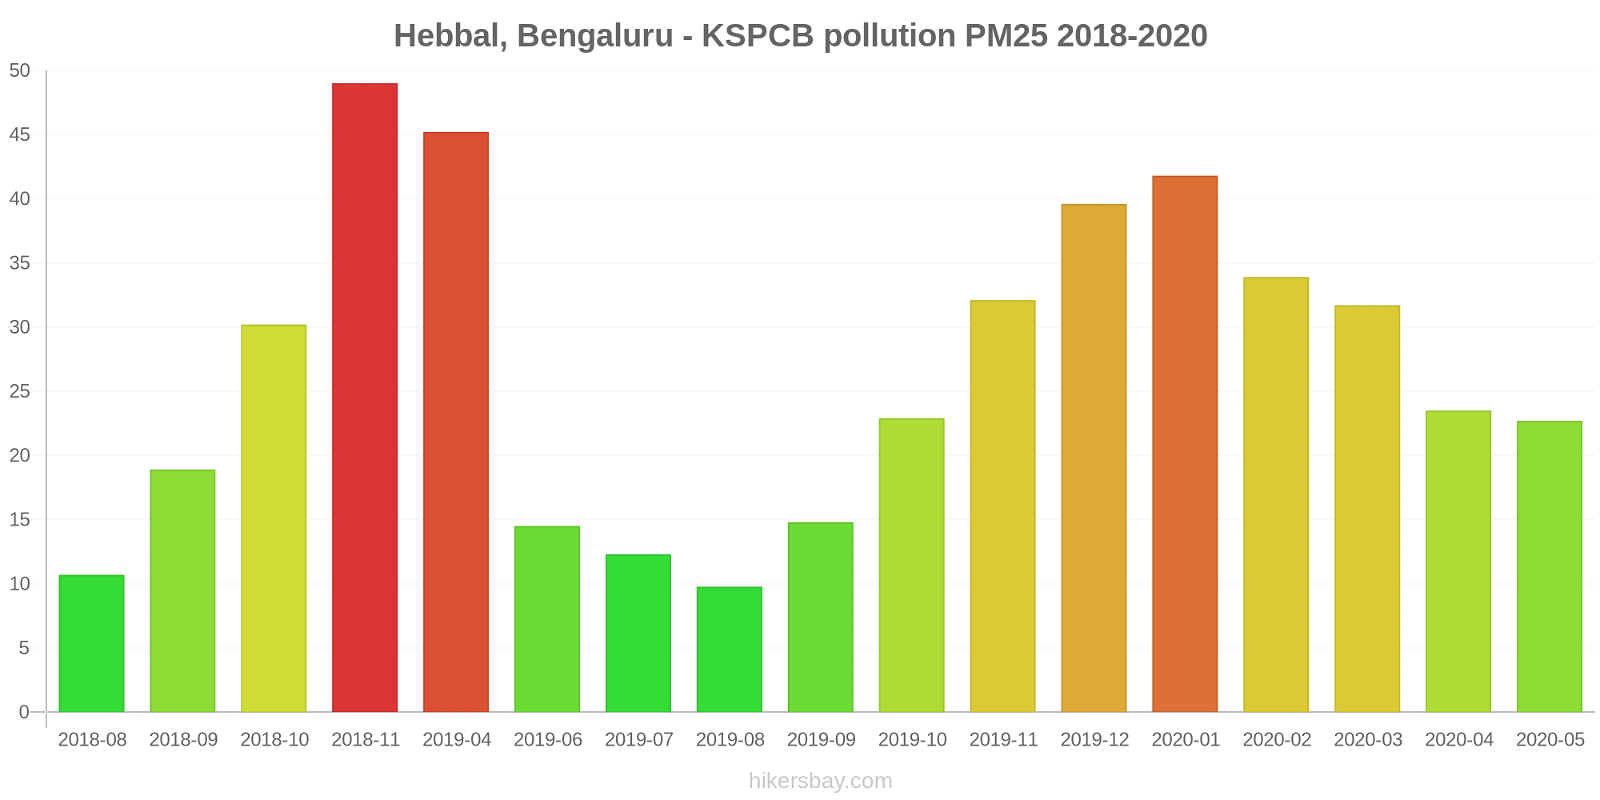
What is the current level of PM2.5 in CBI? (particulate matter (PM2.5) dust)
Today's PM2.5 level is:
67 (Unhealthy)
For comparison, the highest level of PM2.5 in CBI in the last 7 days was: 69 (Monday, October 31, 2022) and the lowest: 69 (Monday, October 31, 2022).
The highest PM2.5 values were recorded: 49 (November 2018).
The lowest level of particulate matter PM2.5 pollution occurs in month: August (9.8).
How is the O3 level today in CBI? (ozone (O3))
17 (Good)
How high is the level of NO2? (nitrogen dioxide (NO2))
27 (Good)
What is the level of SO2 pollution? (sulfur dioxide (SO2))
3 (Good)
Current data Monday, October 31, 2022, 2:00 AM
PM10 94 (Unhealthy)
CO 610 (Good)
PM2,5 67 (Unhealthy)
O3 17 (Good)
NO2 27 (Good)
SO2 3 (Good)
Data on air pollution from recent days in CBI
index
2022-10-31
pm10
94
Unhealthy
co
520
Good
pm25
69
Unhealthy
o3
19
Good
no2
25
Good
so2
3
Good
data source »
Air pollution in CBI from August 2018 to May 2020

index
2020-05
2020-04
2020-03
2020-02
2020-01
2019-12
2019-11
2019-10
2019-09
2019-08
2019-07
2019-06
2019-04
2018-11
2018-10
2018-09
2018-08
pm25
23 (Moderate)
24 (Moderate)
32 (Moderate)
34 (Moderate)
42 (Unhealthy for Sensitive Groups)
40 (Unhealthy for Sensitive Groups)
32 (Moderate)
23 (Moderate)
15 (Moderate)
9.8 (Good)
12 (Good)
15 (Moderate)
45 (Unhealthy for Sensitive Groups)
49 (Unhealthy for Sensitive Groups)
30 (Moderate)
19 (Moderate)
11 (Good)
pm10
62 (Unhealthy for Sensitive Groups)
48 (Moderate)
77 (Unhealthy for Sensitive Groups)
83 (Unhealthy)
86 (Unhealthy)
81 (Unhealthy)
71 (Unhealthy for Sensitive Groups)
44 (Moderate)
32 (Moderate)
26 (Moderate)
35 (Moderate)
43 (Moderate)
101 (Unhealthy)
89 (Unhealthy)
62 (Unhealthy for Sensitive Groups)
42 (Moderate)
29 (Moderate)
no2
3.2 (Good)
2.5 (Good)
6.9 (Good)
24 (Good)
34 (Good)
28 (Good)
23 (Good)
29 (Good)
13 (Good)
12 (Good)
8.6 (Good)
2.7 (Good)
37 (Good)
40 (Good)
22 (Good)
19 (Good)
7.6 (Good)
so2
9.4 (Good)
8.4 (Good)
8.7 (Good)
9.7 (Good)
11 (Good)
9.7 (Good)
8.3 (Good)
5.8 (Good)
9.1 (Good)
5.4 (Good)
3.4 (Good)
3.8 (Good)
3.6 (Good)
4.1 (Good)
3.5 (Good)
4.7 (Good)
3.9 (Good)
co
593 (Good)
590 (Good)
739 (Good)
809 (Good)
805 (Good)
876 (Good)
812 (Good)
738 (Good)
588 (Good)
565 (Good)
978 (Good)
510 (Good)
1 (Good)
1 (Good)
990 (Good)
700 (Good)
381 (Good)
o3
49 (Good)
48 (Good)
50 (Good)
40 (Good)
38 (Good)
27 (Good)
25 (Good)
27 (Good)
30 (Good)
22 (Good)
30 (Good)
31 (Good)
48 (Good)
16 (Good)
14 (Good)
23 (Good)
16 (Good)
data source »
Hebbal, Bengaluru - KSPCB
Monday, October 31, 2022, 2:00 AM
PM10 94 (Unhealthy)
particulate matter (PM10) suspended dust
CO 610 (Good)
carbon monoxide (CO)
PM2,5 67 (Unhealthy)
particulate matter (PM2.5) dust
O3 17 (Good)
ozone (O3)
NO2 27 (Good)
nitrogen dioxide (NO2)
SO2 3.2 (Good)
sulfur dioxide (SO2)
Hebbal, Bengaluru - KSPCB
index
2022-10-31
pm10
94
co
520
pm25
69
o3
19
no2
25
so2
3.1
Hebbal, Bengaluru - KSPCB
2018-08 2020-05
index
2020-05
2020-04
2020-03
2020-02
2020-01
2019-12
2019-11
2019-10
2019-09
2019-08
2019-07
2019-06
2019-04
2018-11
2018-10
2018-09
2018-08
pm25
23
24
32
34
42
40
32
23
15
9.8
12
15
45
49
30
19
11
pm10
62
48
77
83
86
81
71
44
32
26
35
43
101
89
62
42
29
no2
3.2
2.5
6.9
24
34
28
23
29
13
12
8.6
2.7
37
40
22
19
7.6
co
593
590
739
809
805
876
812
738
588
565
978
510
1
1
990
700
381
o3
49
48
50
40
38
27
25
27
30
22
30
31
48
16
14
23
16
so2
9.4
8.4
8.7
9.7
11
9.7
8.3
5.8
9.1
5.4
3.4
3.8
3.6
4.1
3.5
4.7
3.9
* Pollution data source:
https://openaq.org
(caaqm)
The data is licensed under CC-By 4.0
PM10 94 (Unhealthy)
CO 610 (Good)
PM2,5 67 (Unhealthy)
O3 17 (Good)
NO2 27 (Good)
SO2 3 (Good)
Data on air pollution from recent days in CBI
| index | 2022-10-31 |
|---|---|
| pm10 | 94 Unhealthy |
| co | 520 Good |
| pm25 | 69 Unhealthy |
| o3 | 19 Good |
| no2 | 25 Good |
| so2 | 3 Good |

| index | 2020-05 | 2020-04 | 2020-03 | 2020-02 | 2020-01 | 2019-12 | 2019-11 | 2019-10 | 2019-09 | 2019-08 | 2019-07 | 2019-06 | 2019-04 | 2018-11 | 2018-10 | 2018-09 | 2018-08 |
|---|---|---|---|---|---|---|---|---|---|---|---|---|---|---|---|---|---|
| pm25 | 23 (Moderate) | 24 (Moderate) | 32 (Moderate) | 34 (Moderate) | 42 (Unhealthy for Sensitive Groups) | 40 (Unhealthy for Sensitive Groups) | 32 (Moderate) | 23 (Moderate) | 15 (Moderate) | 9.8 (Good) | 12 (Good) | 15 (Moderate) | 45 (Unhealthy for Sensitive Groups) | 49 (Unhealthy for Sensitive Groups) | 30 (Moderate) | 19 (Moderate) | 11 (Good) |
| pm10 | 62 (Unhealthy for Sensitive Groups) | 48 (Moderate) | 77 (Unhealthy for Sensitive Groups) | 83 (Unhealthy) | 86 (Unhealthy) | 81 (Unhealthy) | 71 (Unhealthy for Sensitive Groups) | 44 (Moderate) | 32 (Moderate) | 26 (Moderate) | 35 (Moderate) | 43 (Moderate) | 101 (Unhealthy) | 89 (Unhealthy) | 62 (Unhealthy for Sensitive Groups) | 42 (Moderate) | 29 (Moderate) |
| no2 | 3.2 (Good) | 2.5 (Good) | 6.9 (Good) | 24 (Good) | 34 (Good) | 28 (Good) | 23 (Good) | 29 (Good) | 13 (Good) | 12 (Good) | 8.6 (Good) | 2.7 (Good) | 37 (Good) | 40 (Good) | 22 (Good) | 19 (Good) | 7.6 (Good) |
| so2 | 9.4 (Good) | 8.4 (Good) | 8.7 (Good) | 9.7 (Good) | 11 (Good) | 9.7 (Good) | 8.3 (Good) | 5.8 (Good) | 9.1 (Good) | 5.4 (Good) | 3.4 (Good) | 3.8 (Good) | 3.6 (Good) | 4.1 (Good) | 3.5 (Good) | 4.7 (Good) | 3.9 (Good) |
| co | 593 (Good) | 590 (Good) | 739 (Good) | 809 (Good) | 805 (Good) | 876 (Good) | 812 (Good) | 738 (Good) | 588 (Good) | 565 (Good) | 978 (Good) | 510 (Good) | 1 (Good) | 1 (Good) | 990 (Good) | 700 (Good) | 381 (Good) |
| o3 | 49 (Good) | 48 (Good) | 50 (Good) | 40 (Good) | 38 (Good) | 27 (Good) | 25 (Good) | 27 (Good) | 30 (Good) | 22 (Good) | 30 (Good) | 31 (Good) | 48 (Good) | 16 (Good) | 14 (Good) | 23 (Good) | 16 (Good) |
PM10 94 (Unhealthy)
particulate matter (PM10) suspended dustCO 610 (Good)
carbon monoxide (CO)PM2,5 67 (Unhealthy)
particulate matter (PM2.5) dustO3 17 (Good)
ozone (O3)NO2 27 (Good)
nitrogen dioxide (NO2)SO2 3.2 (Good)
sulfur dioxide (SO2)Hebbal, Bengaluru - KSPCB
| index | 2022-10-31 |
|---|---|
| pm10 | 94 |
| co | 520 |
| pm25 | 69 |
| o3 | 19 |
| no2 | 25 |
| so2 | 3.1 |
Hebbal, Bengaluru - KSPCB

| index | 2020-05 | 2020-04 | 2020-03 | 2020-02 | 2020-01 | 2019-12 | 2019-11 | 2019-10 | 2019-09 | 2019-08 | 2019-07 | 2019-06 | 2019-04 | 2018-11 | 2018-10 | 2018-09 | 2018-08 |
|---|---|---|---|---|---|---|---|---|---|---|---|---|---|---|---|---|---|
| pm25 | 23 | 24 | 32 | 34 | 42 | 40 | 32 | 23 | 15 | 9.8 | 12 | 15 | 45 | 49 | 30 | 19 | 11 |
| pm10 | 62 | 48 | 77 | 83 | 86 | 81 | 71 | 44 | 32 | 26 | 35 | 43 | 101 | 89 | 62 | 42 | 29 |
| no2 | 3.2 | 2.5 | 6.9 | 24 | 34 | 28 | 23 | 29 | 13 | 12 | 8.6 | 2.7 | 37 | 40 | 22 | 19 | 7.6 |
| co | 593 | 590 | 739 | 809 | 805 | 876 | 812 | 738 | 588 | 565 | 978 | 510 | 1 | 1 | 990 | 700 | 381 |
| o3 | 49 | 48 | 50 | 40 | 38 | 27 | 25 | 27 | 30 | 22 | 30 | 31 | 48 | 16 | 14 | 23 | 16 |
| so2 | 9.4 | 8.4 | 8.7 | 9.7 | 11 | 9.7 | 8.3 | 5.8 | 9.1 | 5.4 | 3.4 | 3.8 | 3.6 | 4.1 | 3.5 | 4.7 | 3.9 |