Air Pollution in ByatarayanaPura: Real-time Air Quality Index and smog alert.
Pollution and air quality forecast for ByatarayanaPura. Today is Wednesday, May 13, 2026. The following air pollution values have been recorded for ByatarayanaPura:- sulfur dioxide (SO2) - 4 (Good)
- particulate matter (PM2.5) dust - 114 (Very bad Hazardous)
- ozone (O3) - 6 (Good)
- nitrogen dioxide (NO2) - 20 (Good)
- carbon monoxide (CO) - 1 (Good)
- particulate matter (PM10) suspended dust - 170 (Very bad Hazardous)

What is the air quality in ByatarayanaPura today? Is the air polluted in ByatarayanaPura?. Is there smog?
What is the level of SO2 pollution? (sulfur dioxide (SO2))
4 (Good)
What is the current level of PM2.5 in ByatarayanaPura? (particulate matter (PM2.5) dust)
Today's PM2.5 level is:
114 (Very bad Hazardous)
For comparison, the highest level of PM2.5 in ByatarayanaPura in the last 7 days was: 102 (Monday, October 31, 2022) and the lowest: 102 (Monday, October 31, 2022).
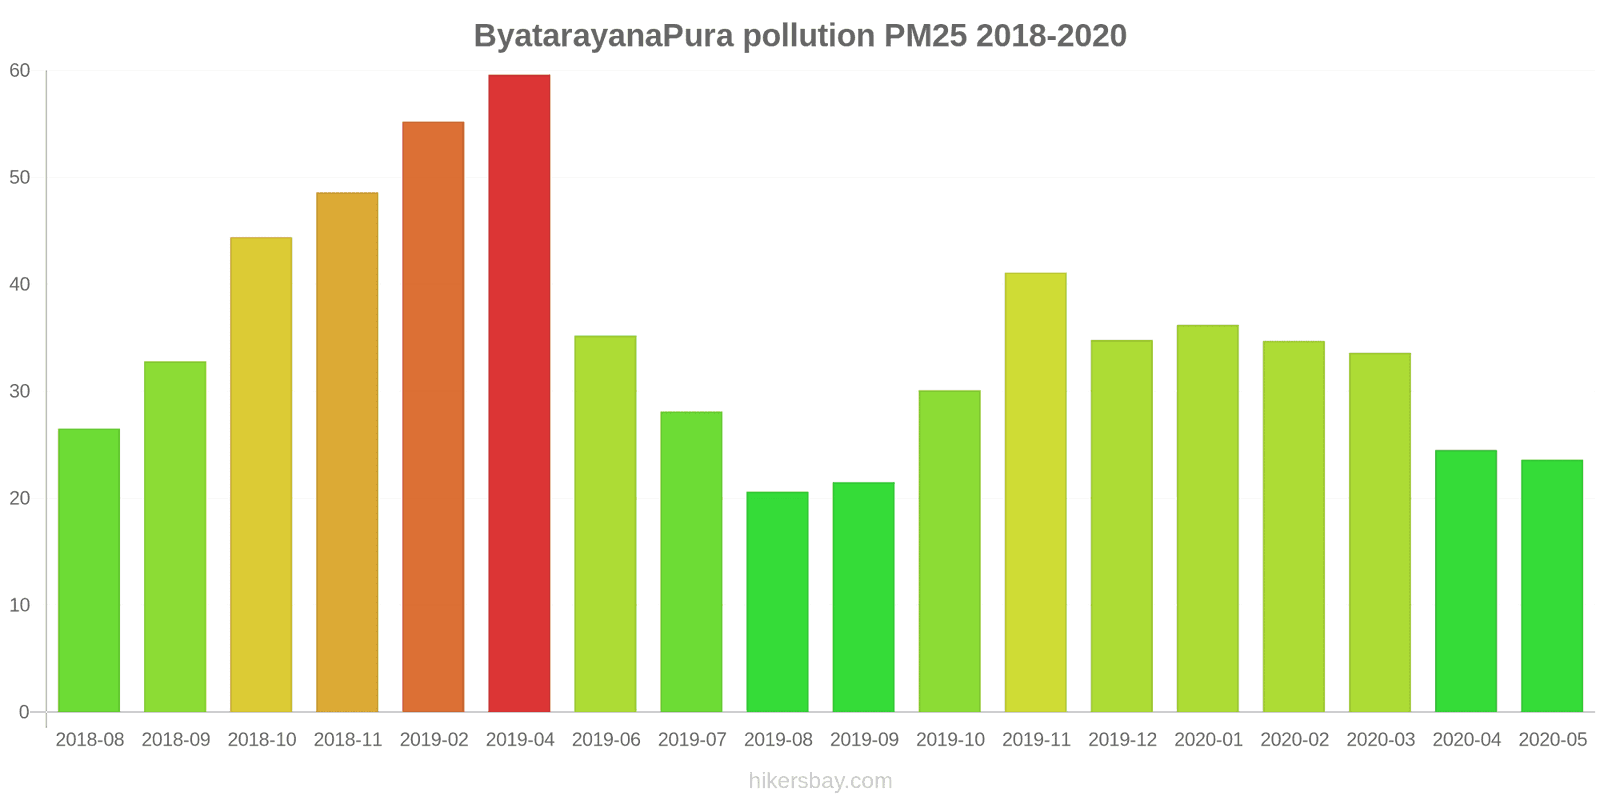
The highest PM2.5 values were recorded: 60 (April 2019).
The lowest level of particulate matter PM2.5 pollution occurs in month: August (21).
How is the O3 level today in ByatarayanaPura? (ozone (O3))
6 (Good)
How high is the level of NO2? (nitrogen dioxide (NO2))
20 (Good)
How high is the CO level? (carbon monoxide (CO))
1 (Good)
What is the level of PM10 today in ByatarayanaPura? (particulate matter (PM10) suspended dust)
The current level of particulate matter PM10 in ByatarayanaPura is:
170 (Very bad Hazardous)
The highest PM10 values usually occur in month: 115 (February 2019).
The lowest value of particulate matter PM10 pollution in ByatarayanaPura is usually recorded in: April (40).
Current data Monday, October 31, 2022, 2:00 AM
SO2 4 (Good)
PM2,5 114 (Very bad Hazardous)
O3 6 (Good)
NO2 20 (Good)
CO 1 (Good)
PM10 170 (Very bad Hazardous)
Data on air pollution from recent days in ByatarayanaPura
index
2022-10-31
so2
4
Good
pm25
102
Very Unhealthy
o3
5
Good
no2
20
Good
co
1
Good
pm10
170
Very bad Hazardous
data source »
Air pollution in ByatarayanaPura from August 2018 to May 2020
index
2020-05
2020-04
2020-03
2020-02
2020-01
2019-12
2019-11
2019-10
2019-09
2019-08
2019-07
2019-06
2019-04
2019-02
2018-11
2018-10
2018-09
2018-08
pm25
24 (Moderate)
25 (Moderate)
34 (Moderate)
35 (Moderate)
36 (Unhealthy for Sensitive Groups)
35 (Moderate)
41 (Unhealthy for Sensitive Groups)
30 (Moderate)
22 (Moderate)
21 (Moderate)
28 (Moderate)
35 (Unhealthy for Sensitive Groups)
60 (Unhealthy)
55 (Unhealthy)
49 (Unhealthy for Sensitive Groups)
44 (Unhealthy for Sensitive Groups)
33 (Moderate)
27 (Moderate)
pm10
52 (Unhealthy for Sensitive Groups)
40 (Moderate)
68 (Unhealthy for Sensitive Groups)
87 (Unhealthy)
83 (Unhealthy)
76 (Unhealthy for Sensitive Groups)
86 (Unhealthy)
60 (Unhealthy for Sensitive Groups)
45 (Moderate)
44 (Moderate)
52 (Unhealthy for Sensitive Groups)
61 (Unhealthy for Sensitive Groups)
100 (Unhealthy)
115 (Very Unhealthy)
99 (Unhealthy)
100 (Unhealthy)
75 (Unhealthy for Sensitive Groups)
62 (Unhealthy for Sensitive Groups)
so2
8.4 (Good)
8.6 (Good)
11 (Good)
9.5 (Good)
8.5 (Good)
8.3 (Good)
2.9 (Good)
3.1 (Good)
3.3 (Good)
3.1 (Good)
2.9 (Good)
2.9 (Good)
8.4 (Good)
7.5 (Good)
8.6 (Good)
8.4 (Good)
8.1 (Good)
8.2 (Good)
co
0.62 (Good)
0.43 (Good)
0.61 (Good)
0.72 (Good)
0.68 (Good)
0.74 (Good)
0.82 (Good)
0.69 (Good)
0.47 (Good)
0.39 (Good)
0.36 (Good)
0.32 (Good)
0.65 (Good)
1.1 (Good)
1.2 (Good)
1.1 (Good)
0.83 (Good)
0.76 (Good)
o3
53 (Good)
53 (Good)
58 (Good)
44 (Good)
74 (Moderate)
48 (Good)
43 (Good)
41 (Good)
23 (Good)
9.7 (Good)
16 (Good)
24 (Good)
67 (Good)
63 (Good)
11 (Good)
14 (Good)
10 (Good)
4.9 (Good)
no2
13 (Good)
9.3 (Good)
23 (Good)
49 (Moderate)
45 (Moderate)
47 (Moderate)
33 (Good)
33 (Good)
21 (Good)
19 (Good)
22 (Good)
23 (Good)
64 (Moderate)
78 (Moderate)
54 (Moderate)
41 (Moderate)
28 (Good)
19 (Good)
data source »
Bapuji Nagar, Bengaluru - KSPCB
Monday, October 31, 2022, 2:00 AM
SO2 4.4 (Good)
sulfur dioxide (SO2)
PM2,5 114 (Very bad Hazardous)
particulate matter (PM2.5) dust
O3 5.5 (Good)
ozone (O3)
NO2 20 (Good)
nitrogen dioxide (NO2)
CO 1.5 (Good)
carbon monoxide (CO)
PM10 170 (Very bad Hazardous)
particulate matter (PM10) suspended dust
Bapuji Nagar, Bengaluru - KSPCB
index
2022-10-31
so2
4.3
pm25
102
o3
5
no2
20
co
1.3
pm10
170
Bapuji Nagar, Bengaluru - KSPCB
2018-08 2020-05

index
2020-05
2020-04
2020-03
2020-02
2020-01
2019-12
2019-11
2019-10
2019-09
2019-08
2019-07
2019-06
2019-04
2019-02
2018-11
2018-10
2018-09
2018-08
pm25
24
25
34
35
36
35
41
30
22
21
28
35
60
55
49
44
33
27
pm10
52
40
68
87
83
76
86
60
45
44
52
61
100
115
99
100
75
62
no2
13
9.3
23
49
45
47
33
33
21
19
22
23
64
78
54
41
28
19
co
0.62
0.43
0.61
0.72
0.68
0.74
0.82
0.69
0.47
0.39
0.36
0.32
0.65
1.1
1.2
1.1
0.83
0.76
o3
53
53
58
44
74
48
43
41
23
9.7
16
24
67
63
11
14
10
4.9
so2
8.4
8.6
11
9.5
8.5
8.3
2.9
3.1
3.3
3.1
2.9
2.9
8.4
7.5
8.6
8.4
8.1
8.2
* Pollution data source:
https://openaq.org
(caaqm)
The data is licensed under CC-By 4.0
SO2 4 (Good)
PM2,5 114 (Very bad Hazardous)
O3 6 (Good)
NO2 20 (Good)
CO 1 (Good)
PM10 170 (Very bad Hazardous)
Data on air pollution from recent days in ByatarayanaPura
| index | 2022-10-31 |
|---|---|
| so2 | 4 Good |
| pm25 | 102 Very Unhealthy |
| o3 | 5 Good |
| no2 | 20 Good |
| co | 1 Good |
| pm10 | 170 Very bad Hazardous |

| index | 2020-05 | 2020-04 | 2020-03 | 2020-02 | 2020-01 | 2019-12 | 2019-11 | 2019-10 | 2019-09 | 2019-08 | 2019-07 | 2019-06 | 2019-04 | 2019-02 | 2018-11 | 2018-10 | 2018-09 | 2018-08 |
|---|---|---|---|---|---|---|---|---|---|---|---|---|---|---|---|---|---|---|
| pm25 | 24 (Moderate) | 25 (Moderate) | 34 (Moderate) | 35 (Moderate) | 36 (Unhealthy for Sensitive Groups) | 35 (Moderate) | 41 (Unhealthy for Sensitive Groups) | 30 (Moderate) | 22 (Moderate) | 21 (Moderate) | 28 (Moderate) | 35 (Unhealthy for Sensitive Groups) | 60 (Unhealthy) | 55 (Unhealthy) | 49 (Unhealthy for Sensitive Groups) | 44 (Unhealthy for Sensitive Groups) | 33 (Moderate) | 27 (Moderate) |
| pm10 | 52 (Unhealthy for Sensitive Groups) | 40 (Moderate) | 68 (Unhealthy for Sensitive Groups) | 87 (Unhealthy) | 83 (Unhealthy) | 76 (Unhealthy for Sensitive Groups) | 86 (Unhealthy) | 60 (Unhealthy for Sensitive Groups) | 45 (Moderate) | 44 (Moderate) | 52 (Unhealthy for Sensitive Groups) | 61 (Unhealthy for Sensitive Groups) | 100 (Unhealthy) | 115 (Very Unhealthy) | 99 (Unhealthy) | 100 (Unhealthy) | 75 (Unhealthy for Sensitive Groups) | 62 (Unhealthy for Sensitive Groups) |
| so2 | 8.4 (Good) | 8.6 (Good) | 11 (Good) | 9.5 (Good) | 8.5 (Good) | 8.3 (Good) | 2.9 (Good) | 3.1 (Good) | 3.3 (Good) | 3.1 (Good) | 2.9 (Good) | 2.9 (Good) | 8.4 (Good) | 7.5 (Good) | 8.6 (Good) | 8.4 (Good) | 8.1 (Good) | 8.2 (Good) |
| co | 0.62 (Good) | 0.43 (Good) | 0.61 (Good) | 0.72 (Good) | 0.68 (Good) | 0.74 (Good) | 0.82 (Good) | 0.69 (Good) | 0.47 (Good) | 0.39 (Good) | 0.36 (Good) | 0.32 (Good) | 0.65 (Good) | 1.1 (Good) | 1.2 (Good) | 1.1 (Good) | 0.83 (Good) | 0.76 (Good) |
| o3 | 53 (Good) | 53 (Good) | 58 (Good) | 44 (Good) | 74 (Moderate) | 48 (Good) | 43 (Good) | 41 (Good) | 23 (Good) | 9.7 (Good) | 16 (Good) | 24 (Good) | 67 (Good) | 63 (Good) | 11 (Good) | 14 (Good) | 10 (Good) | 4.9 (Good) |
| no2 | 13 (Good) | 9.3 (Good) | 23 (Good) | 49 (Moderate) | 45 (Moderate) | 47 (Moderate) | 33 (Good) | 33 (Good) | 21 (Good) | 19 (Good) | 22 (Good) | 23 (Good) | 64 (Moderate) | 78 (Moderate) | 54 (Moderate) | 41 (Moderate) | 28 (Good) | 19 (Good) |
SO2 4.4 (Good)
sulfur dioxide (SO2)PM2,5 114 (Very bad Hazardous)
particulate matter (PM2.5) dustO3 5.5 (Good)
ozone (O3)NO2 20 (Good)
nitrogen dioxide (NO2)CO 1.5 (Good)
carbon monoxide (CO)PM10 170 (Very bad Hazardous)
particulate matter (PM10) suspended dustBapuji Nagar, Bengaluru - KSPCB
| index | 2022-10-31 |
|---|---|
| so2 | 4.3 |
| pm25 | 102 |
| o3 | 5 |
| no2 | 20 |
| co | 1.3 |
| pm10 | 170 |
Bapuji Nagar, Bengaluru - KSPCB
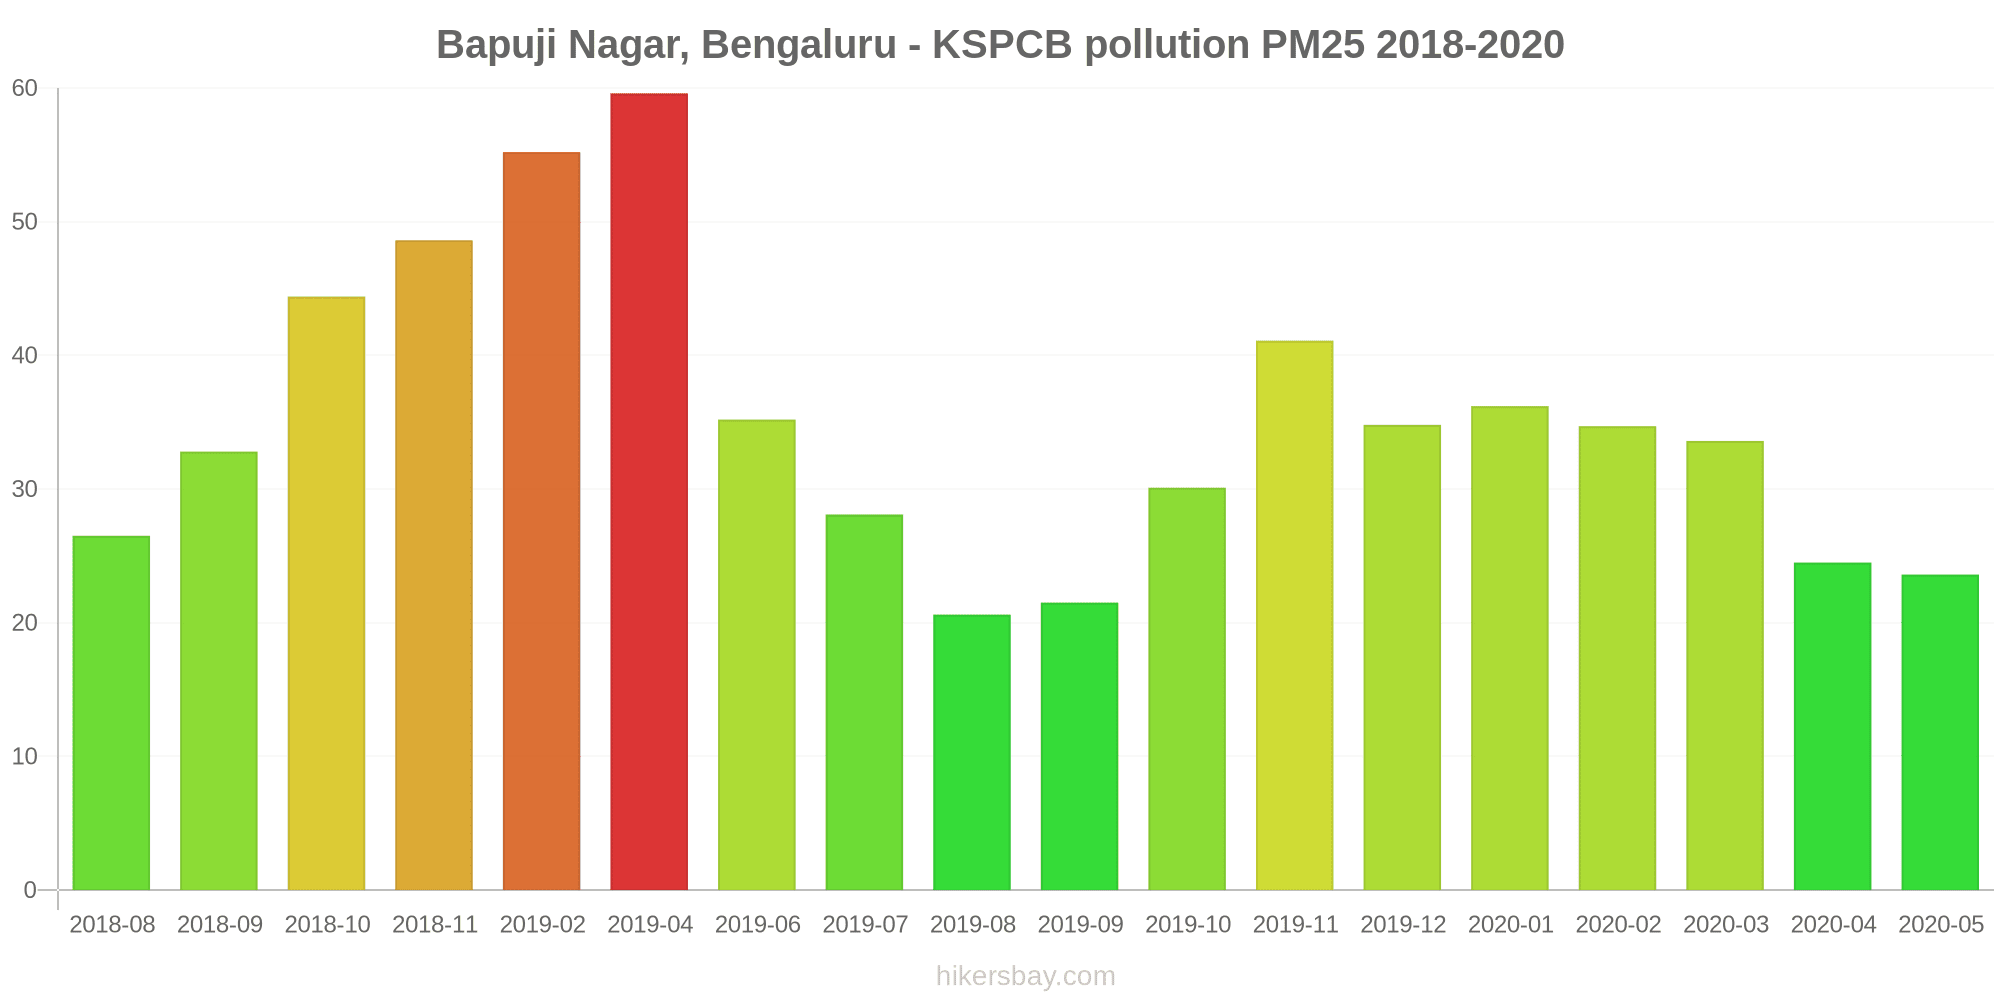
| index | 2020-05 | 2020-04 | 2020-03 | 2020-02 | 2020-01 | 2019-12 | 2019-11 | 2019-10 | 2019-09 | 2019-08 | 2019-07 | 2019-06 | 2019-04 | 2019-02 | 2018-11 | 2018-10 | 2018-09 | 2018-08 |
|---|---|---|---|---|---|---|---|---|---|---|---|---|---|---|---|---|---|---|
| pm25 | 24 | 25 | 34 | 35 | 36 | 35 | 41 | 30 | 22 | 21 | 28 | 35 | 60 | 55 | 49 | 44 | 33 | 27 |
| pm10 | 52 | 40 | 68 | 87 | 83 | 76 | 86 | 60 | 45 | 44 | 52 | 61 | 100 | 115 | 99 | 100 | 75 | 62 |
| no2 | 13 | 9.3 | 23 | 49 | 45 | 47 | 33 | 33 | 21 | 19 | 22 | 23 | 64 | 78 | 54 | 41 | 28 | 19 |
| co | 0.62 | 0.43 | 0.61 | 0.72 | 0.68 | 0.74 | 0.82 | 0.69 | 0.47 | 0.39 | 0.36 | 0.32 | 0.65 | 1.1 | 1.2 | 1.1 | 0.83 | 0.76 |
| o3 | 53 | 53 | 58 | 44 | 74 | 48 | 43 | 41 | 23 | 9.7 | 16 | 24 | 67 | 63 | 11 | 14 | 10 | 4.9 |
| so2 | 8.4 | 8.6 | 11 | 9.5 | 8.5 | 8.3 | 2.9 | 3.1 | 3.3 | 3.1 | 2.9 | 2.9 | 8.4 | 7.5 | 8.6 | 8.4 | 8.1 | 8.2 |