Air Pollution in Muttargi: Real-time Air Quality Index and smog alert.
Pollution and air quality forecast for Muttargi. Today is Wednesday, May 13, 2026. The following air pollution values have been recorded for Muttargi:- particulate matter (PM10) suspended dust - 177 (Very bad Hazardous)
- sulfur dioxide (SO2) - 10 (Good)
- particulate matter (PM2.5) dust - 85 (Very Unhealthy)
- carbon monoxide (CO) - 800 (Good)
- nitrogen dioxide (NO2) - 11 (Good)
- ozone (O3) - 0 (Good)

What is the air quality in Muttargi today? Is the air polluted in Muttargi?. Is there smog?
What is the level of PM10 today in Muttargi? (particulate matter (PM10) suspended dust)
The current level of particulate matter PM10 in Muttargi is:
177 (Very bad Hazardous)
The highest PM10 values usually occur in month: 160 (April 2017).
The lowest value of particulate matter PM10 pollution in Muttargi is usually recorded in: June (38).
What is the level of SO2 pollution? (sulfur dioxide (SO2))
10 (Good)
What is the current level of PM2.5 in Muttargi? (particulate matter (PM2.5) dust)
Today's PM2.5 level is:
85 (Very Unhealthy)
For comparison, the highest level of PM2.5 in Muttargi in the last 7 days was: 85 (Monday, October 31, 2022) and the lowest: 85 (Monday, October 31, 2022).
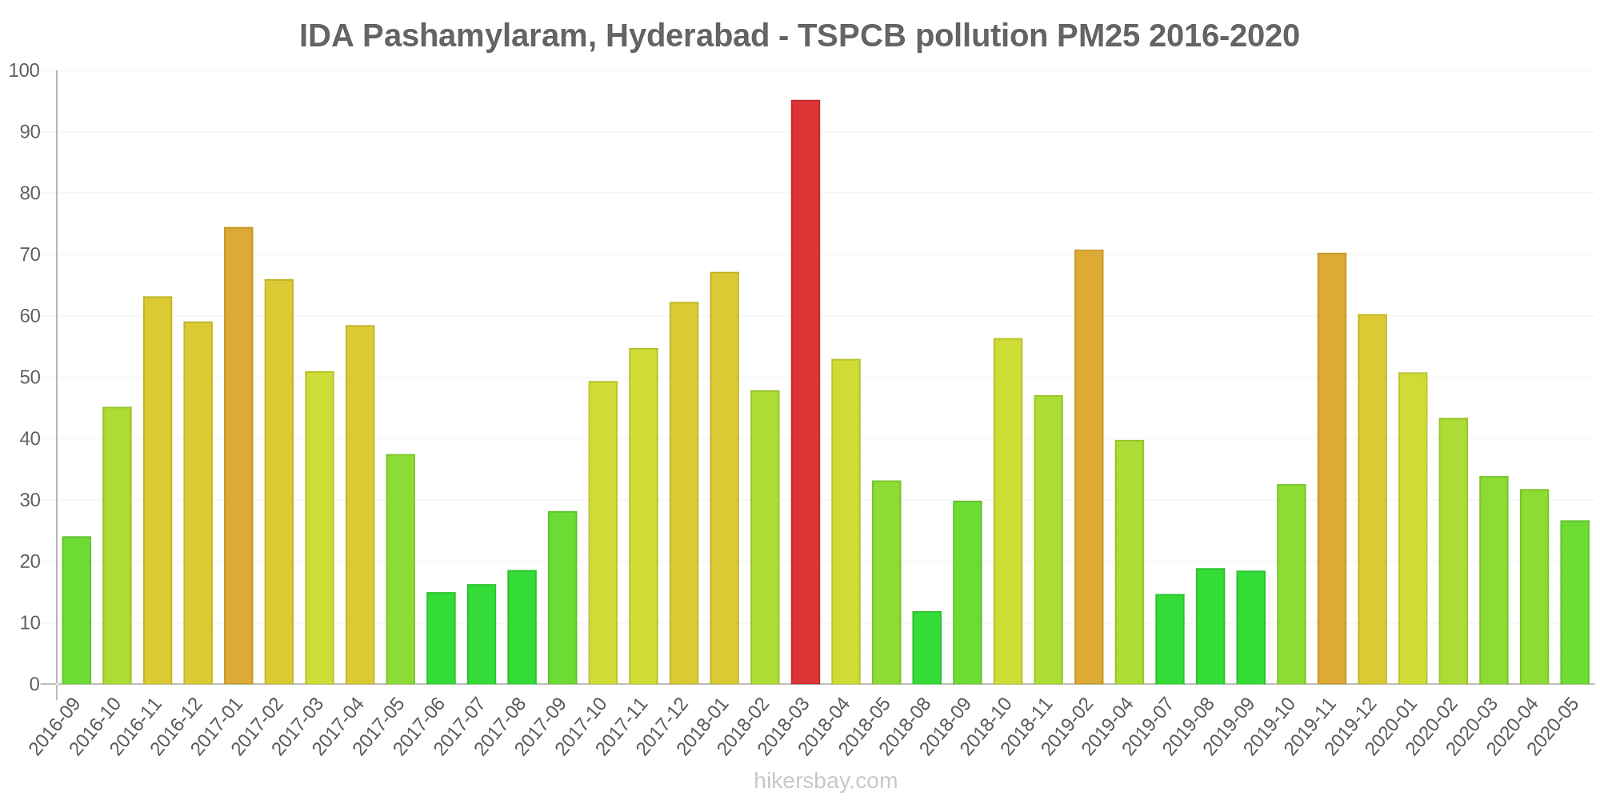
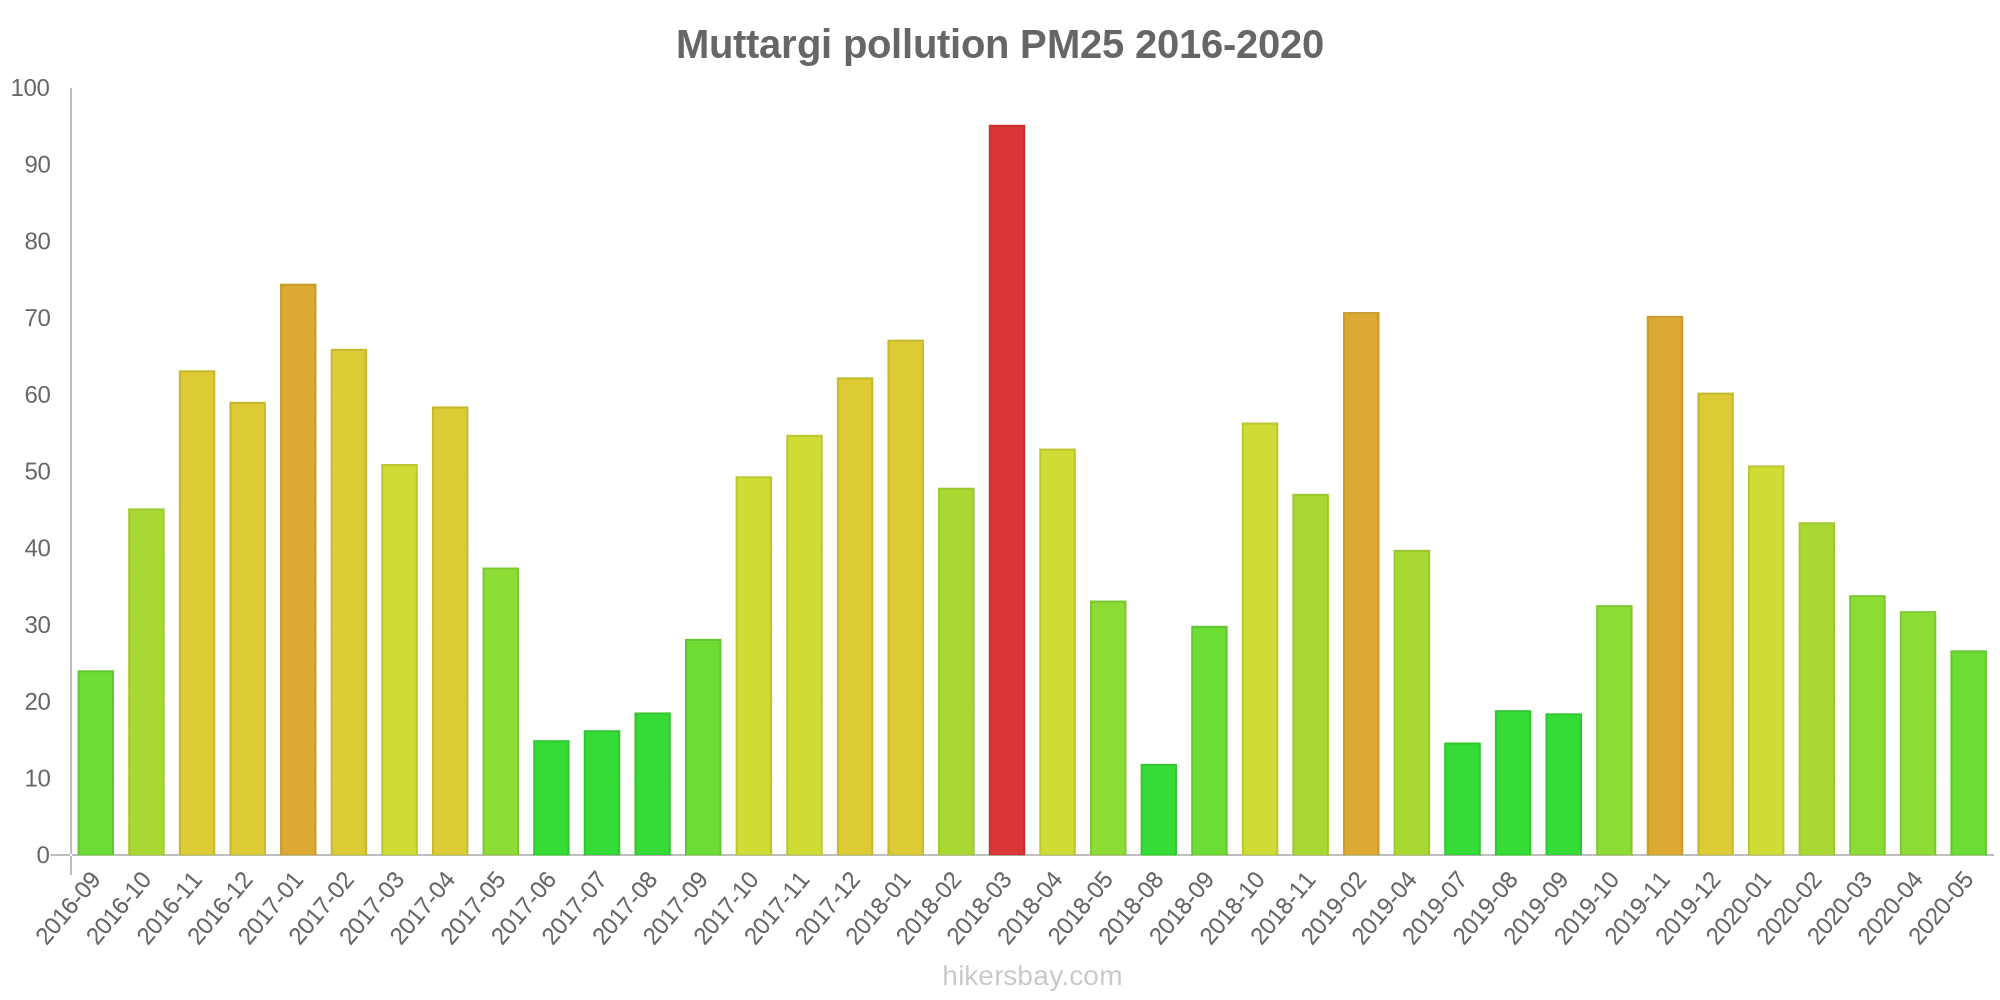
The highest PM2.5 values were recorded: 95 (March 2018).
The lowest level of particulate matter PM2.5 pollution occurs in month: August (12).
How high is the CO level? (carbon monoxide (CO))
800 (Good)
How high is the level of NO2? (nitrogen dioxide (NO2))
11 (Good)
How is the O3 level today in Muttargi? (ozone (O3))
0 (Good)
Current data Monday, October 31, 2022, 2:00 AM
PM10 177 (Very bad Hazardous)
SO2 10 (Good)
PM2,5 85 (Very Unhealthy)
CO 800 (Good)
NO2 11 (Good)
O3 0 (Good)
Data on air pollution from recent days in Muttargi
index
2022-10-31
pm10
164
Very bad Hazardous
so2
8
Good
pm25
85
Very Unhealthy
co
650
Good
no2
9
Good
o3
0
Good
data source »
Air pollution in Muttargi from September 2016 to May 2020

index
2020-05
2020-04
2020-03
2020-02
2020-01
2019-12
2019-11
2019-10
2019-09
2019-08
2019-07
2019-05
2019-04
2019-02
2018-11
2018-10
2018-09
2018-08
2018-05
2018-04
2018-03
2018-02
2018-01
2017-12
2017-11
2017-10
2017-09
2017-08
2017-07
2017-06
2017-05
2017-04
2017-03
2017-02
2017-01
2016-12
2016-11
2016-10
2016-09
pm25
27 (Moderate)
32 (Moderate)
34 (Moderate)
43 (Unhealthy for Sensitive Groups)
51 (Unhealthy for Sensitive Groups)
60 (Unhealthy)
70 (Unhealthy)
33 (Moderate)
19 (Moderate)
19 (Moderate)
15 (Moderate)
- (Good)
40 (Unhealthy for Sensitive Groups)
71 (Unhealthy)
47 (Unhealthy for Sensitive Groups)
56 (Unhealthy)
30 (Moderate)
12 (Good)
33 (Moderate)
53 (Unhealthy for Sensitive Groups)
95 (Very Unhealthy)
48 (Unhealthy for Sensitive Groups)
67 (Unhealthy)
62 (Unhealthy)
55 (Unhealthy for Sensitive Groups)
49 (Unhealthy for Sensitive Groups)
28 (Moderate)
19 (Moderate)
16 (Moderate)
15 (Moderate)
38 (Unhealthy for Sensitive Groups)
59 (Unhealthy)
51 (Unhealthy for Sensitive Groups)
66 (Unhealthy)
75 (Unhealthy)
59 (Unhealthy)
63 (Unhealthy)
45 (Unhealthy for Sensitive Groups)
24 (Moderate)
pm10
63 (Unhealthy for Sensitive Groups)
62 (Unhealthy for Sensitive Groups)
80 (Unhealthy for Sensitive Groups)
100 (Unhealthy)
108 (Unhealthy)
128 (Very Unhealthy)
152 (Very bad Hazardous)
69 (Unhealthy for Sensitive Groups)
40 (Moderate)
55 (Unhealthy for Sensitive Groups)
41 (Moderate)
138 (Very Unhealthy)
104 (Unhealthy)
136 (Very Unhealthy)
106 (Unhealthy)
125 (Very Unhealthy)
79 (Unhealthy for Sensitive Groups)
41 (Moderate)
76 (Unhealthy for Sensitive Groups)
87 (Unhealthy)
100 (Unhealthy)
109 (Unhealthy)
140 (Very Unhealthy)
129 (Very Unhealthy)
111 (Very Unhealthy)
98 (Unhealthy)
58 (Unhealthy for Sensitive Groups)
46 (Moderate)
46 (Moderate)
38 (Moderate)
105 (Unhealthy)
160 (Very bad Hazardous)
129 (Very Unhealthy)
136 (Very Unhealthy)
132 (Very Unhealthy)
97 (Unhealthy)
94 (Unhealthy)
- (Good)
- (Good)
no2
36 (Good)
30 (Good)
33 (Good)
41 (Moderate)
36 (Good)
43 (Moderate)
26 (Good)
0.08 (Good)
9 (Good)
2 (Good)
24 (Good)
43 (Moderate)
42 (Moderate)
46 (Moderate)
70 (Moderate)
77 (Moderate)
67 (Moderate)
72 (Moderate)
47 (Moderate)
55 (Moderate)
74 (Moderate)
65 (Moderate)
78 (Moderate)
66 (Moderate)
48 (Moderate)
32 (Good)
25 (Good)
21 (Good)
24 (Good)
27 (Good)
68 (Moderate)
44 (Moderate)
45 (Moderate)
45 (Moderate)
46 (Moderate)
57 (Moderate)
78 (Moderate)
115 (Unhealthy for Sensitive Groups)
95 (Moderate)
so2
8.8 (Good)
20 (Good)
13 (Good)
45 (Good)
24 (Good)
22 (Good)
802 (Very bad Hazardous)
19 (Good)
16 (Good)
16 (Good)
16 (Good)
7.6 (Good)
11 (Good)
18 (Good)
35 (Good)
16 (Good)
22 (Good)
18 (Good)
25 (Good)
13 (Good)
5.1 (Good)
29 (Good)
27 (Good)
27 (Good)
27 (Good)
20 (Good)
15 (Good)
14 (Good)
12 (Good)
16 (Good)
23 (Good)
24 (Good)
23 (Good)
30 (Good)
26 (Good)
31 (Good)
66 (Moderate)
55 (Moderate)
16 (Good)
co
558 (Good)
633 (Good)
464 (Good)
539 (Good)
561 (Good)
669 (Good)
672 (Good)
557 (Good)
436 (Good)
1 (Good)
438 (Good)
599 (Good)
683 (Good)
675 (Good)
608 (Good)
607 (Good)
581 (Good)
389 (Good)
989 (Good)
24 (Good)
53 (Good)
1 (Good)
1 (Good)
727 (Good)
721 (Good)
720 (Good)
709 (Good)
656 (Good)
889 (Good)
713 (Good)
788 (Good)
699 (Good)
697 (Good)
852 (Good)
822 (Good)
1 (Good)
1 (Good)
1 (Good)
502 (Good)
o3
30 (Good)
31 (Good)
25 (Good)
26 (Good)
23 (Good)
23 (Good)
14 (Good)
29 (Good)
9.2 (Good)
8.7 (Good)
13 (Good)
23 (Good)
32 (Good)
34 (Good)
37 (Good)
15 (Good)
7.2 (Good)
6.4 (Good)
38 (Good)
31 (Good)
22 (Good)
33 (Good)
33 (Good)
45 (Good)
35 (Good)
37 (Good)
38 (Good)
36 (Good)
40 (Good)
45 (Good)
31 (Good)
32 (Good)
43 (Good)
58 (Good)
51 (Good)
50 (Good)
89 (Moderate)
68 (Good)
49 (Good)
data source »
IDA Pashamylaram, Hyderabad - TSPCB
Monday, October 31, 2022, 2:00 AM
PM10 177 (Very bad Hazardous)
particulate matter (PM10) suspended dust
SO2 9.5 (Good)
sulfur dioxide (SO2)
PM2,5 85 (Very Unhealthy)
particulate matter (PM2.5) dust
CO 800 (Good)
carbon monoxide (CO)
NO2 11 (Good)
nitrogen dioxide (NO2)
O3 0 (Good)
ozone (O3)
IDA Pashamylaram, Hyderabad - TSPCB
index
2022-10-31
pm10
164
so2
8.3
pm25
85
co
650
no2
9.3
o3
0
IDA Pashamylaram, Hyderabad - TSPCB
2016-09 2020-05
index
2020-05
2020-04
2020-03
2020-02
2020-01
2019-12
2019-11
2019-10
2019-09
2019-08
2019-07
2019-05
2019-04
2019-02
2018-11
2018-10
2018-09
2018-08
2018-05
2018-04
2018-03
2018-02
2018-01
2017-12
2017-11
2017-10
2017-09
2017-08
2017-07
2017-06
2017-05
2017-04
2017-03
2017-02
2017-01
2016-12
2016-11
2016-10
2016-09
so2
8.8
20
13
45
24
22
802
19
16
16
16
7.6
11
18
35
16
22
18
25
13
5.1
29
27
27
27
20
15
14
12
16
23
24
23
30
26
31
66
55
16
co
558
633
464
539
561
669
672
557
436
1
438
599
683
675
608
607
581
389
989
24
53
1
1
727
721
720
709
656
889
713
788
699
697
852
822
1
1
1
502
o3
30
31
25
26
23
23
14
29
9.2
8.7
13
23
32
34
37
15
7.2
6.4
38
31
22
33
33
45
35
37
38
36
40
45
31
32
43
58
51
50
89
68
49
no2
36
30
33
41
36
43
26
0.08
9
2
24
43
42
46
70
77
67
72
47
55
74
65
78
66
48
32
25
21
24
27
68
44
45
45
46
57
78
115
95
pm25
27
32
34
43
51
60
70
33
19
19
15
-
40
71
47
56
30
12
33
53
95
48
67
62
55
49
28
19
16
15
38
59
51
66
75
59
63
45
24
pm10
63
62
80
100
108
128
152
69
40
55
41
138
104
136
106
125
79
41
76
87
100
109
140
129
111
98
58
46
46
38
105
160
129
136
132
97
94
-
-
* Pollution data source:
https://openaq.org
(caaqm)
The data is licensed under CC-By 4.0
PM10 177 (Very bad Hazardous)
SO2 10 (Good)
PM2,5 85 (Very Unhealthy)
CO 800 (Good)
NO2 11 (Good)
O3 0 (Good)
Data on air pollution from recent days in Muttargi
| index | 2022-10-31 |
|---|---|
| pm10 | 164 Very bad Hazardous |
| so2 | 8 Good |
| pm25 | 85 Very Unhealthy |
| co | 650 Good |
| no2 | 9 Good |
| o3 | 0 Good |
| index | 2020-05 | 2020-04 | 2020-03 | 2020-02 | 2020-01 | 2019-12 | 2019-11 | 2019-10 | 2019-09 | 2019-08 | 2019-07 | 2019-05 | 2019-04 | 2019-02 | 2018-11 | 2018-10 | 2018-09 | 2018-08 | 2018-05 | 2018-04 | 2018-03 | 2018-02 | 2018-01 | 2017-12 | 2017-11 | 2017-10 | 2017-09 | 2017-08 | 2017-07 | 2017-06 | 2017-05 | 2017-04 | 2017-03 | 2017-02 | 2017-01 | 2016-12 | 2016-11 | 2016-10 | 2016-09 |
|---|---|---|---|---|---|---|---|---|---|---|---|---|---|---|---|---|---|---|---|---|---|---|---|---|---|---|---|---|---|---|---|---|---|---|---|---|---|---|---|
| pm25 | 27 (Moderate) | 32 (Moderate) | 34 (Moderate) | 43 (Unhealthy for Sensitive Groups) | 51 (Unhealthy for Sensitive Groups) | 60 (Unhealthy) | 70 (Unhealthy) | 33 (Moderate) | 19 (Moderate) | 19 (Moderate) | 15 (Moderate) | - (Good) | 40 (Unhealthy for Sensitive Groups) | 71 (Unhealthy) | 47 (Unhealthy for Sensitive Groups) | 56 (Unhealthy) | 30 (Moderate) | 12 (Good) | 33 (Moderate) | 53 (Unhealthy for Sensitive Groups) | 95 (Very Unhealthy) | 48 (Unhealthy for Sensitive Groups) | 67 (Unhealthy) | 62 (Unhealthy) | 55 (Unhealthy for Sensitive Groups) | 49 (Unhealthy for Sensitive Groups) | 28 (Moderate) | 19 (Moderate) | 16 (Moderate) | 15 (Moderate) | 38 (Unhealthy for Sensitive Groups) | 59 (Unhealthy) | 51 (Unhealthy for Sensitive Groups) | 66 (Unhealthy) | 75 (Unhealthy) | 59 (Unhealthy) | 63 (Unhealthy) | 45 (Unhealthy for Sensitive Groups) | 24 (Moderate) |
| pm10 | 63 (Unhealthy for Sensitive Groups) | 62 (Unhealthy for Sensitive Groups) | 80 (Unhealthy for Sensitive Groups) | 100 (Unhealthy) | 108 (Unhealthy) | 128 (Very Unhealthy) | 152 (Very bad Hazardous) | 69 (Unhealthy for Sensitive Groups) | 40 (Moderate) | 55 (Unhealthy for Sensitive Groups) | 41 (Moderate) | 138 (Very Unhealthy) | 104 (Unhealthy) | 136 (Very Unhealthy) | 106 (Unhealthy) | 125 (Very Unhealthy) | 79 (Unhealthy for Sensitive Groups) | 41 (Moderate) | 76 (Unhealthy for Sensitive Groups) | 87 (Unhealthy) | 100 (Unhealthy) | 109 (Unhealthy) | 140 (Very Unhealthy) | 129 (Very Unhealthy) | 111 (Very Unhealthy) | 98 (Unhealthy) | 58 (Unhealthy for Sensitive Groups) | 46 (Moderate) | 46 (Moderate) | 38 (Moderate) | 105 (Unhealthy) | 160 (Very bad Hazardous) | 129 (Very Unhealthy) | 136 (Very Unhealthy) | 132 (Very Unhealthy) | 97 (Unhealthy) | 94 (Unhealthy) | - (Good) | - (Good) |
| no2 | 36 (Good) | 30 (Good) | 33 (Good) | 41 (Moderate) | 36 (Good) | 43 (Moderate) | 26 (Good) | 0.08 (Good) | 9 (Good) | 2 (Good) | 24 (Good) | 43 (Moderate) | 42 (Moderate) | 46 (Moderate) | 70 (Moderate) | 77 (Moderate) | 67 (Moderate) | 72 (Moderate) | 47 (Moderate) | 55 (Moderate) | 74 (Moderate) | 65 (Moderate) | 78 (Moderate) | 66 (Moderate) | 48 (Moderate) | 32 (Good) | 25 (Good) | 21 (Good) | 24 (Good) | 27 (Good) | 68 (Moderate) | 44 (Moderate) | 45 (Moderate) | 45 (Moderate) | 46 (Moderate) | 57 (Moderate) | 78 (Moderate) | 115 (Unhealthy for Sensitive Groups) | 95 (Moderate) |
| so2 | 8.8 (Good) | 20 (Good) | 13 (Good) | 45 (Good) | 24 (Good) | 22 (Good) | 802 (Very bad Hazardous) | 19 (Good) | 16 (Good) | 16 (Good) | 16 (Good) | 7.6 (Good) | 11 (Good) | 18 (Good) | 35 (Good) | 16 (Good) | 22 (Good) | 18 (Good) | 25 (Good) | 13 (Good) | 5.1 (Good) | 29 (Good) | 27 (Good) | 27 (Good) | 27 (Good) | 20 (Good) | 15 (Good) | 14 (Good) | 12 (Good) | 16 (Good) | 23 (Good) | 24 (Good) | 23 (Good) | 30 (Good) | 26 (Good) | 31 (Good) | 66 (Moderate) | 55 (Moderate) | 16 (Good) |
| co | 558 (Good) | 633 (Good) | 464 (Good) | 539 (Good) | 561 (Good) | 669 (Good) | 672 (Good) | 557 (Good) | 436 (Good) | 1 (Good) | 438 (Good) | 599 (Good) | 683 (Good) | 675 (Good) | 608 (Good) | 607 (Good) | 581 (Good) | 389 (Good) | 989 (Good) | 24 (Good) | 53 (Good) | 1 (Good) | 1 (Good) | 727 (Good) | 721 (Good) | 720 (Good) | 709 (Good) | 656 (Good) | 889 (Good) | 713 (Good) | 788 (Good) | 699 (Good) | 697 (Good) | 852 (Good) | 822 (Good) | 1 (Good) | 1 (Good) | 1 (Good) | 502 (Good) |
| o3 | 30 (Good) | 31 (Good) | 25 (Good) | 26 (Good) | 23 (Good) | 23 (Good) | 14 (Good) | 29 (Good) | 9.2 (Good) | 8.7 (Good) | 13 (Good) | 23 (Good) | 32 (Good) | 34 (Good) | 37 (Good) | 15 (Good) | 7.2 (Good) | 6.4 (Good) | 38 (Good) | 31 (Good) | 22 (Good) | 33 (Good) | 33 (Good) | 45 (Good) | 35 (Good) | 37 (Good) | 38 (Good) | 36 (Good) | 40 (Good) | 45 (Good) | 31 (Good) | 32 (Good) | 43 (Good) | 58 (Good) | 51 (Good) | 50 (Good) | 89 (Moderate) | 68 (Good) | 49 (Good) |
PM10 177 (Very bad Hazardous)
particulate matter (PM10) suspended dustSO2 9.5 (Good)
sulfur dioxide (SO2)PM2,5 85 (Very Unhealthy)
particulate matter (PM2.5) dustCO 800 (Good)
carbon monoxide (CO)NO2 11 (Good)
nitrogen dioxide (NO2)O3 0 (Good)
ozone (O3)IDA Pashamylaram, Hyderabad - TSPCB
| index | 2022-10-31 |
|---|---|
| pm10 | 164 |
| so2 | 8.3 |
| pm25 | 85 |
| co | 650 |
| no2 | 9.3 |
| o3 | 0 |
IDA Pashamylaram, Hyderabad - TSPCB

| index | 2020-05 | 2020-04 | 2020-03 | 2020-02 | 2020-01 | 2019-12 | 2019-11 | 2019-10 | 2019-09 | 2019-08 | 2019-07 | 2019-05 | 2019-04 | 2019-02 | 2018-11 | 2018-10 | 2018-09 | 2018-08 | 2018-05 | 2018-04 | 2018-03 | 2018-02 | 2018-01 | 2017-12 | 2017-11 | 2017-10 | 2017-09 | 2017-08 | 2017-07 | 2017-06 | 2017-05 | 2017-04 | 2017-03 | 2017-02 | 2017-01 | 2016-12 | 2016-11 | 2016-10 | 2016-09 |
|---|---|---|---|---|---|---|---|---|---|---|---|---|---|---|---|---|---|---|---|---|---|---|---|---|---|---|---|---|---|---|---|---|---|---|---|---|---|---|---|
| so2 | 8.8 | 20 | 13 | 45 | 24 | 22 | 802 | 19 | 16 | 16 | 16 | 7.6 | 11 | 18 | 35 | 16 | 22 | 18 | 25 | 13 | 5.1 | 29 | 27 | 27 | 27 | 20 | 15 | 14 | 12 | 16 | 23 | 24 | 23 | 30 | 26 | 31 | 66 | 55 | 16 |
| co | 558 | 633 | 464 | 539 | 561 | 669 | 672 | 557 | 436 | 1 | 438 | 599 | 683 | 675 | 608 | 607 | 581 | 389 | 989 | 24 | 53 | 1 | 1 | 727 | 721 | 720 | 709 | 656 | 889 | 713 | 788 | 699 | 697 | 852 | 822 | 1 | 1 | 1 | 502 |
| o3 | 30 | 31 | 25 | 26 | 23 | 23 | 14 | 29 | 9.2 | 8.7 | 13 | 23 | 32 | 34 | 37 | 15 | 7.2 | 6.4 | 38 | 31 | 22 | 33 | 33 | 45 | 35 | 37 | 38 | 36 | 40 | 45 | 31 | 32 | 43 | 58 | 51 | 50 | 89 | 68 | 49 |
| no2 | 36 | 30 | 33 | 41 | 36 | 43 | 26 | 0.08 | 9 | 2 | 24 | 43 | 42 | 46 | 70 | 77 | 67 | 72 | 47 | 55 | 74 | 65 | 78 | 66 | 48 | 32 | 25 | 21 | 24 | 27 | 68 | 44 | 45 | 45 | 46 | 57 | 78 | 115 | 95 |
| pm25 | 27 | 32 | 34 | 43 | 51 | 60 | 70 | 33 | 19 | 19 | 15 | - | 40 | 71 | 47 | 56 | 30 | 12 | 33 | 53 | 95 | 48 | 67 | 62 | 55 | 49 | 28 | 19 | 16 | 15 | 38 | 59 | 51 | 66 | 75 | 59 | 63 | 45 | 24 |
| pm10 | 63 | 62 | 80 | 100 | 108 | 128 | 152 | 69 | 40 | 55 | 41 | 138 | 104 | 136 | 106 | 125 | 79 | 41 | 76 | 87 | 100 | 109 | 140 | 129 | 111 | 98 | 58 | 46 | 46 | 38 | 105 | 160 | 129 | 136 | 132 | 97 | 94 | - | - |