Air Pollution in Kaimla: Real-time Air Quality Index and smog alert.
Pollution and air quality forecast for Kaimla. Today is Wednesday, May 13, 2026. The following air pollution values have been recorded for Kaimla:- particulate matter (PM10) suspended dust - 351 (Very bad Hazardous)
- sulfur dioxide (SO2) - 10 (Good)
- particulate matter (PM2.5) dust - 90 (Very Unhealthy)
- carbon monoxide (CO) - 2060 (Moderate)
- nitrogen dioxide (NO2) - 24 (Good)
- ozone (O3) - 28 (Good)

What is the air quality in Kaimla today? Is the air polluted in Kaimla?. Is there smog?
What is the level of PM10 today in Kaimla? (particulate matter (PM10) suspended dust)
The current level of particulate matter PM10 in Kaimla is:
351 (Very bad Hazardous)
The highest PM10 values usually occur in month: 370 (December 2019).
The lowest value of particulate matter PM10 pollution in Kaimla is usually recorded in: July (72).
What is the level of SO2 pollution? (sulfur dioxide (SO2))
10 (Good)
What is the current level of PM2.5 in Kaimla? (particulate matter (PM2.5) dust)
Today's PM2.5 level is:
90 (Very Unhealthy)
For comparison, the highest level of PM2.5 in Kaimla in the last 7 days was: 92 (Monday, October 31, 2022) and the lowest: 92 (Monday, October 31, 2022).
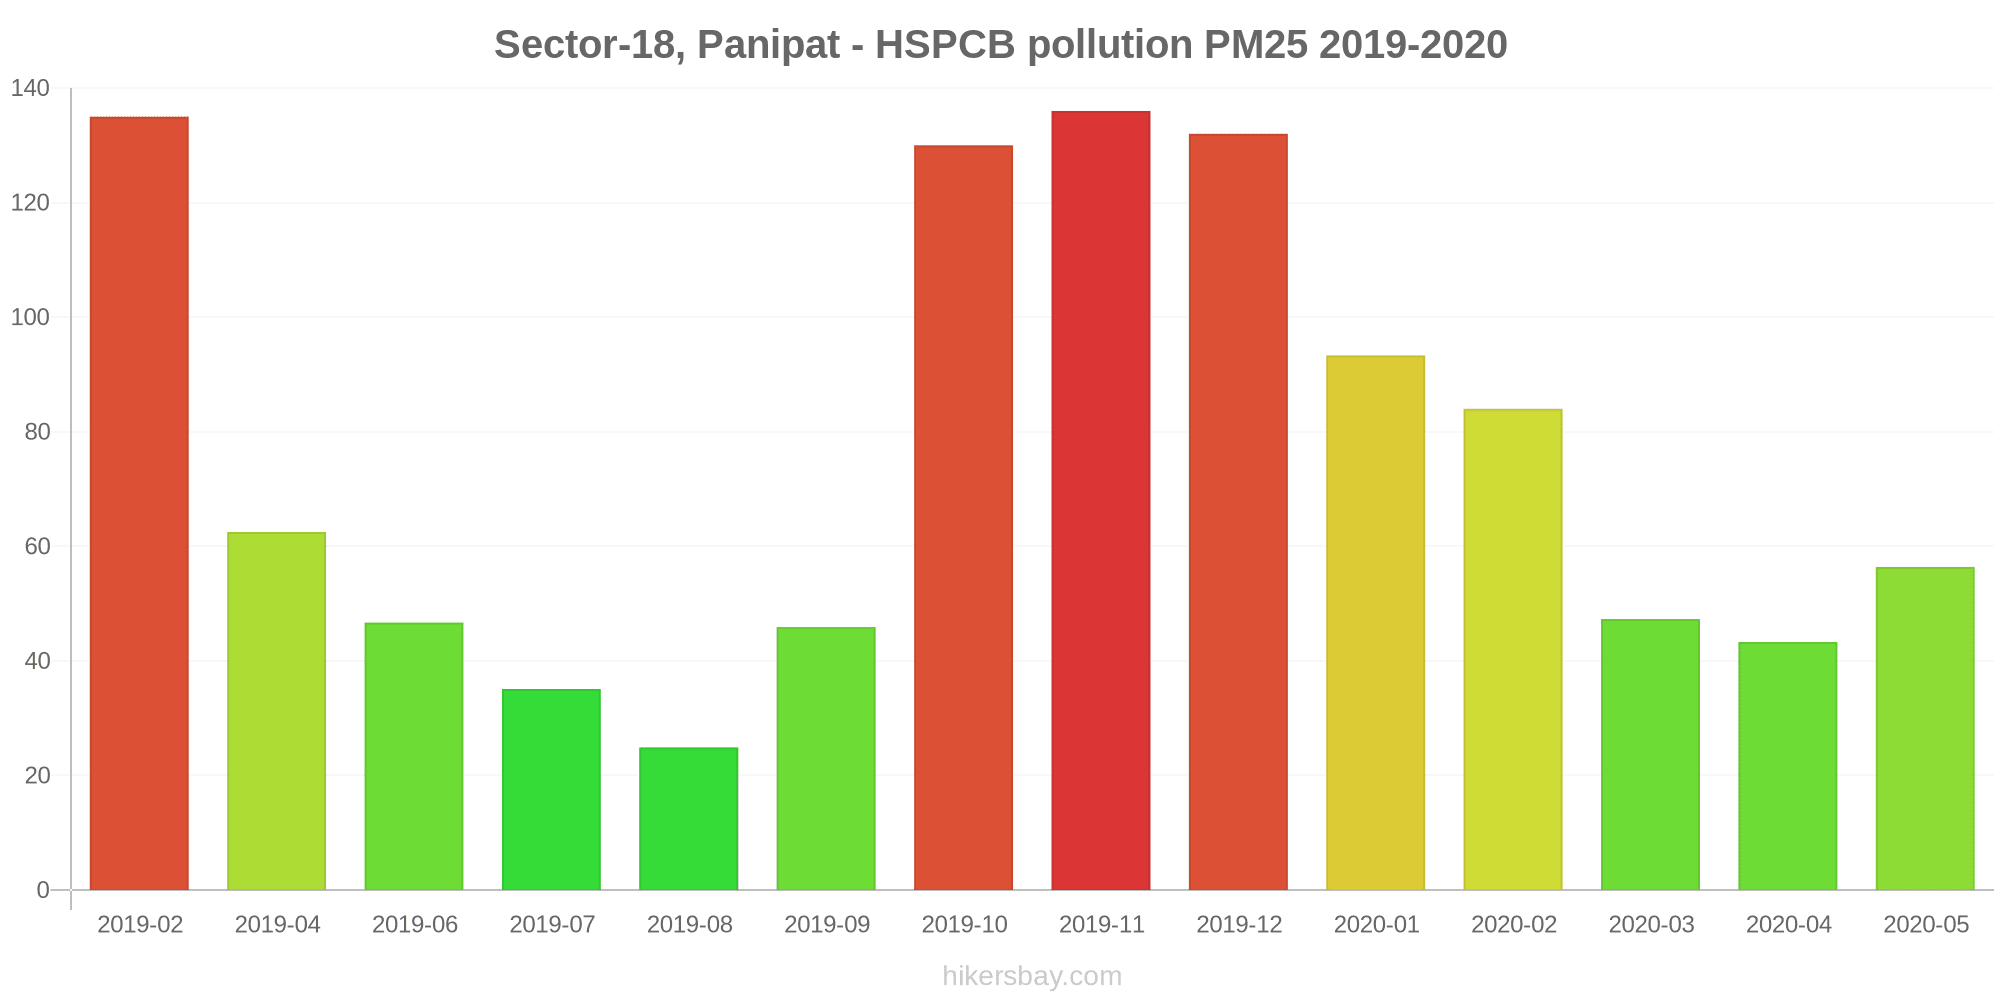
The highest PM2.5 values were recorded: 136 (November 2019).
The lowest level of particulate matter PM2.5 pollution occurs in month: August (25).
How high is the CO level? (carbon monoxide (CO))
2060 (Moderate)
How high is the level of NO2? (nitrogen dioxide (NO2))
24 (Good)
How is the O3 level today in Kaimla? (ozone (O3))
28 (Good)
Current data Monday, October 31, 2022, 1:45 AM
PM10 351 (Very bad Hazardous)
SO2 10 (Good)
PM2,5 90 (Very Unhealthy)
CO 2060 (Moderate)
NO2 24 (Good)
O3 28 (Good)
Data on air pollution from recent days in Kaimla
index
2022-10-31
pm10
351
Very bad Hazardous
so2
9
Good
pm25
92
Very Unhealthy
co
2290
Moderate
no2
25
Good
o3
30
Good
data source »
Air pollution in Kaimla from February 2019 to May 2020

index
2020-05
2020-04
2020-03
2020-02
2020-01
2019-12
2019-11
2019-10
2019-09
2019-08
2019-07
2019-06
2019-04
2019-02
pm25
56 (Unhealthy)
43 (Unhealthy for Sensitive Groups)
47 (Unhealthy for Sensitive Groups)
84 (Very Unhealthy)
93 (Very Unhealthy)
132 (Very bad Hazardous)
136 (Very bad Hazardous)
130 (Very bad Hazardous)
46 (Unhealthy for Sensitive Groups)
25 (Moderate)
35 (Unhealthy for Sensitive Groups)
47 (Unhealthy for Sensitive Groups)
63 (Unhealthy)
135 (Very bad Hazardous)
pm10
193 (Very bad Hazardous)
151 (Very bad Hazardous)
135 (Very Unhealthy)
252 (Very bad Hazardous)
262 (Very bad Hazardous)
370 (Very bad Hazardous)
302 (Very bad Hazardous)
286 (Very bad Hazardous)
98 (Unhealthy)
74 (Unhealthy for Sensitive Groups)
72 (Unhealthy for Sensitive Groups)
133 (Very Unhealthy)
275 (Very bad Hazardous)
167 (Very bad Hazardous)
no2
38 (Good)
51 (Moderate)
69 (Moderate)
86 (Moderate)
76 (Moderate)
71 (Moderate)
66 (Moderate)
76 (Moderate)
16 (Good)
13 (Good)
12 (Good)
21 (Good)
42 (Moderate)
35 (Good)
so2
143 (Unhealthy for Sensitive Groups)
61 (Moderate)
38 (Good)
32 (Good)
31 (Good)
62 (Moderate)
140 (Unhealthy for Sensitive Groups)
50 (Good)
125 (Unhealthy for Sensitive Groups)
183 (Unhealthy for Sensitive Groups)
21 (Good)
33 (Good)
22 (Good)
7.4 (Good)
co
693 (Good)
346 (Good)
360 (Good)
366 (Good)
531 (Good)
404 (Good)
809 (Good)
816 (Good)
400 (Good)
607 (Good)
565 (Good)
714 (Good)
639 (Good)
933 (Good)
o3
63 (Good)
36 (Good)
30 (Good)
28 (Good)
29 (Good)
42 (Good)
41 (Good)
50 (Good)
40 (Good)
21 (Good)
42 (Good)
67 (Good)
48 (Good)
24 (Good)
data source »
Sector-18, Panipat - HSPCB
Monday, October 31, 2022, 1:45 AM
PM10 351 (Very bad Hazardous)
particulate matter (PM10) suspended dust
SO2 9.5 (Good)
sulfur dioxide (SO2)
PM2,5 90 (Very Unhealthy)
particulate matter (PM2.5) dust
CO 2060 (Moderate)
carbon monoxide (CO)
NO2 24 (Good)
nitrogen dioxide (NO2)
O3 28 (Good)
ozone (O3)
Sector-18, Panipat - HSPCB
index
2022-10-31
pm10
351
so2
8.9
pm25
92
co
2290
no2
25
o3
30
Sector-18, Panipat - HSPCB
2019-02 2020-05

index
2020-05
2020-04
2020-03
2020-02
2020-01
2019-12
2019-11
2019-10
2019-09
2019-08
2019-07
2019-06
2019-04
2019-02
pm25
56
43
47
84
93
132
136
130
46
25
35
47
63
135
pm10
193
151
135
252
262
370
302
286
98
74
72
133
275
167
no2
38
51
69
86
76
71
66
76
16
13
12
21
42
35
so2
143
61
38
32
31
62
140
50
125
183
21
33
22
7.4
co
693
346
360
366
531
404
809
816
400
607
565
714
639
933
o3
63
36
30
28
29
42
41
50
40
21
42
67
48
24
* Pollution data source:
https://openaq.org
(caaqm)
The data is licensed under CC-By 4.0
PM10 351 (Very bad Hazardous)
SO2 10 (Good)
PM2,5 90 (Very Unhealthy)
CO 2060 (Moderate)
NO2 24 (Good)
O3 28 (Good)
Data on air pollution from recent days in Kaimla
| index | 2022-10-31 |
|---|---|
| pm10 | 351 Very bad Hazardous |
| so2 | 9 Good |
| pm25 | 92 Very Unhealthy |
| co | 2290 Moderate |
| no2 | 25 Good |
| o3 | 30 Good |

| index | 2020-05 | 2020-04 | 2020-03 | 2020-02 | 2020-01 | 2019-12 | 2019-11 | 2019-10 | 2019-09 | 2019-08 | 2019-07 | 2019-06 | 2019-04 | 2019-02 |
|---|---|---|---|---|---|---|---|---|---|---|---|---|---|---|
| pm25 | 56 (Unhealthy) | 43 (Unhealthy for Sensitive Groups) | 47 (Unhealthy for Sensitive Groups) | 84 (Very Unhealthy) | 93 (Very Unhealthy) | 132 (Very bad Hazardous) | 136 (Very bad Hazardous) | 130 (Very bad Hazardous) | 46 (Unhealthy for Sensitive Groups) | 25 (Moderate) | 35 (Unhealthy for Sensitive Groups) | 47 (Unhealthy for Sensitive Groups) | 63 (Unhealthy) | 135 (Very bad Hazardous) |
| pm10 | 193 (Very bad Hazardous) | 151 (Very bad Hazardous) | 135 (Very Unhealthy) | 252 (Very bad Hazardous) | 262 (Very bad Hazardous) | 370 (Very bad Hazardous) | 302 (Very bad Hazardous) | 286 (Very bad Hazardous) | 98 (Unhealthy) | 74 (Unhealthy for Sensitive Groups) | 72 (Unhealthy for Sensitive Groups) | 133 (Very Unhealthy) | 275 (Very bad Hazardous) | 167 (Very bad Hazardous) |
| no2 | 38 (Good) | 51 (Moderate) | 69 (Moderate) | 86 (Moderate) | 76 (Moderate) | 71 (Moderate) | 66 (Moderate) | 76 (Moderate) | 16 (Good) | 13 (Good) | 12 (Good) | 21 (Good) | 42 (Moderate) | 35 (Good) |
| so2 | 143 (Unhealthy for Sensitive Groups) | 61 (Moderate) | 38 (Good) | 32 (Good) | 31 (Good) | 62 (Moderate) | 140 (Unhealthy for Sensitive Groups) | 50 (Good) | 125 (Unhealthy for Sensitive Groups) | 183 (Unhealthy for Sensitive Groups) | 21 (Good) | 33 (Good) | 22 (Good) | 7.4 (Good) |
| co | 693 (Good) | 346 (Good) | 360 (Good) | 366 (Good) | 531 (Good) | 404 (Good) | 809 (Good) | 816 (Good) | 400 (Good) | 607 (Good) | 565 (Good) | 714 (Good) | 639 (Good) | 933 (Good) |
| o3 | 63 (Good) | 36 (Good) | 30 (Good) | 28 (Good) | 29 (Good) | 42 (Good) | 41 (Good) | 50 (Good) | 40 (Good) | 21 (Good) | 42 (Good) | 67 (Good) | 48 (Good) | 24 (Good) |
PM10 351 (Very bad Hazardous)
particulate matter (PM10) suspended dustSO2 9.5 (Good)
sulfur dioxide (SO2)PM2,5 90 (Very Unhealthy)
particulate matter (PM2.5) dustCO 2060 (Moderate)
carbon monoxide (CO)NO2 24 (Good)
nitrogen dioxide (NO2)O3 28 (Good)
ozone (O3)Sector-18, Panipat - HSPCB
| index | 2022-10-31 |
|---|---|
| pm10 | 351 |
| so2 | 8.9 |
| pm25 | 92 |
| co | 2290 |
| no2 | 25 |
| o3 | 30 |
Sector-18, Panipat - HSPCB
| index | 2020-05 | 2020-04 | 2020-03 | 2020-02 | 2020-01 | 2019-12 | 2019-11 | 2019-10 | 2019-09 | 2019-08 | 2019-07 | 2019-06 | 2019-04 | 2019-02 |
|---|---|---|---|---|---|---|---|---|---|---|---|---|---|---|
| pm25 | 56 | 43 | 47 | 84 | 93 | 132 | 136 | 130 | 46 | 25 | 35 | 47 | 63 | 135 |
| pm10 | 193 | 151 | 135 | 252 | 262 | 370 | 302 | 286 | 98 | 74 | 72 | 133 | 275 | 167 |
| no2 | 38 | 51 | 69 | 86 | 76 | 71 | 66 | 76 | 16 | 13 | 12 | 21 | 42 | 35 |
| so2 | 143 | 61 | 38 | 32 | 31 | 62 | 140 | 50 | 125 | 183 | 21 | 33 | 22 | 7.4 |
| co | 693 | 346 | 360 | 366 | 531 | 404 | 809 | 816 | 400 | 607 | 565 | 714 | 639 | 933 |
| o3 | 63 | 36 | 30 | 28 | 29 | 42 | 41 | 50 | 40 | 21 | 42 | 67 | 48 | 24 |