Air Pollution in Ahmedabad: Real-time Air Quality Index and smog alert.
Pollution and air quality forecast for Ahmedabad. Today is Wednesday, June 17, 2026. The following air pollution values have been recorded for Ahmedabad:- nitrogen dioxide (NO2) - 53 (Moderate)
- carbon monoxide (CO) - 470 (Good)
- particulate matter (PM2.5) dust - 48 (Unhealthy for Sensitive Groups)
- ozone (O3) - 1 (Good)
- sulfur dioxide (SO2) - 56 (Moderate)
- particulate matter (PM10) suspended dust - 120 (Very Unhealthy)

What is the air quality in Ahmedabad today? Is the air polluted in Ahmedabad?. Is there smog?
How high is the level of NO2? (nitrogen dioxide (NO2))
53 (Moderate)
How high is the CO level? (carbon monoxide (CO))
470 (Good)
What is the current level of PM2.5 in Ahmedabad? (particulate matter (PM2.5) dust)
Today's PM2.5 level is:
48 (Unhealthy for Sensitive Groups)
For comparison, the highest level of PM2.5 in Ahmedabad in the last 7 days was: 44 (Monday, October 31, 2022) and the lowest: 44 (Monday, October 31, 2022).
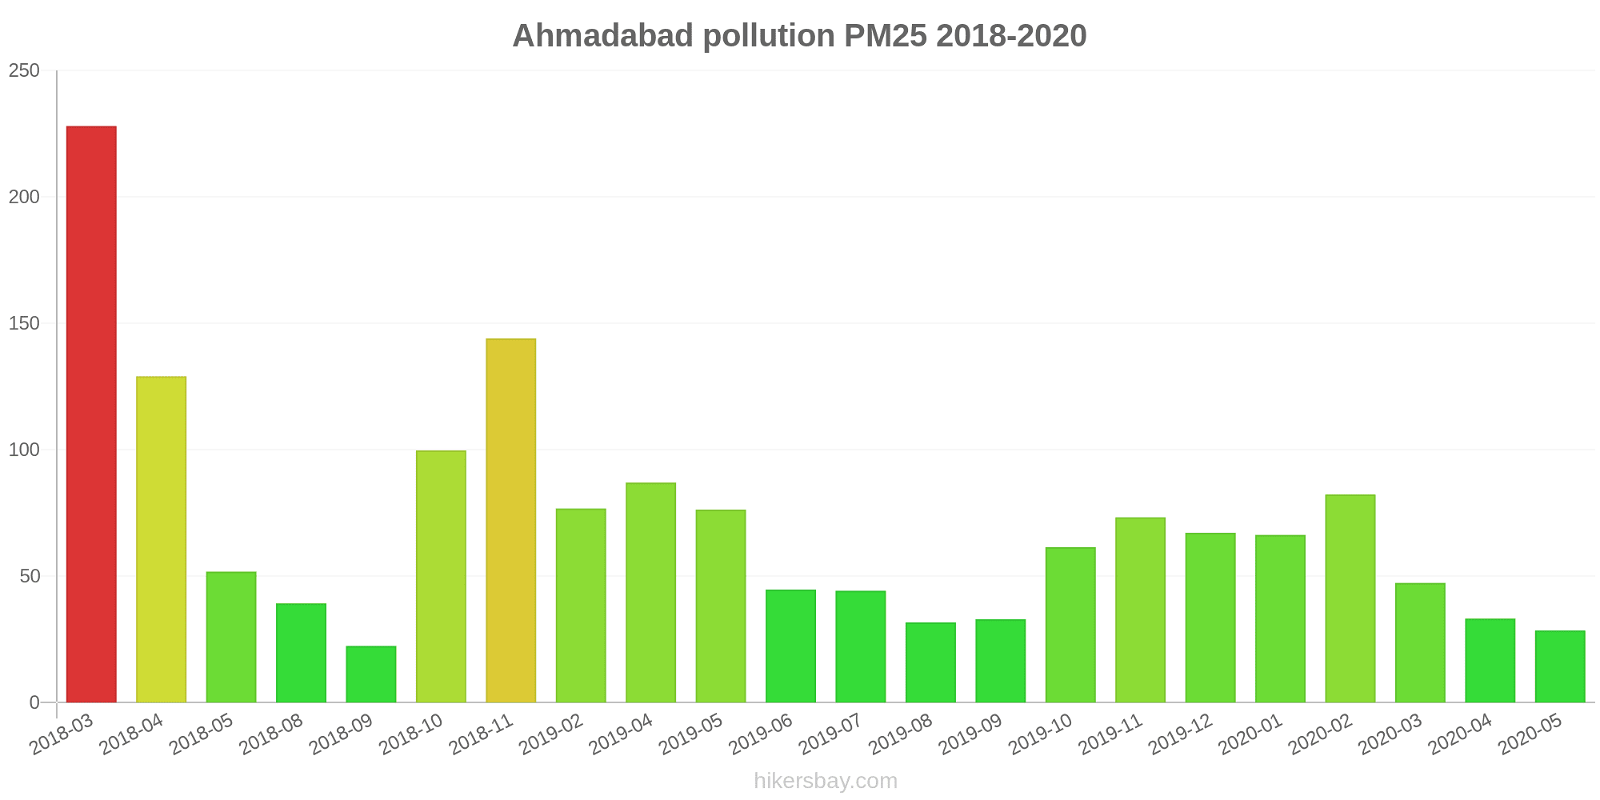
The highest PM2.5 values were recorded: 228 (March 2018).
The lowest level of particulate matter PM2.5 pollution occurs in month: September (22).
How is the O3 level today in Ahmedabad? (ozone (O3))
1 (Good)
What is the level of SO2 pollution? (sulfur dioxide (SO2))
56 (Moderate)
What is the level of PM10 today in Ahmedabad? (particulate matter (PM10) suspended dust)
The current level of particulate matter PM10 in Ahmedabad is:
120 (Very Unhealthy)
The highest PM10 values usually occur in month: 194 (February 2019).
The lowest value of particulate matter PM10 pollution in Ahmedabad is usually recorded in: May (70).
Current data Monday, October 31, 2022, 2:00 AM
NO2 53 (Moderate)
CO 470 (Good)
PM2,5 48 (Unhealthy for Sensitive Groups)
O3 1 (Good)
SO2 56 (Moderate)
PM10 120 (Very Unhealthy)
Data on air pollution from recent days in Ahmedabad
index
2022-10-31
no2
61
Moderate
co
475
Good
pm25
44
Unhealthy for Sensitive Groups
o3
1
Good
so2
56
Moderate
pm10
76
Unhealthy for Sensitive Groups
data source »
Air pollution in Ahmedabad from March 2018 to May 2020
index
2020-05
2020-04
2020-03
2020-02
2020-01
2019-12
2019-11
2019-10
2019-09
2019-08
2019-07
2019-06
2019-05
2019-04
2019-02
2018-11
2018-10
2018-09
2018-08
2018-05
2018-04
2018-03
pm25
29 (Moderate)
33 (Moderate)
47 (Unhealthy for Sensitive Groups)
82 (Very Unhealthy)
66 (Unhealthy)
67 (Unhealthy)
73 (Unhealthy)
61 (Unhealthy)
33 (Moderate)
32 (Moderate)
44 (Unhealthy for Sensitive Groups)
45 (Unhealthy for Sensitive Groups)
76 (Very Unhealthy)
87 (Very Unhealthy)
77 (Very Unhealthy)
144 (Very bad Hazardous)
100 (Very Unhealthy)
22 (Moderate)
39 (Unhealthy for Sensitive Groups)
52 (Unhealthy for Sensitive Groups)
129 (Very bad Hazardous)
228 (Very bad Hazardous)
pm10
70 (Unhealthy for Sensitive Groups)
75 (Unhealthy for Sensitive Groups)
122 (Very Unhealthy)
176 (Very bad Hazardous)
146 (Very Unhealthy)
145 (Very Unhealthy)
155 (Very bad Hazardous)
143 (Very Unhealthy)
91 (Unhealthy)
109 (Unhealthy)
99 (Unhealthy)
103 (Unhealthy)
175 (Very bad Hazardous)
164 (Very bad Hazardous)
194 (Very bad Hazardous)
- (Good)
- (Good)
- (Good)
- (Good)
- (Good)
- (Good)
- (Good)
no2
12 (Good)
20 (Good)
35 (Good)
46 (Moderate)
49 (Moderate)
37 (Good)
86 (Moderate)
85 (Moderate)
51 (Moderate)
65 (Moderate)
99 (Moderate)
104 (Unhealthy for Sensitive Groups)
97 (Moderate)
64 (Moderate)
78 (Moderate)
92 (Moderate)
102 (Unhealthy for Sensitive Groups)
82 (Moderate)
58 (Moderate)
30 (Good)
65 (Moderate)
133 (Unhealthy for Sensitive Groups)
co
638 (Good)
610 (Good)
558 (Good)
444 (Good)
393 (Good)
328 (Good)
1 (Good)
1 (Good)
293 (Good)
222 (Good)
198 (Good)
234 (Good)
735 (Good)
817 (Good)
798 (Good)
1 (Good)
1 (Good)
412 (Good)
485 (Good)
1 (Good)
28 (Good)
66 (Good)
o3
38 (Good)
32 (Good)
33 (Good)
36 (Good)
18 (Good)
20 (Good)
23 (Good)
54 (Good)
27 (Good)
37 (Good)
66 (Good)
45 (Good)
18 (Good)
38 (Good)
48 (Good)
42 (Good)
37 (Good)
20 (Good)
9.2 (Good)
21 (Good)
39 (Good)
34 (Good)
so2
9.6 (Good)
14 (Good)
44 (Good)
47 (Good)
37 (Good)
36 (Good)
108 (Unhealthy for Sensitive Groups)
100 (Unhealthy for Sensitive Groups)
44 (Good)
25 (Good)
63 (Moderate)
17 (Good)
143 (Unhealthy for Sensitive Groups)
77 (Moderate)
51 (Moderate)
77 (Moderate)
133 (Unhealthy for Sensitive Groups)
64 (Moderate)
102 (Unhealthy for Sensitive Groups)
105 (Unhealthy for Sensitive Groups)
90 (Moderate)
88 (Moderate)
data source »
Quality of life in Ahmedabad
Green and Parks in the City
Ahmedabad
46%
Nepal: 32%
Bangladesh: 33%
Bhutan: 82%
Sri Lanka: 59%
Pakistan: 49%
particulate matter PM2.5
Ahmedabad
65 (Unhealthy)
Pleasure of spending time in the city
Ahmedabad
40%
Nepal: 32%
Bangladesh: 26%
Bhutan: 61%
Sri Lanka: 52%
Pakistan: 43%
particulate matter PM10
Ahmedabad
120 (Very Unhealthy)
Air Pollution
Ahmedabad
67%
Nepal: 76%
Bangladesh: 78%
Bhutan: 45%
Sri Lanka: 53%
Pakistan: 64%
Garbage Disposal
Ahmedabad
37%
Nepal: 25%
Bangladesh: 22%
Bhutan: 47%
Sri Lanka: 41%
Pakistan: 34%
Availability and quality of drinking water
Ahmedabad
54%
Nepal: 36%
Bangladesh: 44%
Bhutan: 64%
Sri Lanka: 65%
Pakistan: 44%
Cleanliness and tidiness
Ahmedabad
39%
Nepal: 27%
Bangladesh: 23%
Bhutan: 57%
Sri Lanka: 52%
Pakistan: 40%
Noise and Light pollution
Ahmedabad
63%
Nepal: 55%
Bangladesh: 63%
Bhutan: 55%
Sri Lanka: 50%
Pakistan: 59%
Water Pollution
Ahmedabad
66%
Nepal: 76%
Bangladesh: 74%
Bhutan: 56%
Sri Lanka: 57%
Pakistan: 70%
Source: Numbeo
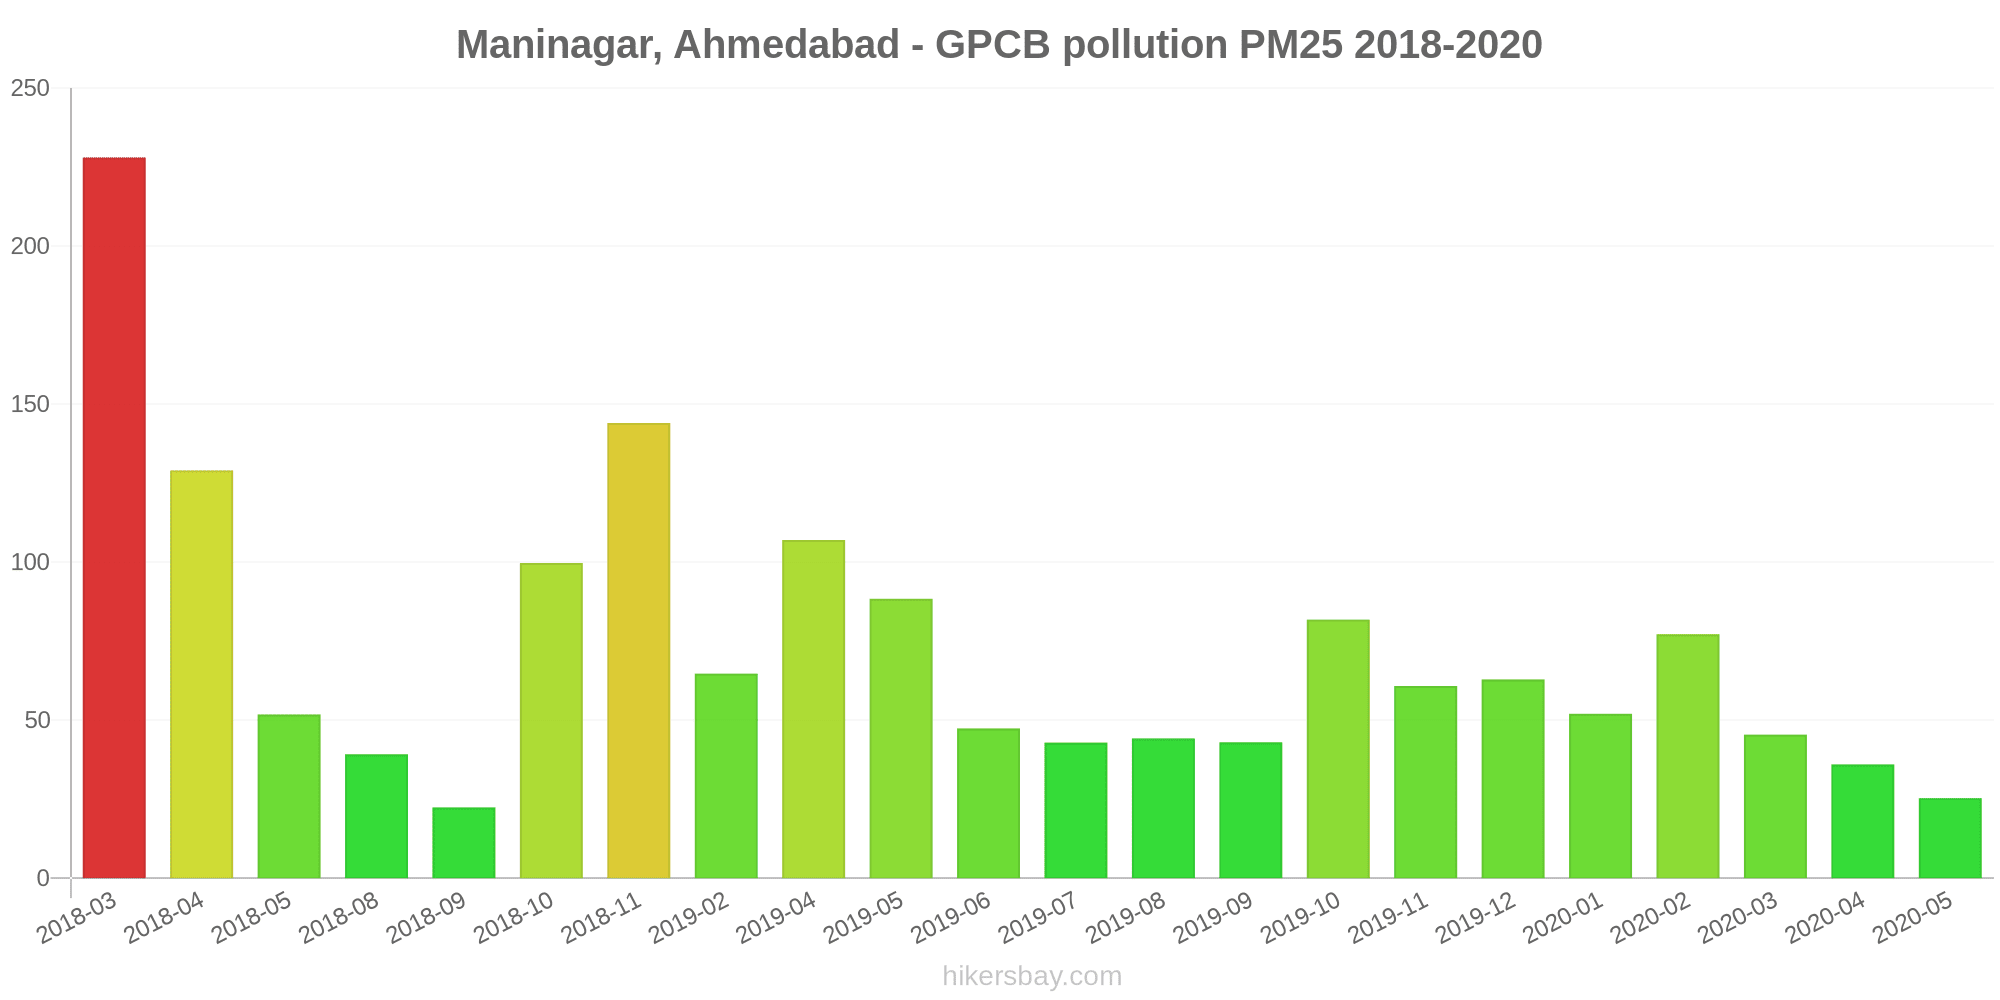
Maninagar, Ahmedabad - GPCB
Monday, October 31, 2022, 1:45 AM
NO2 74 (Moderate)
nitrogen dioxide (NO2)
CO 180 (Good)
carbon monoxide (CO)
PM2,5 44 (Unhealthy for Sensitive Groups)
particulate matter (PM2.5) dust
O3 0.64 (Good)
ozone (O3)
SO2 109 (Unhealthy for Sensitive Groups)
sulfur dioxide (SO2)
PM10 180 (Very bad Hazardous)
particulate matter (PM10) suspended dust
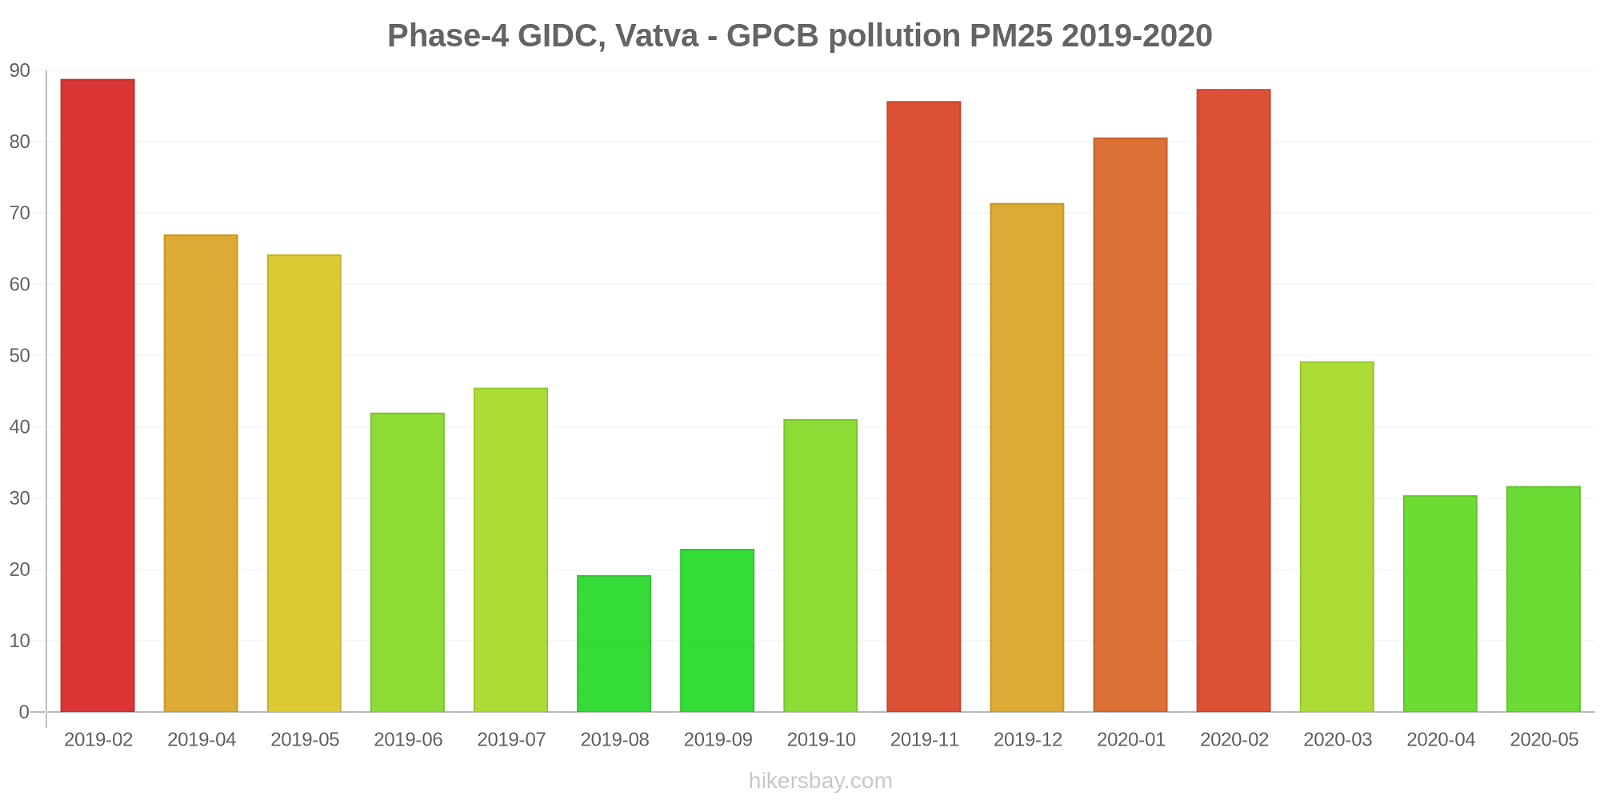
Phase-4 GIDC, Vatva - GPCB
Monday, October 31, 2022, 2:00 AM
PM10 60 (Unhealthy for Sensitive Groups)
particulate matter (PM10) suspended dust
SO2 3.1 (Good)
sulfur dioxide (SO2)
PM2,5 53 (Unhealthy for Sensitive Groups)
particulate matter (PM2.5) dust
CO 760 (Good)
carbon monoxide (CO)
NO2 33 (Good)
nitrogen dioxide (NO2)
O3 1.8 (Good)
ozone (O3)
Maninagar, Ahmedabad - GPCB
index
2022-10-31
no2
89
co
180
pm25
44
o3
0.6
so2
110
pm10
90
Phase-4 GIDC, Vatva - GPCB
index
2022-10-31
pm10
61
so2
3.3
pm25
45
co
770
no2
32
o3
1.8
Maninagar, Ahmedabad - GPCB
2018-03 2020-05

index
2020-05
2020-04
2020-03
2020-02
2020-01
2019-12
2019-11
2019-10
2019-09
2019-08
2019-07
2019-06
2019-05
2019-04
2019-02
2018-11
2018-10
2018-09
2018-08
2018-05
2018-04
2018-03
pm25
25
36
45
77
52
63
61
82
43
44
43
47
88
107
65
144
100
22
39
52
129
228
no2
17
23
33
62
19
38
142
149
86
46
112
170
69
49
69
92
102
82
58
30
65
133
co
611
419
558
887
784
655
1
1
2
1
1
1
829
905
630
1
1
412
485
1
28
66
o3
53
47
43
49
25
29
25
84
45
43
52
71
-
43
45
42
37
20
9.2
21
39
34
so2
14
21
47
68
51
54
199
194
87
43
101
30
250
65
60
77
133
64
102
105
90
88
pm10
72
81
105
144
114
108
110
147
107
133
-
-
-
-
-
-
-
-
-
-
-
-
Phase-4 GIDC, Vatva - GPCB
2019-02 2020-05
index
2020-05
2020-04
2020-03
2020-02
2020-01
2019-12
2019-11
2019-10
2019-09
2019-08
2019-07
2019-06
2019-05
2019-04
2019-02
pm25
32
30
49
87
81
71
86
41
23
19
46
42
64
67
89
pm10
67
69
139
208
178
181
199
138
74
85
99
103
175
164
194
no2
6.8
18
37
30
80
36
29
21
15
84
86
38
124
79
88
so2
5.1
6.7
40
26
22
18
18
6.3
2
6
24
3.5
37
89
41
co
664
801
558
1
1
1
1
1
584
442
395
466
641
728
965
o3
22
18
23
23
12
12
20
25
7.7
30
80
19
18
32
50
* Pollution data source:
https://openaq.org
(caaqm)
The data is licensed under CC-By 4.0
NO2 53 (Moderate)
CO 470 (Good)
PM2,5 48 (Unhealthy for Sensitive Groups)
O3 1 (Good)
SO2 56 (Moderate)
PM10 120 (Very Unhealthy)
Data on air pollution from recent days in Ahmedabad
| index | 2022-10-31 |
|---|---|
| no2 | 61 Moderate |
| co | 475 Good |
| pm25 | 44 Unhealthy for Sensitive Groups |
| o3 | 1 Good |
| so2 | 56 Moderate |
| pm10 | 76 Unhealthy for Sensitive Groups |

| index | 2020-05 | 2020-04 | 2020-03 | 2020-02 | 2020-01 | 2019-12 | 2019-11 | 2019-10 | 2019-09 | 2019-08 | 2019-07 | 2019-06 | 2019-05 | 2019-04 | 2019-02 | 2018-11 | 2018-10 | 2018-09 | 2018-08 | 2018-05 | 2018-04 | 2018-03 |
|---|---|---|---|---|---|---|---|---|---|---|---|---|---|---|---|---|---|---|---|---|---|---|
| pm25 | 29 (Moderate) | 33 (Moderate) | 47 (Unhealthy for Sensitive Groups) | 82 (Very Unhealthy) | 66 (Unhealthy) | 67 (Unhealthy) | 73 (Unhealthy) | 61 (Unhealthy) | 33 (Moderate) | 32 (Moderate) | 44 (Unhealthy for Sensitive Groups) | 45 (Unhealthy for Sensitive Groups) | 76 (Very Unhealthy) | 87 (Very Unhealthy) | 77 (Very Unhealthy) | 144 (Very bad Hazardous) | 100 (Very Unhealthy) | 22 (Moderate) | 39 (Unhealthy for Sensitive Groups) | 52 (Unhealthy for Sensitive Groups) | 129 (Very bad Hazardous) | 228 (Very bad Hazardous) |
| pm10 | 70 (Unhealthy for Sensitive Groups) | 75 (Unhealthy for Sensitive Groups) | 122 (Very Unhealthy) | 176 (Very bad Hazardous) | 146 (Very Unhealthy) | 145 (Very Unhealthy) | 155 (Very bad Hazardous) | 143 (Very Unhealthy) | 91 (Unhealthy) | 109 (Unhealthy) | 99 (Unhealthy) | 103 (Unhealthy) | 175 (Very bad Hazardous) | 164 (Very bad Hazardous) | 194 (Very bad Hazardous) | - (Good) | - (Good) | - (Good) | - (Good) | - (Good) | - (Good) | - (Good) |
| no2 | 12 (Good) | 20 (Good) | 35 (Good) | 46 (Moderate) | 49 (Moderate) | 37 (Good) | 86 (Moderate) | 85 (Moderate) | 51 (Moderate) | 65 (Moderate) | 99 (Moderate) | 104 (Unhealthy for Sensitive Groups) | 97 (Moderate) | 64 (Moderate) | 78 (Moderate) | 92 (Moderate) | 102 (Unhealthy for Sensitive Groups) | 82 (Moderate) | 58 (Moderate) | 30 (Good) | 65 (Moderate) | 133 (Unhealthy for Sensitive Groups) |
| co | 638 (Good) | 610 (Good) | 558 (Good) | 444 (Good) | 393 (Good) | 328 (Good) | 1 (Good) | 1 (Good) | 293 (Good) | 222 (Good) | 198 (Good) | 234 (Good) | 735 (Good) | 817 (Good) | 798 (Good) | 1 (Good) | 1 (Good) | 412 (Good) | 485 (Good) | 1 (Good) | 28 (Good) | 66 (Good) |
| o3 | 38 (Good) | 32 (Good) | 33 (Good) | 36 (Good) | 18 (Good) | 20 (Good) | 23 (Good) | 54 (Good) | 27 (Good) | 37 (Good) | 66 (Good) | 45 (Good) | 18 (Good) | 38 (Good) | 48 (Good) | 42 (Good) | 37 (Good) | 20 (Good) | 9.2 (Good) | 21 (Good) | 39 (Good) | 34 (Good) |
| so2 | 9.6 (Good) | 14 (Good) | 44 (Good) | 47 (Good) | 37 (Good) | 36 (Good) | 108 (Unhealthy for Sensitive Groups) | 100 (Unhealthy for Sensitive Groups) | 44 (Good) | 25 (Good) | 63 (Moderate) | 17 (Good) | 143 (Unhealthy for Sensitive Groups) | 77 (Moderate) | 51 (Moderate) | 77 (Moderate) | 133 (Unhealthy for Sensitive Groups) | 64 (Moderate) | 102 (Unhealthy for Sensitive Groups) | 105 (Unhealthy for Sensitive Groups) | 90 (Moderate) | 88 (Moderate) |
Green and Parks in the City
Ahmedabad 46%
Nepal: 32% Bangladesh: 33% Bhutan: 82% Sri Lanka: 59% Pakistan: 49%particulate matter PM2.5
Ahmedabad 65 (Unhealthy)
Pleasure of spending time in the city
Ahmedabad 40%
Nepal: 32% Bangladesh: 26% Bhutan: 61% Sri Lanka: 52% Pakistan: 43%particulate matter PM10
Ahmedabad 120 (Very Unhealthy)
Air Pollution
Ahmedabad 67%
Nepal: 76% Bangladesh: 78% Bhutan: 45% Sri Lanka: 53% Pakistan: 64%Garbage Disposal
Ahmedabad 37%
Nepal: 25% Bangladesh: 22% Bhutan: 47% Sri Lanka: 41% Pakistan: 34%Availability and quality of drinking water
Ahmedabad 54%
Nepal: 36% Bangladesh: 44% Bhutan: 64% Sri Lanka: 65% Pakistan: 44%Cleanliness and tidiness
Ahmedabad 39%
Nepal: 27% Bangladesh: 23% Bhutan: 57% Sri Lanka: 52% Pakistan: 40%Noise and Light pollution
Ahmedabad 63%
Nepal: 55% Bangladesh: 63% Bhutan: 55% Sri Lanka: 50% Pakistan: 59%Water Pollution
Ahmedabad 66%
Nepal: 76% Bangladesh: 74% Bhutan: 56% Sri Lanka: 57% Pakistan: 70%NO2 74 (Moderate)
nitrogen dioxide (NO2)CO 180 (Good)
carbon monoxide (CO)PM2,5 44 (Unhealthy for Sensitive Groups)
particulate matter (PM2.5) dustO3 0.64 (Good)
ozone (O3)SO2 109 (Unhealthy for Sensitive Groups)
sulfur dioxide (SO2)PM10 180 (Very bad Hazardous)
particulate matter (PM10) suspended dustPM10 60 (Unhealthy for Sensitive Groups)
particulate matter (PM10) suspended dustSO2 3.1 (Good)
sulfur dioxide (SO2)PM2,5 53 (Unhealthy for Sensitive Groups)
particulate matter (PM2.5) dustCO 760 (Good)
carbon monoxide (CO)NO2 33 (Good)
nitrogen dioxide (NO2)O3 1.8 (Good)
ozone (O3)Maninagar, Ahmedabad - GPCB
| index | 2022-10-31 |
|---|---|
| no2 | 89 |
| co | 180 |
| pm25 | 44 |
| o3 | 0.6 |
| so2 | 110 |
| pm10 | 90 |
Phase-4 GIDC, Vatva - GPCB
| index | 2022-10-31 |
|---|---|
| pm10 | 61 |
| so2 | 3.3 |
| pm25 | 45 |
| co | 770 |
| no2 | 32 |
| o3 | 1.8 |
Maninagar, Ahmedabad - GPCB
| index | 2020-05 | 2020-04 | 2020-03 | 2020-02 | 2020-01 | 2019-12 | 2019-11 | 2019-10 | 2019-09 | 2019-08 | 2019-07 | 2019-06 | 2019-05 | 2019-04 | 2019-02 | 2018-11 | 2018-10 | 2018-09 | 2018-08 | 2018-05 | 2018-04 | 2018-03 |
|---|---|---|---|---|---|---|---|---|---|---|---|---|---|---|---|---|---|---|---|---|---|---|
| pm25 | 25 | 36 | 45 | 77 | 52 | 63 | 61 | 82 | 43 | 44 | 43 | 47 | 88 | 107 | 65 | 144 | 100 | 22 | 39 | 52 | 129 | 228 |
| no2 | 17 | 23 | 33 | 62 | 19 | 38 | 142 | 149 | 86 | 46 | 112 | 170 | 69 | 49 | 69 | 92 | 102 | 82 | 58 | 30 | 65 | 133 |
| co | 611 | 419 | 558 | 887 | 784 | 655 | 1 | 1 | 2 | 1 | 1 | 1 | 829 | 905 | 630 | 1 | 1 | 412 | 485 | 1 | 28 | 66 |
| o3 | 53 | 47 | 43 | 49 | 25 | 29 | 25 | 84 | 45 | 43 | 52 | 71 | - | 43 | 45 | 42 | 37 | 20 | 9.2 | 21 | 39 | 34 |
| so2 | 14 | 21 | 47 | 68 | 51 | 54 | 199 | 194 | 87 | 43 | 101 | 30 | 250 | 65 | 60 | 77 | 133 | 64 | 102 | 105 | 90 | 88 |
| pm10 | 72 | 81 | 105 | 144 | 114 | 108 | 110 | 147 | 107 | 133 | - | - | - | - | - | - | - | - | - | - | - | - |
Phase-4 GIDC, Vatva - GPCB

| index | 2020-05 | 2020-04 | 2020-03 | 2020-02 | 2020-01 | 2019-12 | 2019-11 | 2019-10 | 2019-09 | 2019-08 | 2019-07 | 2019-06 | 2019-05 | 2019-04 | 2019-02 |
|---|---|---|---|---|---|---|---|---|---|---|---|---|---|---|---|
| pm25 | 32 | 30 | 49 | 87 | 81 | 71 | 86 | 41 | 23 | 19 | 46 | 42 | 64 | 67 | 89 |
| pm10 | 67 | 69 | 139 | 208 | 178 | 181 | 199 | 138 | 74 | 85 | 99 | 103 | 175 | 164 | 194 |
| no2 | 6.8 | 18 | 37 | 30 | 80 | 36 | 29 | 21 | 15 | 84 | 86 | 38 | 124 | 79 | 88 |
| so2 | 5.1 | 6.7 | 40 | 26 | 22 | 18 | 18 | 6.3 | 2 | 6 | 24 | 3.5 | 37 | 89 | 41 |
| co | 664 | 801 | 558 | 1 | 1 | 1 | 1 | 1 | 584 | 442 | 395 | 466 | 641 | 728 | 965 |
| o3 | 22 | 18 | 23 | 23 | 12 | 12 | 20 | 25 | 7.7 | 30 | 80 | 19 | 18 | 32 | 50 |