Air Pollution in Ajmer: Real-time Air Quality Index and smog alert.
Pollution and air quality forecast for Ajmer. Today is Wednesday, May 13, 2026. The following air pollution values have been recorded for Ajmer:- particulate matter (PM10) suspended dust - 103 (Unhealthy)
- sulfur dioxide (SO2) - 10 (Good)
- particulate matter (PM2.5) dust - 64 (Unhealthy)
- carbon monoxide (CO) - 670 (Good)
- nitrogen dioxide (NO2) - 27 (Good)
- ozone (O3) - 5 (Good)

What is the air quality in Ajmer today? Is the air polluted in Ajmer?. Is there smog?
What is the level of PM10 today in Ajmer? (particulate matter (PM10) suspended dust)
The current level of particulate matter PM10 in Ajmer is:
103 (Unhealthy)
The highest PM10 values usually occur in month: 183 (May 2019).
The lowest value of particulate matter PM10 pollution in Ajmer is usually recorded in: August (56).
What is the level of SO2 pollution? (sulfur dioxide (SO2))
10 (Good)
What is the current level of PM2.5 in Ajmer? (particulate matter (PM2.5) dust)
Today's PM2.5 level is:
64 (Unhealthy)
For comparison, the highest level of PM2.5 in Ajmer in the last 7 days was: 54 (Monday, October 31, 2022) and the lowest: 54 (Monday, October 31, 2022).
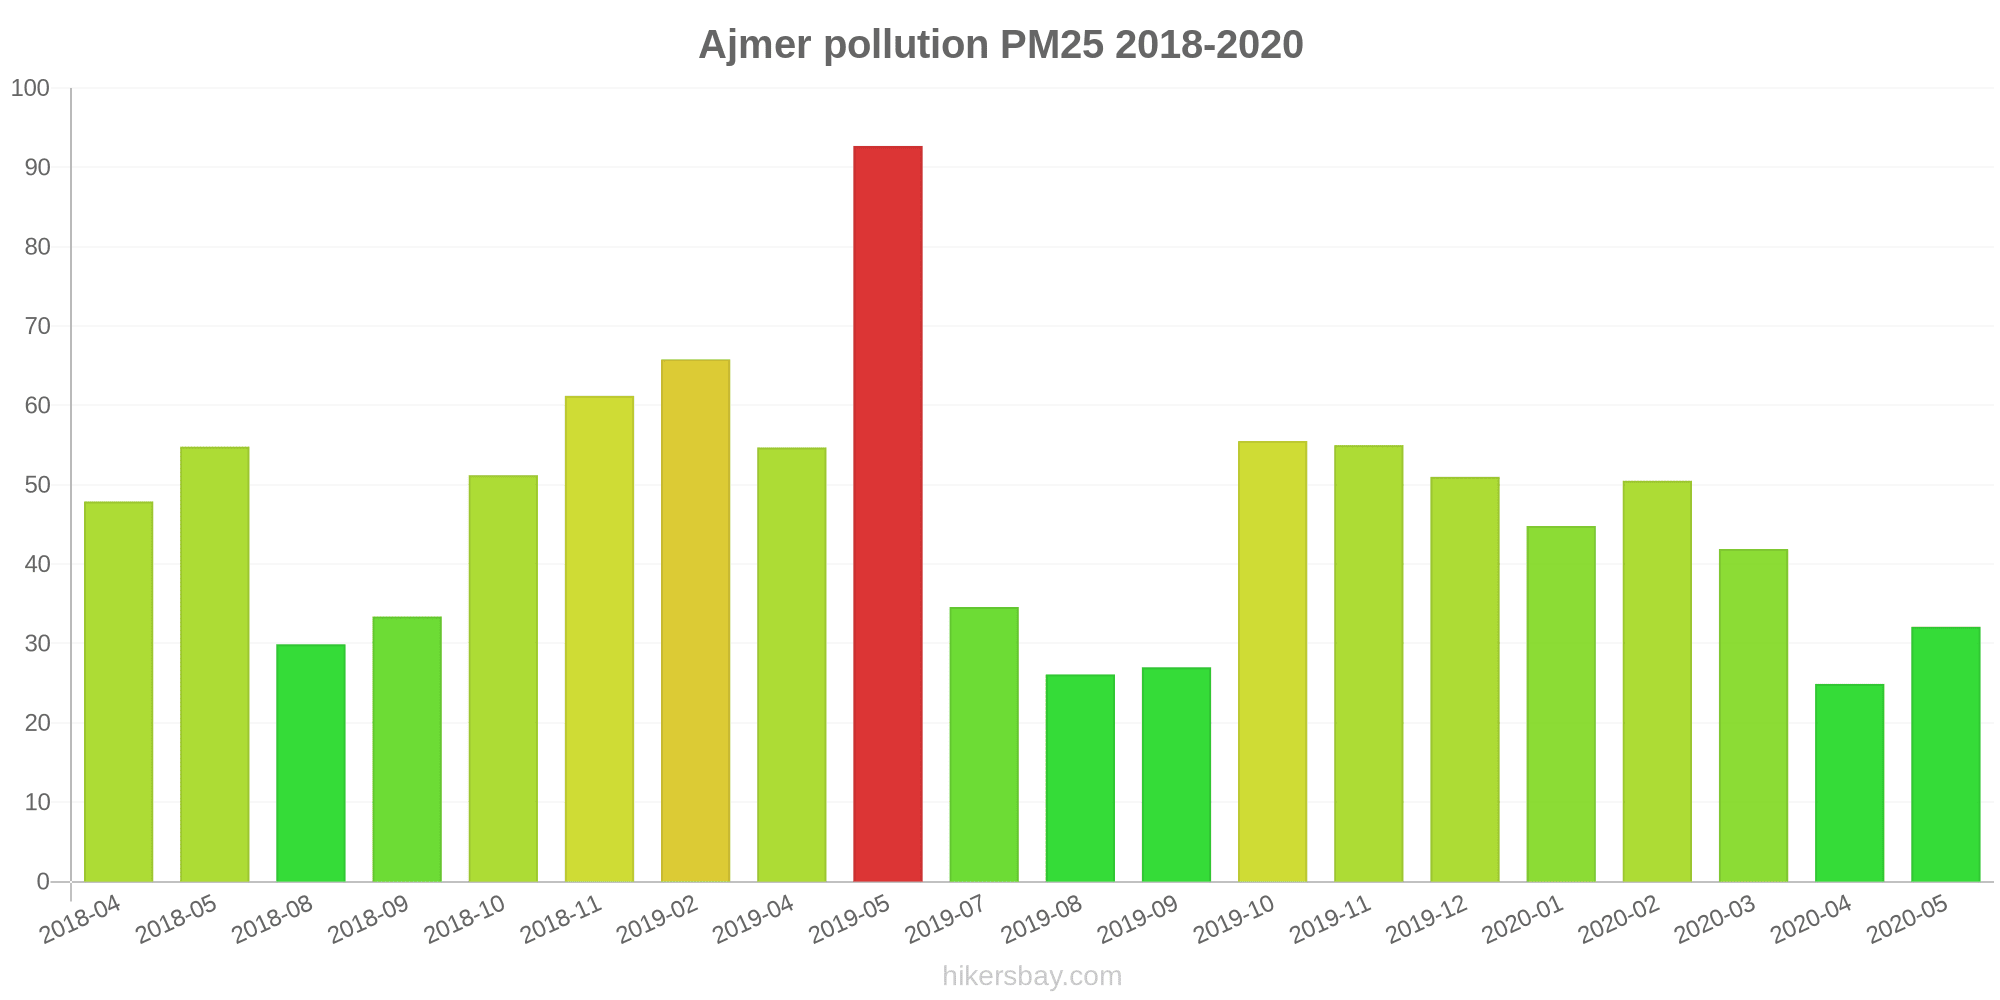
The highest PM2.5 values were recorded: 93 (May 2019).
The lowest level of particulate matter PM2.5 pollution occurs in month: April (25).
How high is the CO level? (carbon monoxide (CO))
670 (Good)
How high is the level of NO2? (nitrogen dioxide (NO2))
27 (Good)
How is the O3 level today in Ajmer? (ozone (O3))
5 (Good)
Current data Monday, October 31, 2022, 1:45 AM
PM10 103 (Unhealthy)
SO2 10 (Good)
PM2,5 64 (Unhealthy)
CO 670 (Good)
NO2 27 (Good)
O3 5 (Good)
Data on air pollution from recent days in Ajmer
index
2022-10-31
pm10
102
Unhealthy
so2
11
Good
pm25
54
Unhealthy for Sensitive Groups
co
635
Good
no2
22
Good
o3
6
Good
data source »
Air pollution in Ajmer from April 2018 to May 2020

index
2020-05
2020-04
2020-03
2020-02
2020-01
2019-12
2019-11
2019-10
2019-09
2019-08
2019-07
2019-05
2019-04
2019-02
2018-11
2018-10
2018-09
2018-08
2018-05
2018-04
pm25
32 (Moderate)
25 (Moderate)
42 (Unhealthy for Sensitive Groups)
51 (Unhealthy for Sensitive Groups)
45 (Unhealthy for Sensitive Groups)
51 (Unhealthy for Sensitive Groups)
55 (Unhealthy)
56 (Unhealthy)
27 (Moderate)
26 (Moderate)
35 (Moderate)
93 (Very Unhealthy)
55 (Unhealthy for Sensitive Groups)
66 (Unhealthy)
61 (Unhealthy)
51 (Unhealthy for Sensitive Groups)
33 (Moderate)
30 (Moderate)
55 (Unhealthy for Sensitive Groups)
48 (Unhealthy for Sensitive Groups)
pm10
66 (Unhealthy for Sensitive Groups)
59 (Unhealthy for Sensitive Groups)
89 (Unhealthy)
110 (Very Unhealthy)
88 (Unhealthy)
105 (Unhealthy)
108 (Unhealthy)
95 (Unhealthy)
57 (Unhealthy for Sensitive Groups)
56 (Unhealthy for Sensitive Groups)
76 (Unhealthy for Sensitive Groups)
183 (Very bad Hazardous)
132 (Very Unhealthy)
107 (Unhealthy)
130 (Very Unhealthy)
110 (Very Unhealthy)
67 (Unhealthy for Sensitive Groups)
65 (Unhealthy for Sensitive Groups)
89 (Unhealthy)
100 (Unhealthy)
no2
16 (Good)
9.8 (Good)
16 (Good)
34 (Good)
28 (Good)
33 (Good)
30 (Good)
32 (Good)
16 (Good)
17 (Good)
16 (Good)
20 (Good)
27 (Good)
34 (Good)
48 (Moderate)
32 (Good)
22 (Good)
18 (Good)
21 (Good)
24 (Good)
so2
11 (Good)
7.2 (Good)
6.8 (Good)
8.2 (Good)
6.1 (Good)
6.7 (Good)
5.5 (Good)
7.3 (Good)
6.4 (Good)
5.5 (Good)
7.9 (Good)
5.6 (Good)
7.8 (Good)
6.6 (Good)
8.5 (Good)
8.9 (Good)
6.5 (Good)
7.1 (Good)
9.1 (Good)
9.9 (Good)
co
543 (Good)
736 (Good)
742 (Good)
846 (Good)
713 (Good)
769 (Good)
874 (Good)
937 (Good)
949 (Good)
1 (Good)
750 (Good)
546 (Good)
569 (Good)
428 (Good)
793 (Good)
921 (Good)
491 (Good)
475 (Good)
576 (Good)
692 (Good)
o3
70 (Moderate)
63 (Good)
62 (Good)
49 (Good)
43 (Good)
36 (Good)
42 (Good)
33 (Good)
24 (Good)
22 (Good)
33 (Good)
44 (Good)
51 (Good)
62 (Good)
42 (Good)
49 (Good)
31 (Good)
35 (Good)
- (Good)
- (Good)
data source »
Quality of life in Ajmer
Green and Parks in the City
Ajmer
42%
Nepal: 32%
Bangladesh: 33%
Bhutan: 82%
Sri Lanka: 59%
Pakistan: 49%
Pleasure of spending time in the city
Ajmer
38%
Nepal: 32%
Bangladesh: 26%
Bhutan: 61%
Sri Lanka: 52%
Pakistan: 43%
Air Pollution
Ajmer
50%
Nepal: 76%
Bangladesh: 78%
Bhutan: 45%
Sri Lanka: 53%
Pakistan: 64%
Garbage Disposal
Ajmer
42%
Nepal: 25%
Bangladesh: 22%
Bhutan: 47%
Sri Lanka: 41%
Pakistan: 34%
Availability and quality of drinking water
Ajmer
50%
Nepal: 36%
Bangladesh: 44%
Bhutan: 64%
Sri Lanka: 65%
Pakistan: 44%
Cleanliness and tidiness
Ajmer
33%
Nepal: 27%
Bangladesh: 23%
Bhutan: 57%
Sri Lanka: 52%
Pakistan: 40%
Noise and Light pollution
Ajmer
67%
Nepal: 55%
Bangladesh: 63%
Bhutan: 55%
Sri Lanka: 50%
Pakistan: 59%
Water Pollution
Ajmer
46%
Nepal: 76%
Bangladesh: 74%
Bhutan: 56%
Sri Lanka: 57%
Pakistan: 70%
Source: Numbeo
Civil Lines, Ajmer - RSPCB
Monday, October 31, 2022, 1:45 AM
PM10 103 (Unhealthy)
particulate matter (PM10) suspended dust
SO2 9.6 (Good)
sulfur dioxide (SO2)
PM2,5 64 (Unhealthy)
particulate matter (PM2.5) dust
CO 670 (Good)
carbon monoxide (CO)
NO2 27 (Good)
nitrogen dioxide (NO2)
O3 4.7 (Good)
ozone (O3)
Civil Lines, Ajmer - RSPCB
index
2022-10-31
pm10
102
so2
11
pm25
54
co
635
no2
22
o3
5.8
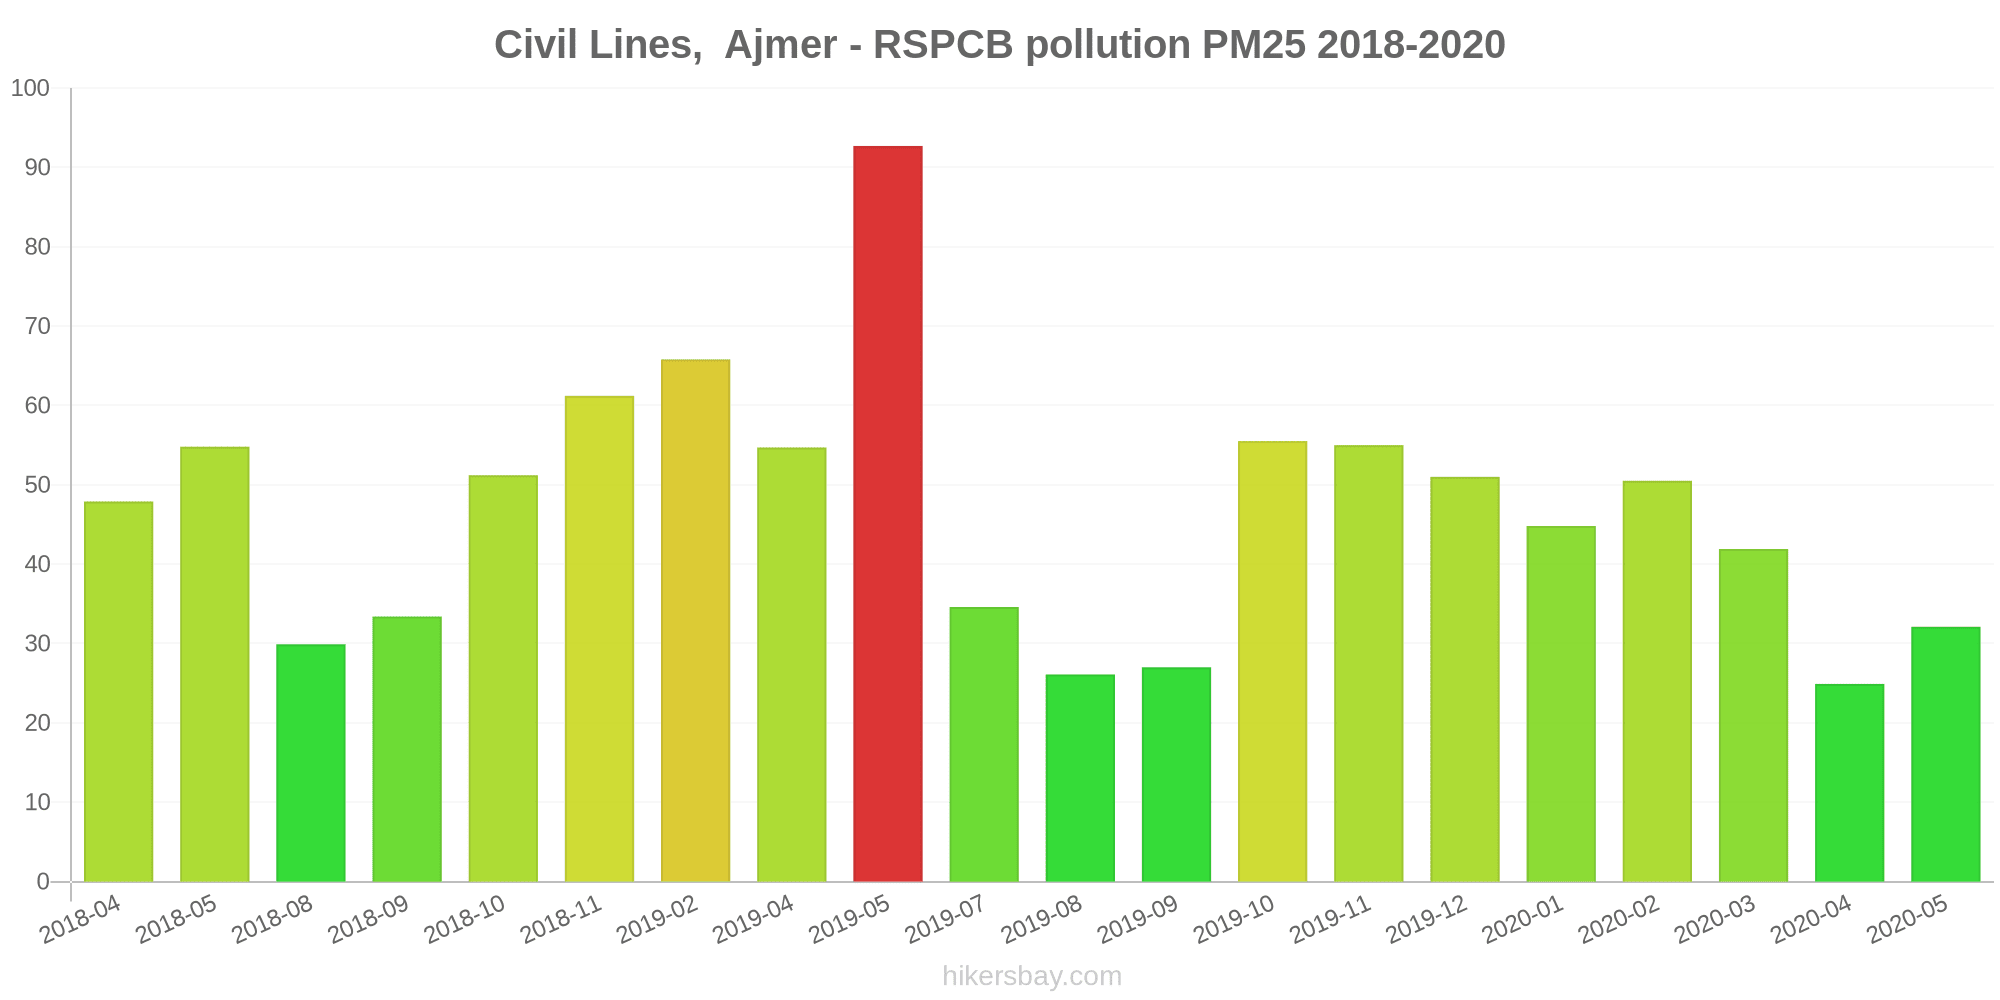
Civil Lines, Ajmer - RSPCB
2018-04 2020-05

index
2020-05
2020-04
2020-03
2020-02
2020-01
2019-12
2019-11
2019-10
2019-09
2019-08
2019-07
2019-05
2019-04
2019-02
2018-11
2018-10
2018-09
2018-08
2018-05
2018-04
pm25
32
25
42
51
45
51
55
56
27
26
35
93
55
66
61
51
33
30
55
48
pm10
66
59
89
110
88
105
108
95
57
56
76
183
132
107
130
110
67
65
89
100
no2
16
9.8
16
34
28
33
30
32
16
17
16
20
27
34
48
32
22
18
21
24
so2
11
7.2
6.8
8.2
6.1
6.7
5.5
7.3
6.4
5.5
7.9
5.6
7.8
6.6
8.5
8.9
6.5
7.1
9.1
9.9
co
543
736
742
846
713
769
874
937
949
1
750
546
569
428
793
921
491
475
576
692
o3
70
63
62
49
43
36
42
33
24
22
33
44
51
62
42
49
31
35
-
-
* Pollution data source:
https://openaq.org
(caaqm)
The data is licensed under CC-By 4.0
PM10 103 (Unhealthy)
SO2 10 (Good)
PM2,5 64 (Unhealthy)
CO 670 (Good)
NO2 27 (Good)
O3 5 (Good)
Data on air pollution from recent days in Ajmer
| index | 2022-10-31 |
|---|---|
| pm10 | 102 Unhealthy |
| so2 | 11 Good |
| pm25 | 54 Unhealthy for Sensitive Groups |
| co | 635 Good |
| no2 | 22 Good |
| o3 | 6 Good |
| index | 2020-05 | 2020-04 | 2020-03 | 2020-02 | 2020-01 | 2019-12 | 2019-11 | 2019-10 | 2019-09 | 2019-08 | 2019-07 | 2019-05 | 2019-04 | 2019-02 | 2018-11 | 2018-10 | 2018-09 | 2018-08 | 2018-05 | 2018-04 |
|---|---|---|---|---|---|---|---|---|---|---|---|---|---|---|---|---|---|---|---|---|
| pm25 | 32 (Moderate) | 25 (Moderate) | 42 (Unhealthy for Sensitive Groups) | 51 (Unhealthy for Sensitive Groups) | 45 (Unhealthy for Sensitive Groups) | 51 (Unhealthy for Sensitive Groups) | 55 (Unhealthy) | 56 (Unhealthy) | 27 (Moderate) | 26 (Moderate) | 35 (Moderate) | 93 (Very Unhealthy) | 55 (Unhealthy for Sensitive Groups) | 66 (Unhealthy) | 61 (Unhealthy) | 51 (Unhealthy for Sensitive Groups) | 33 (Moderate) | 30 (Moderate) | 55 (Unhealthy for Sensitive Groups) | 48 (Unhealthy for Sensitive Groups) |
| pm10 | 66 (Unhealthy for Sensitive Groups) | 59 (Unhealthy for Sensitive Groups) | 89 (Unhealthy) | 110 (Very Unhealthy) | 88 (Unhealthy) | 105 (Unhealthy) | 108 (Unhealthy) | 95 (Unhealthy) | 57 (Unhealthy for Sensitive Groups) | 56 (Unhealthy for Sensitive Groups) | 76 (Unhealthy for Sensitive Groups) | 183 (Very bad Hazardous) | 132 (Very Unhealthy) | 107 (Unhealthy) | 130 (Very Unhealthy) | 110 (Very Unhealthy) | 67 (Unhealthy for Sensitive Groups) | 65 (Unhealthy for Sensitive Groups) | 89 (Unhealthy) | 100 (Unhealthy) |
| no2 | 16 (Good) | 9.8 (Good) | 16 (Good) | 34 (Good) | 28 (Good) | 33 (Good) | 30 (Good) | 32 (Good) | 16 (Good) | 17 (Good) | 16 (Good) | 20 (Good) | 27 (Good) | 34 (Good) | 48 (Moderate) | 32 (Good) | 22 (Good) | 18 (Good) | 21 (Good) | 24 (Good) |
| so2 | 11 (Good) | 7.2 (Good) | 6.8 (Good) | 8.2 (Good) | 6.1 (Good) | 6.7 (Good) | 5.5 (Good) | 7.3 (Good) | 6.4 (Good) | 5.5 (Good) | 7.9 (Good) | 5.6 (Good) | 7.8 (Good) | 6.6 (Good) | 8.5 (Good) | 8.9 (Good) | 6.5 (Good) | 7.1 (Good) | 9.1 (Good) | 9.9 (Good) |
| co | 543 (Good) | 736 (Good) | 742 (Good) | 846 (Good) | 713 (Good) | 769 (Good) | 874 (Good) | 937 (Good) | 949 (Good) | 1 (Good) | 750 (Good) | 546 (Good) | 569 (Good) | 428 (Good) | 793 (Good) | 921 (Good) | 491 (Good) | 475 (Good) | 576 (Good) | 692 (Good) |
| o3 | 70 (Moderate) | 63 (Good) | 62 (Good) | 49 (Good) | 43 (Good) | 36 (Good) | 42 (Good) | 33 (Good) | 24 (Good) | 22 (Good) | 33 (Good) | 44 (Good) | 51 (Good) | 62 (Good) | 42 (Good) | 49 (Good) | 31 (Good) | 35 (Good) | - (Good) | - (Good) |
Green and Parks in the City
Ajmer 42%
Nepal: 32% Bangladesh: 33% Bhutan: 82% Sri Lanka: 59% Pakistan: 49%Pleasure of spending time in the city
Ajmer 38%
Nepal: 32% Bangladesh: 26% Bhutan: 61% Sri Lanka: 52% Pakistan: 43%Air Pollution
Ajmer 50%
Nepal: 76% Bangladesh: 78% Bhutan: 45% Sri Lanka: 53% Pakistan: 64%Garbage Disposal
Ajmer 42%
Nepal: 25% Bangladesh: 22% Bhutan: 47% Sri Lanka: 41% Pakistan: 34%Availability and quality of drinking water
Ajmer 50%
Nepal: 36% Bangladesh: 44% Bhutan: 64% Sri Lanka: 65% Pakistan: 44%Cleanliness and tidiness
Ajmer 33%
Nepal: 27% Bangladesh: 23% Bhutan: 57% Sri Lanka: 52% Pakistan: 40%Noise and Light pollution
Ajmer 67%
Nepal: 55% Bangladesh: 63% Bhutan: 55% Sri Lanka: 50% Pakistan: 59%Water Pollution
Ajmer 46%
Nepal: 76% Bangladesh: 74% Bhutan: 56% Sri Lanka: 57% Pakistan: 70%PM10 103 (Unhealthy)
particulate matter (PM10) suspended dustSO2 9.6 (Good)
sulfur dioxide (SO2)PM2,5 64 (Unhealthy)
particulate matter (PM2.5) dustCO 670 (Good)
carbon monoxide (CO)NO2 27 (Good)
nitrogen dioxide (NO2)O3 4.7 (Good)
ozone (O3)Civil Lines, Ajmer - RSPCB
| index | 2022-10-31 |
|---|---|
| pm10 | 102 |
| so2 | 11 |
| pm25 | 54 |
| co | 635 |
| no2 | 22 |
| o3 | 5.8 |
Civil Lines, Ajmer - RSPCB
| index | 2020-05 | 2020-04 | 2020-03 | 2020-02 | 2020-01 | 2019-12 | 2019-11 | 2019-10 | 2019-09 | 2019-08 | 2019-07 | 2019-05 | 2019-04 | 2019-02 | 2018-11 | 2018-10 | 2018-09 | 2018-08 | 2018-05 | 2018-04 |
|---|---|---|---|---|---|---|---|---|---|---|---|---|---|---|---|---|---|---|---|---|
| pm25 | 32 | 25 | 42 | 51 | 45 | 51 | 55 | 56 | 27 | 26 | 35 | 93 | 55 | 66 | 61 | 51 | 33 | 30 | 55 | 48 |
| pm10 | 66 | 59 | 89 | 110 | 88 | 105 | 108 | 95 | 57 | 56 | 76 | 183 | 132 | 107 | 130 | 110 | 67 | 65 | 89 | 100 |
| no2 | 16 | 9.8 | 16 | 34 | 28 | 33 | 30 | 32 | 16 | 17 | 16 | 20 | 27 | 34 | 48 | 32 | 22 | 18 | 21 | 24 |
| so2 | 11 | 7.2 | 6.8 | 8.2 | 6.1 | 6.7 | 5.5 | 7.3 | 6.4 | 5.5 | 7.9 | 5.6 | 7.8 | 6.6 | 8.5 | 8.9 | 6.5 | 7.1 | 9.1 | 9.9 |
| co | 543 | 736 | 742 | 846 | 713 | 769 | 874 | 937 | 949 | 1 | 750 | 546 | 569 | 428 | 793 | 921 | 491 | 475 | 576 | 692 |
| o3 | 70 | 63 | 62 | 49 | 43 | 36 | 42 | 33 | 24 | 22 | 33 | 44 | 51 | 62 | 42 | 49 | 31 | 35 | - | - |