Air Pollution in Alwar: Real-time Air Quality Index and smog alert.
Pollution and air quality forecast for Alwar. Today is Wednesday, May 13, 2026. The following air pollution values have been recorded for Alwar:- particulate matter (PM10) suspended dust - 188 (Very bad Hazardous)
- sulfur dioxide (SO2) - 10 (Good)
- particulate matter (PM2.5) dust - 88 (Very Unhealthy)
- carbon monoxide (CO) - 1100 (Good)
- nitrogen dioxide (NO2) - 33 (Good)
- ozone (O3) - 6 (Good)

What is the air quality in Alwar today? Is the air polluted in Alwar?. Is there smog?
What is the level of PM10 today in Alwar? (particulate matter (PM10) suspended dust)
The current level of particulate matter PM10 in Alwar is:
188 (Very bad Hazardous)
The highest PM10 values usually occur in month: 205 (November 2019).
The lowest value of particulate matter PM10 pollution in Alwar is usually recorded in: April (71).
What is the level of SO2 pollution? (sulfur dioxide (SO2))
10 (Good)
What is the current level of PM2.5 in Alwar? (particulate matter (PM2.5) dust)
Today's PM2.5 level is:
88 (Very Unhealthy)
For comparison, the highest level of PM2.5 in Alwar in the last 7 days was: 83 (Monday, October 31, 2022) and the lowest: 83 (Monday, October 31, 2022).
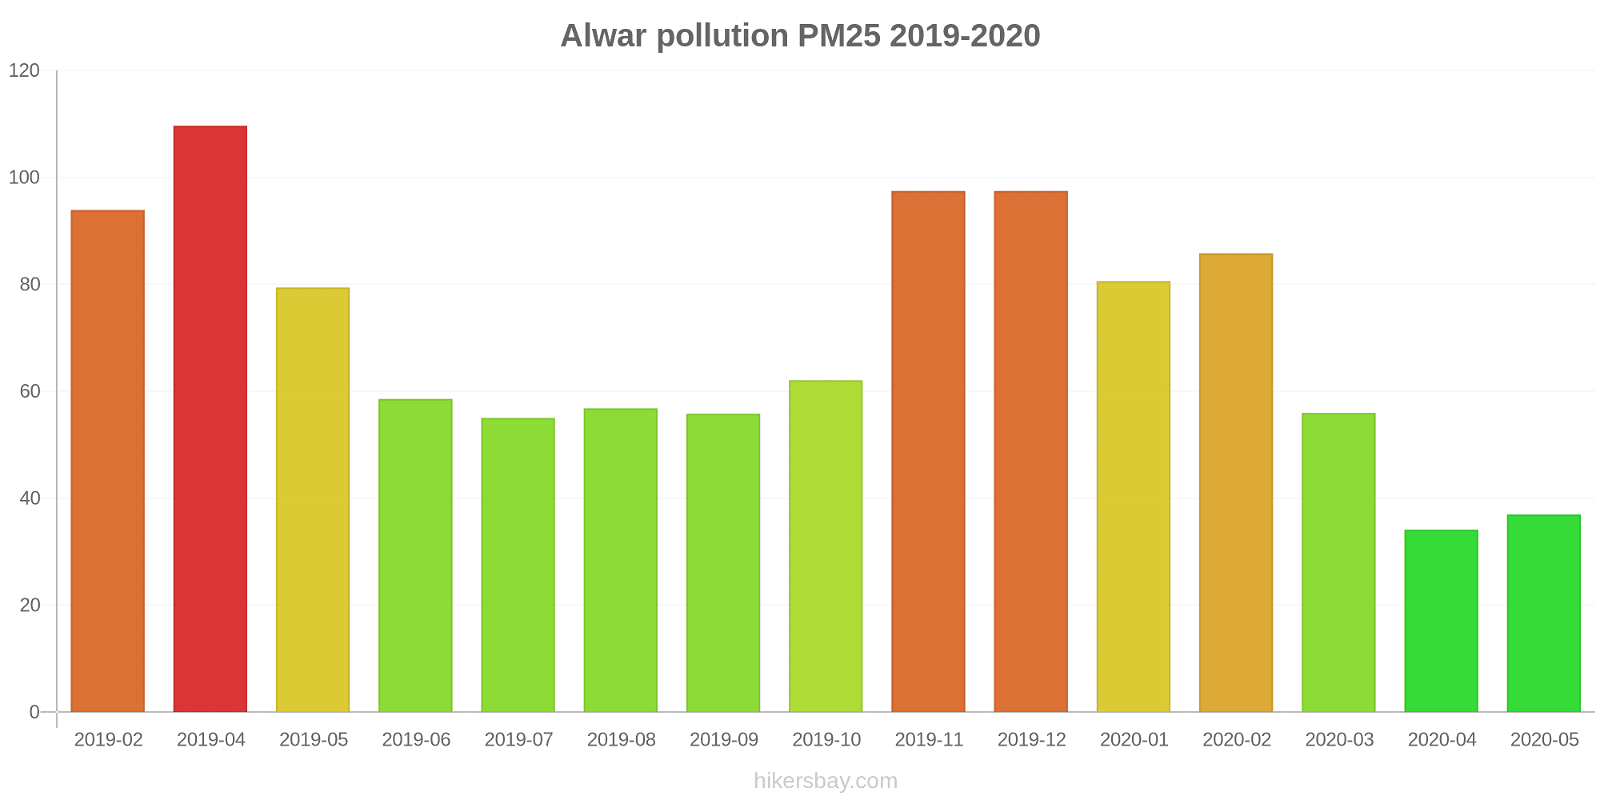
The highest PM2.5 values were recorded: 110 (April 2019).
The lowest level of particulate matter PM2.5 pollution occurs in month: April (34).
How high is the CO level? (carbon monoxide (CO))
1100 (Good)
How high is the level of NO2? (nitrogen dioxide (NO2))
33 (Good)
How is the O3 level today in Alwar? (ozone (O3))
6 (Good)
Current data Monday, October 31, 2022, 2:00 AM
PM10 188 (Very bad Hazardous)
SO2 10 (Good)
PM2,5 88 (Very Unhealthy)
CO 1100 (Good)
NO2 33 (Good)
O3 6 (Good)
Data on air pollution from recent days in Alwar
index
2022-10-31
pm10
172
Very bad Hazardous
so2
9
Good
pm25
83
Very Unhealthy
co
1063
Good
no2
30
Good
o3
9
Good
data source »
Air pollution in Alwar from February 2019 to May 2020
index
2020-05
2020-04
2020-03
2020-02
2020-01
2019-12
2019-11
2019-10
2019-09
2019-08
2019-07
2019-06
2019-05
2019-04
2019-02
pm25
37 (Unhealthy for Sensitive Groups)
34 (Moderate)
56 (Unhealthy)
86 (Very Unhealthy)
81 (Very Unhealthy)
97 (Very Unhealthy)
97 (Very Unhealthy)
62 (Unhealthy)
56 (Unhealthy)
57 (Unhealthy)
55 (Unhealthy)
59 (Unhealthy)
79 (Very Unhealthy)
110 (Very Unhealthy)
94 (Very Unhealthy)
pm10
82 (Unhealthy)
71 (Unhealthy for Sensitive Groups)
106 (Unhealthy)
152 (Very bad Hazardous)
155 (Very bad Hazardous)
182 (Very bad Hazardous)
205 (Very bad Hazardous)
153 (Very bad Hazardous)
97 (Unhealthy)
109 (Unhealthy)
122 (Very Unhealthy)
132 (Very Unhealthy)
183 (Very bad Hazardous)
185 (Very bad Hazardous)
154 (Very bad Hazardous)
no2
26 (Good)
23 (Good)
43 (Moderate)
48 (Moderate)
34 (Good)
30 (Good)
44 (Moderate)
44 (Moderate)
32 (Good)
20 (Good)
20 (Good)
26 (Good)
36 (Good)
27 (Good)
51 (Moderate)
so2
11 (Good)
11 (Good)
28 (Good)
31 (Good)
28 (Good)
21 (Good)
24 (Good)
23 (Good)
12 (Good)
11 (Good)
12 (Good)
17 (Good)
25 (Good)
49 (Good)
33 (Good)
co
629 (Good)
552 (Good)
636 (Good)
725 (Good)
224 (Good)
1 (Good)
1 (Good)
927 (Good)
631 (Good)
669 (Good)
693 (Good)
652 (Good)
774 (Good)
776 (Good)
350 (Good)
o3
40 (Good)
38 (Good)
30 (Good)
34 (Good)
29 (Good)
29 (Good)
36 (Good)
32 (Good)
34 (Good)
32 (Good)
36 (Good)
42 (Good)
46 (Good)
50 (Good)
30 (Good)
data source »
Quality of life in Alwar
Green and Parks in the City
Alwar
53%
Nepal: 32%
Bangladesh: 33%
Bhutan: 82%
Sri Lanka: 59%
Pakistan: 49%
Pleasure of spending time in the city
Alwar
38%
Nepal: 32%
Bangladesh: 26%
Bhutan: 61%
Sri Lanka: 52%
Pakistan: 43%
Air Pollution
Alwar
72%
Nepal: 76%
Bangladesh: 78%
Bhutan: 45%
Sri Lanka: 53%
Pakistan: 64%
Garbage Disposal
Alwar
19%
Nepal: 25%
Bangladesh: 22%
Bhutan: 47%
Sri Lanka: 41%
Pakistan: 34%
Availability and quality of drinking water
Alwar
46%
Nepal: 36%
Bangladesh: 44%
Bhutan: 64%
Sri Lanka: 65%
Pakistan: 44%
Cleanliness and tidiness
Alwar
26%
Nepal: 27%
Bangladesh: 23%
Bhutan: 57%
Sri Lanka: 52%
Pakistan: 40%
Noise and Light pollution
Alwar
46%
Nepal: 55%
Bangladesh: 63%
Bhutan: 55%
Sri Lanka: 50%
Pakistan: 59%
Water Pollution
Alwar
56%
Nepal: 76%
Bangladesh: 74%
Bhutan: 56%
Sri Lanka: 57%
Pakistan: 70%
particulate matter PM2.5
Alwar
81 (Very Unhealthy)
particulate matter PM10
Alwar
150 (Very bad Hazardous)
Source: Numbeo
Moti Doongri, Alwar, Rajasthan - RSPCB
Monday, October 31, 2022, 2:00 AM
PM10 134 (Very Unhealthy)
particulate matter (PM10) suspended dust
SO2 19 (Good)
sulfur dioxide (SO2)
PM2,5 77 (Very Unhealthy)
particulate matter (PM2.5) dust
CO 100 (Good)
carbon monoxide (CO)
NO2 32 (Good)
nitrogen dioxide (NO2)
O3 3.3 (Good)
ozone (O3)
RIICO Ind. Area III, Bhiwadi, Rajasthan - RSPCB
Monday, October 31, 2022, 2:00 AM
PM10 242 (Very bad Hazardous)
particulate matter (PM10) suspended dust
SO2 0.53 (Good)
sulfur dioxide (SO2)
PM2,5 99 (Very Unhealthy)
particulate matter (PM2.5) dust
CO 2100 (Moderate)
carbon monoxide (CO)
NO2 34 (Good)
nitrogen dioxide (NO2)
O3 8.2 (Good)
ozone (O3)
Moti Doongri, Alwar, Rajasthan - RSPCB
index
2022-10-31
pm10
106
so2
13
pm25
65
co
165
no2
24
o3
7.7
RIICO Ind. Area III, Bhiwadi, Rajasthan - RSPCB
index
2022-10-31
pm10
237
so2
4.9
pm25
101
co
1960
no2
37
o3
10
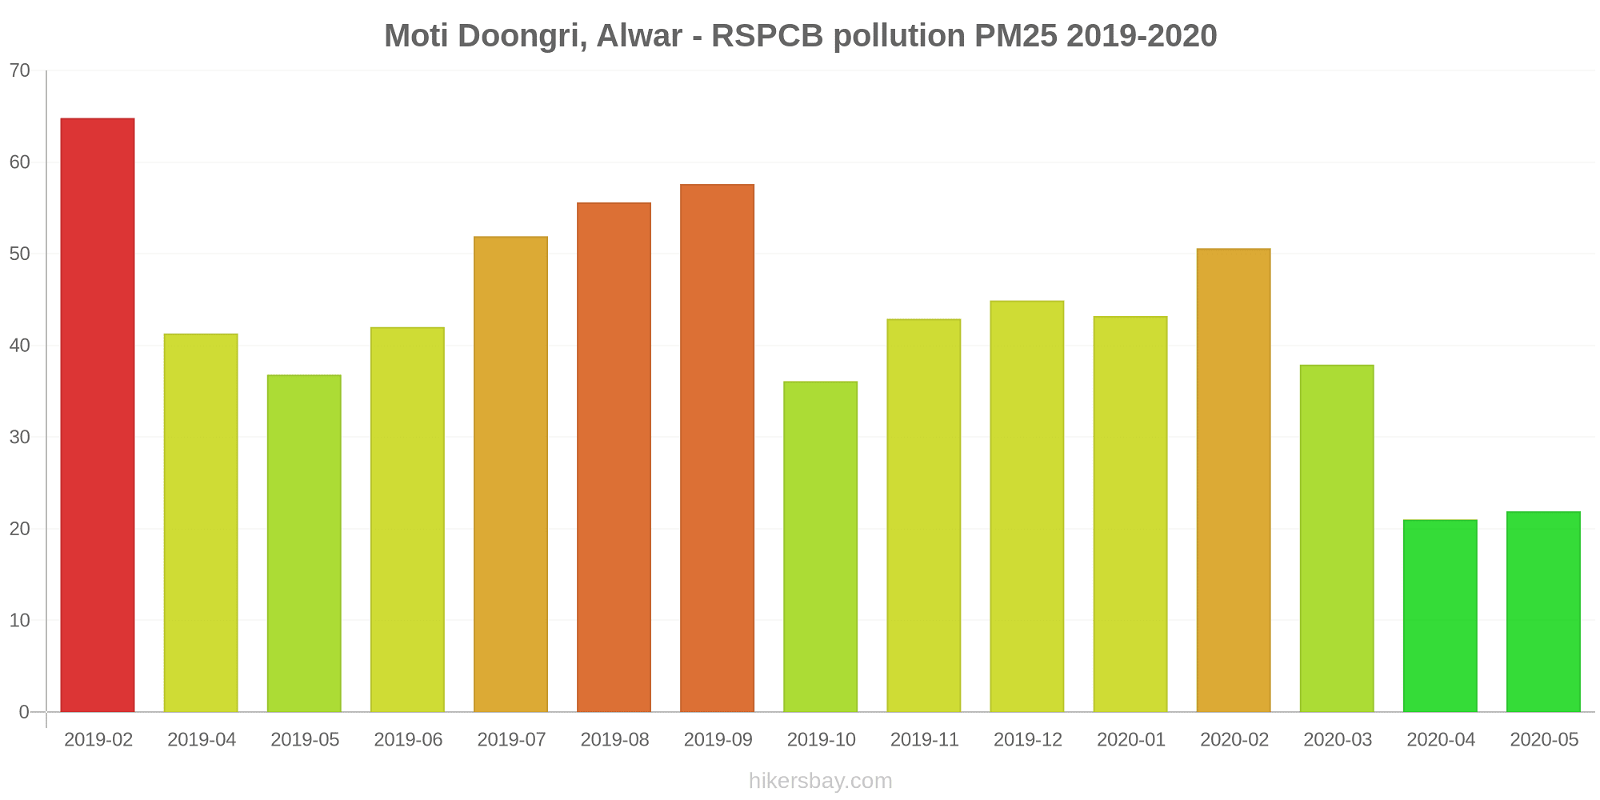
Moti Doongri, Alwar - RSPCB
2019-02 2020-05
index
2020-05
2020-04
2020-03
2020-02
2020-01
2019-12
2019-11
2019-10
2019-09
2019-08
2019-07
2019-06
2019-05
2019-04
2019-02
pm25
22
21
38
51
43
45
43
36
58
56
52
42
37
41
65
pm10
53
42
76
86
81
88
76
74
76
91
97
90
103
100
69
no2
26
26
32
43
21
16
19
19
19
20
16
27
33
31
57
so2
11
14
22
20
15
16
17
13
17
13
12
14
18
16
16
co
600
591
658
577
447
1
1
902
709
690
744
662
572
616
699
o3
41
37
35
37
34
33
43
35
37
38
40
45
63
61
36
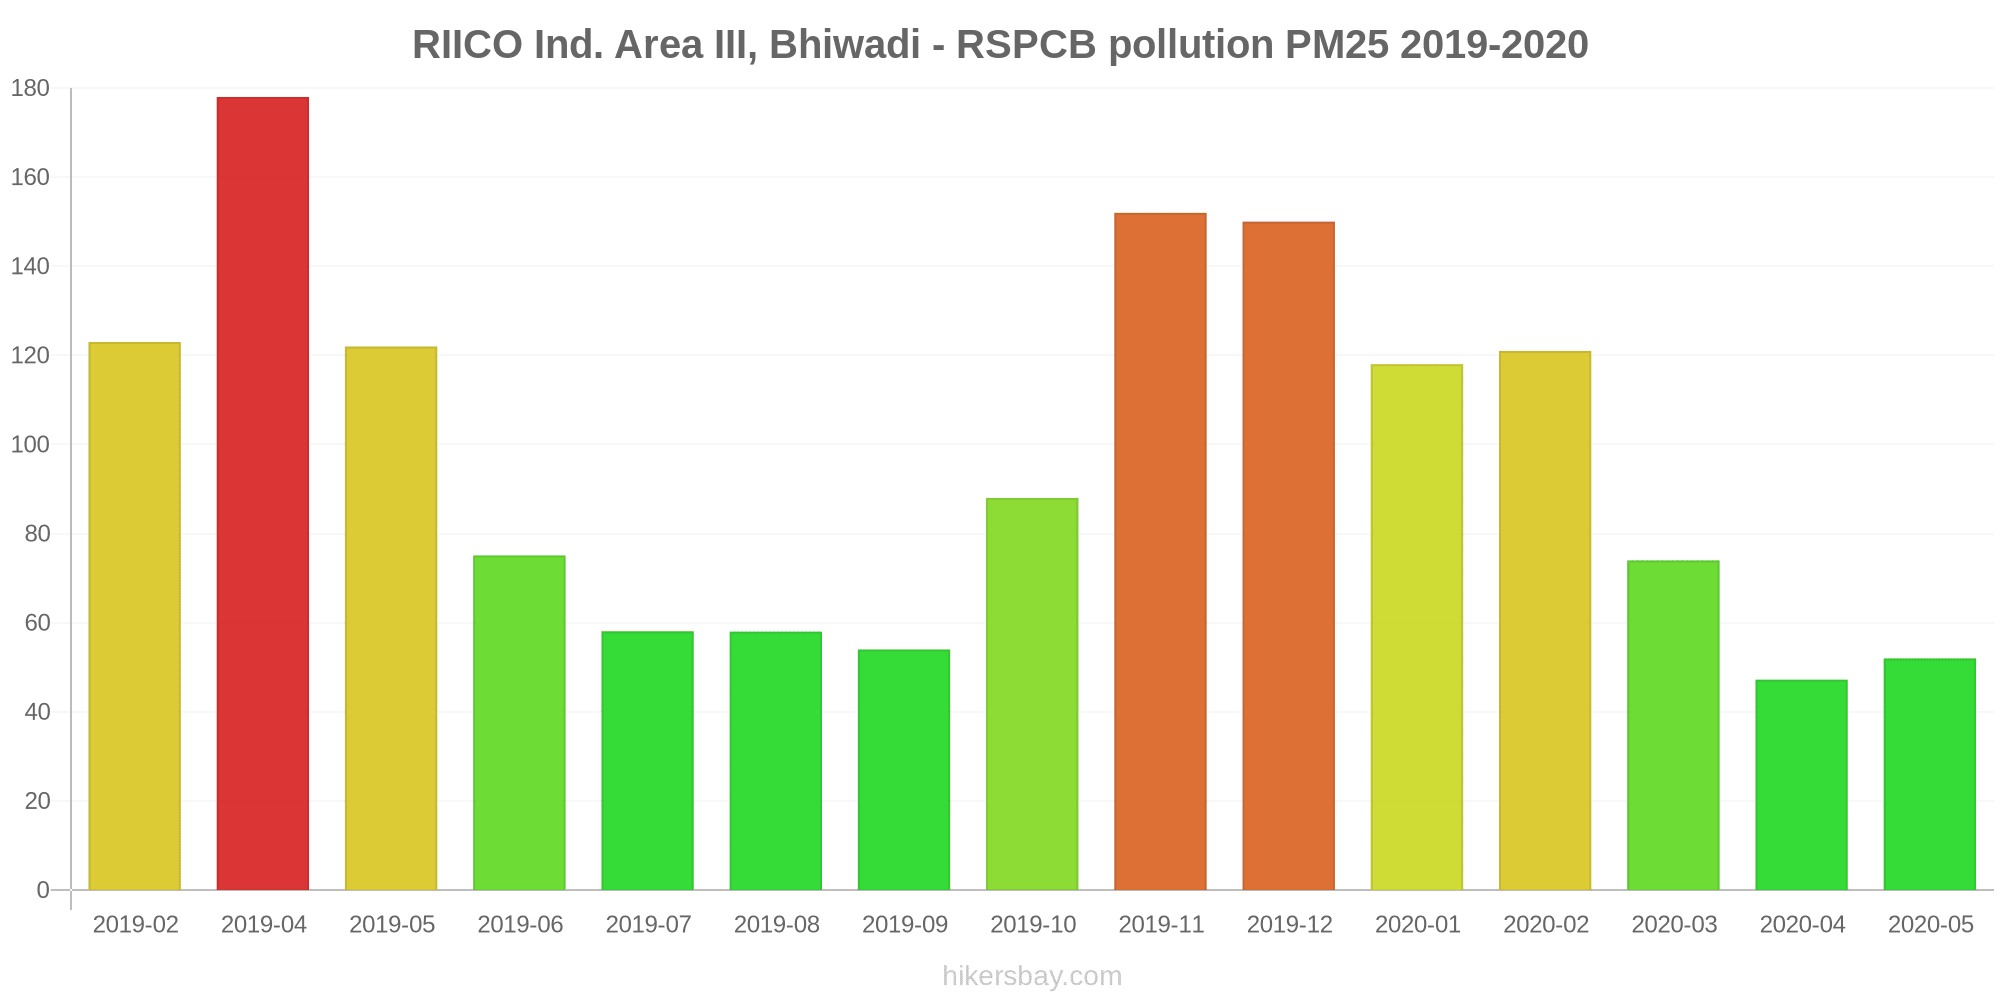
RIICO Ind. Area III, Bhiwadi - RSPCB
2019-02 2020-05

index
2020-05
2020-04
2020-03
2020-02
2020-01
2019-12
2019-11
2019-10
2019-09
2019-08
2019-07
2019-06
2019-05
2019-04
2019-02
pm25
52
47
74
121
118
150
152
88
54
58
58
75
122
178
123
pm10
111
99
135
218
229
275
334
231
118
128
147
174
262
270
239
no2
26
19
54
54
48
44
69
69
45
20
23
25
39
23
46
so2
12
8.3
35
42
40
27
30
32
7
9.6
12
21
32
82
49
co
658
512
614
873
1
1
1
951
552
647
642
642
975
936
1
o3
40
38
25
31
24
26
29
28
31
26
33
39
29
40
24
* Pollution data source:
https://openaq.org
(caaqm)
The data is licensed under CC-By 4.0
PM10 188 (Very bad Hazardous)
SO2 10 (Good)
PM2,5 88 (Very Unhealthy)
CO 1100 (Good)
NO2 33 (Good)
O3 6 (Good)
Data on air pollution from recent days in Alwar
| index | 2022-10-31 |
|---|---|
| pm10 | 172 Very bad Hazardous |
| so2 | 9 Good |
| pm25 | 83 Very Unhealthy |
| co | 1063 Good |
| no2 | 30 Good |
| o3 | 9 Good |

| index | 2020-05 | 2020-04 | 2020-03 | 2020-02 | 2020-01 | 2019-12 | 2019-11 | 2019-10 | 2019-09 | 2019-08 | 2019-07 | 2019-06 | 2019-05 | 2019-04 | 2019-02 |
|---|---|---|---|---|---|---|---|---|---|---|---|---|---|---|---|
| pm25 | 37 (Unhealthy for Sensitive Groups) | 34 (Moderate) | 56 (Unhealthy) | 86 (Very Unhealthy) | 81 (Very Unhealthy) | 97 (Very Unhealthy) | 97 (Very Unhealthy) | 62 (Unhealthy) | 56 (Unhealthy) | 57 (Unhealthy) | 55 (Unhealthy) | 59 (Unhealthy) | 79 (Very Unhealthy) | 110 (Very Unhealthy) | 94 (Very Unhealthy) |
| pm10 | 82 (Unhealthy) | 71 (Unhealthy for Sensitive Groups) | 106 (Unhealthy) | 152 (Very bad Hazardous) | 155 (Very bad Hazardous) | 182 (Very bad Hazardous) | 205 (Very bad Hazardous) | 153 (Very bad Hazardous) | 97 (Unhealthy) | 109 (Unhealthy) | 122 (Very Unhealthy) | 132 (Very Unhealthy) | 183 (Very bad Hazardous) | 185 (Very bad Hazardous) | 154 (Very bad Hazardous) |
| no2 | 26 (Good) | 23 (Good) | 43 (Moderate) | 48 (Moderate) | 34 (Good) | 30 (Good) | 44 (Moderate) | 44 (Moderate) | 32 (Good) | 20 (Good) | 20 (Good) | 26 (Good) | 36 (Good) | 27 (Good) | 51 (Moderate) |
| so2 | 11 (Good) | 11 (Good) | 28 (Good) | 31 (Good) | 28 (Good) | 21 (Good) | 24 (Good) | 23 (Good) | 12 (Good) | 11 (Good) | 12 (Good) | 17 (Good) | 25 (Good) | 49 (Good) | 33 (Good) |
| co | 629 (Good) | 552 (Good) | 636 (Good) | 725 (Good) | 224 (Good) | 1 (Good) | 1 (Good) | 927 (Good) | 631 (Good) | 669 (Good) | 693 (Good) | 652 (Good) | 774 (Good) | 776 (Good) | 350 (Good) |
| o3 | 40 (Good) | 38 (Good) | 30 (Good) | 34 (Good) | 29 (Good) | 29 (Good) | 36 (Good) | 32 (Good) | 34 (Good) | 32 (Good) | 36 (Good) | 42 (Good) | 46 (Good) | 50 (Good) | 30 (Good) |
Green and Parks in the City
Alwar 53%
Nepal: 32% Bangladesh: 33% Bhutan: 82% Sri Lanka: 59% Pakistan: 49%Pleasure of spending time in the city
Alwar 38%
Nepal: 32% Bangladesh: 26% Bhutan: 61% Sri Lanka: 52% Pakistan: 43%Air Pollution
Alwar 72%
Nepal: 76% Bangladesh: 78% Bhutan: 45% Sri Lanka: 53% Pakistan: 64%Garbage Disposal
Alwar 19%
Nepal: 25% Bangladesh: 22% Bhutan: 47% Sri Lanka: 41% Pakistan: 34%Availability and quality of drinking water
Alwar 46%
Nepal: 36% Bangladesh: 44% Bhutan: 64% Sri Lanka: 65% Pakistan: 44%Cleanliness and tidiness
Alwar 26%
Nepal: 27% Bangladesh: 23% Bhutan: 57% Sri Lanka: 52% Pakistan: 40%Noise and Light pollution
Alwar 46%
Nepal: 55% Bangladesh: 63% Bhutan: 55% Sri Lanka: 50% Pakistan: 59%Water Pollution
Alwar 56%
Nepal: 76% Bangladesh: 74% Bhutan: 56% Sri Lanka: 57% Pakistan: 70%particulate matter PM2.5
Alwar 81 (Very Unhealthy)
particulate matter PM10
Alwar 150 (Very bad Hazardous)
PM10 134 (Very Unhealthy)
particulate matter (PM10) suspended dustSO2 19 (Good)
sulfur dioxide (SO2)PM2,5 77 (Very Unhealthy)
particulate matter (PM2.5) dustCO 100 (Good)
carbon monoxide (CO)NO2 32 (Good)
nitrogen dioxide (NO2)O3 3.3 (Good)
ozone (O3)PM10 242 (Very bad Hazardous)
particulate matter (PM10) suspended dustSO2 0.53 (Good)
sulfur dioxide (SO2)PM2,5 99 (Very Unhealthy)
particulate matter (PM2.5) dustCO 2100 (Moderate)
carbon monoxide (CO)NO2 34 (Good)
nitrogen dioxide (NO2)O3 8.2 (Good)
ozone (O3)Moti Doongri, Alwar, Rajasthan - RSPCB
| index | 2022-10-31 |
|---|---|
| pm10 | 106 |
| so2 | 13 |
| pm25 | 65 |
| co | 165 |
| no2 | 24 |
| o3 | 7.7 |
RIICO Ind. Area III, Bhiwadi, Rajasthan - RSPCB
| index | 2022-10-31 |
|---|---|
| pm10 | 237 |
| so2 | 4.9 |
| pm25 | 101 |
| co | 1960 |
| no2 | 37 |
| o3 | 10 |
Moti Doongri, Alwar - RSPCB

| index | 2020-05 | 2020-04 | 2020-03 | 2020-02 | 2020-01 | 2019-12 | 2019-11 | 2019-10 | 2019-09 | 2019-08 | 2019-07 | 2019-06 | 2019-05 | 2019-04 | 2019-02 |
|---|---|---|---|---|---|---|---|---|---|---|---|---|---|---|---|
| pm25 | 22 | 21 | 38 | 51 | 43 | 45 | 43 | 36 | 58 | 56 | 52 | 42 | 37 | 41 | 65 |
| pm10 | 53 | 42 | 76 | 86 | 81 | 88 | 76 | 74 | 76 | 91 | 97 | 90 | 103 | 100 | 69 |
| no2 | 26 | 26 | 32 | 43 | 21 | 16 | 19 | 19 | 19 | 20 | 16 | 27 | 33 | 31 | 57 |
| so2 | 11 | 14 | 22 | 20 | 15 | 16 | 17 | 13 | 17 | 13 | 12 | 14 | 18 | 16 | 16 |
| co | 600 | 591 | 658 | 577 | 447 | 1 | 1 | 902 | 709 | 690 | 744 | 662 | 572 | 616 | 699 |
| o3 | 41 | 37 | 35 | 37 | 34 | 33 | 43 | 35 | 37 | 38 | 40 | 45 | 63 | 61 | 36 |
RIICO Ind. Area III, Bhiwadi - RSPCB
| index | 2020-05 | 2020-04 | 2020-03 | 2020-02 | 2020-01 | 2019-12 | 2019-11 | 2019-10 | 2019-09 | 2019-08 | 2019-07 | 2019-06 | 2019-05 | 2019-04 | 2019-02 |
|---|---|---|---|---|---|---|---|---|---|---|---|---|---|---|---|
| pm25 | 52 | 47 | 74 | 121 | 118 | 150 | 152 | 88 | 54 | 58 | 58 | 75 | 122 | 178 | 123 |
| pm10 | 111 | 99 | 135 | 218 | 229 | 275 | 334 | 231 | 118 | 128 | 147 | 174 | 262 | 270 | 239 |
| no2 | 26 | 19 | 54 | 54 | 48 | 44 | 69 | 69 | 45 | 20 | 23 | 25 | 39 | 23 | 46 |
| so2 | 12 | 8.3 | 35 | 42 | 40 | 27 | 30 | 32 | 7 | 9.6 | 12 | 21 | 32 | 82 | 49 |
| co | 658 | 512 | 614 | 873 | 1 | 1 | 1 | 951 | 552 | 647 | 642 | 642 | 975 | 936 | 1 |
| o3 | 40 | 38 | 25 | 31 | 24 | 26 | 29 | 28 | 31 | 26 | 33 | 39 | 29 | 40 | 24 |