Air Pollution in Ambala: Real-time Air Quality Index and smog alert.
Pollution and air quality forecast for Ambala. Today is Wednesday, May 13, 2026. The following air pollution values have been recorded for Ambala:- particulate matter (PM10) suspended dust - 126 (Very Unhealthy)
- sulfur dioxide (SO2) - 5 (Good)
- particulate matter (PM2.5) dust - 116 (Very bad Hazardous)
- carbon monoxide (CO) - 1230 (Good)
- nitrogen dioxide (NO2) - 3 (Good)
- ozone (O3) - 8 (Good)

What is the air quality in Ambala today? Is the air polluted in Ambala?. Is there smog?
What is the level of PM10 today in Ambala? (particulate matter (PM10) suspended dust)
The current level of particulate matter PM10 in Ambala is:
126 (Very Unhealthy)
The highest PM10 values usually occur in month: 199 (February 2019).
The lowest value of particulate matter PM10 pollution in Ambala is usually recorded in: April (58).
What is the level of SO2 pollution? (sulfur dioxide (SO2))
5 (Good)
What is the current level of PM2.5 in Ambala? (particulate matter (PM2.5) dust)
Today's PM2.5 level is:
116 (Very bad Hazardous)
For comparison, the highest level of PM2.5 in Ambala in the last 7 days was: 116 (Monday, October 31, 2022) and the lowest: 116 (Monday, October 31, 2022).
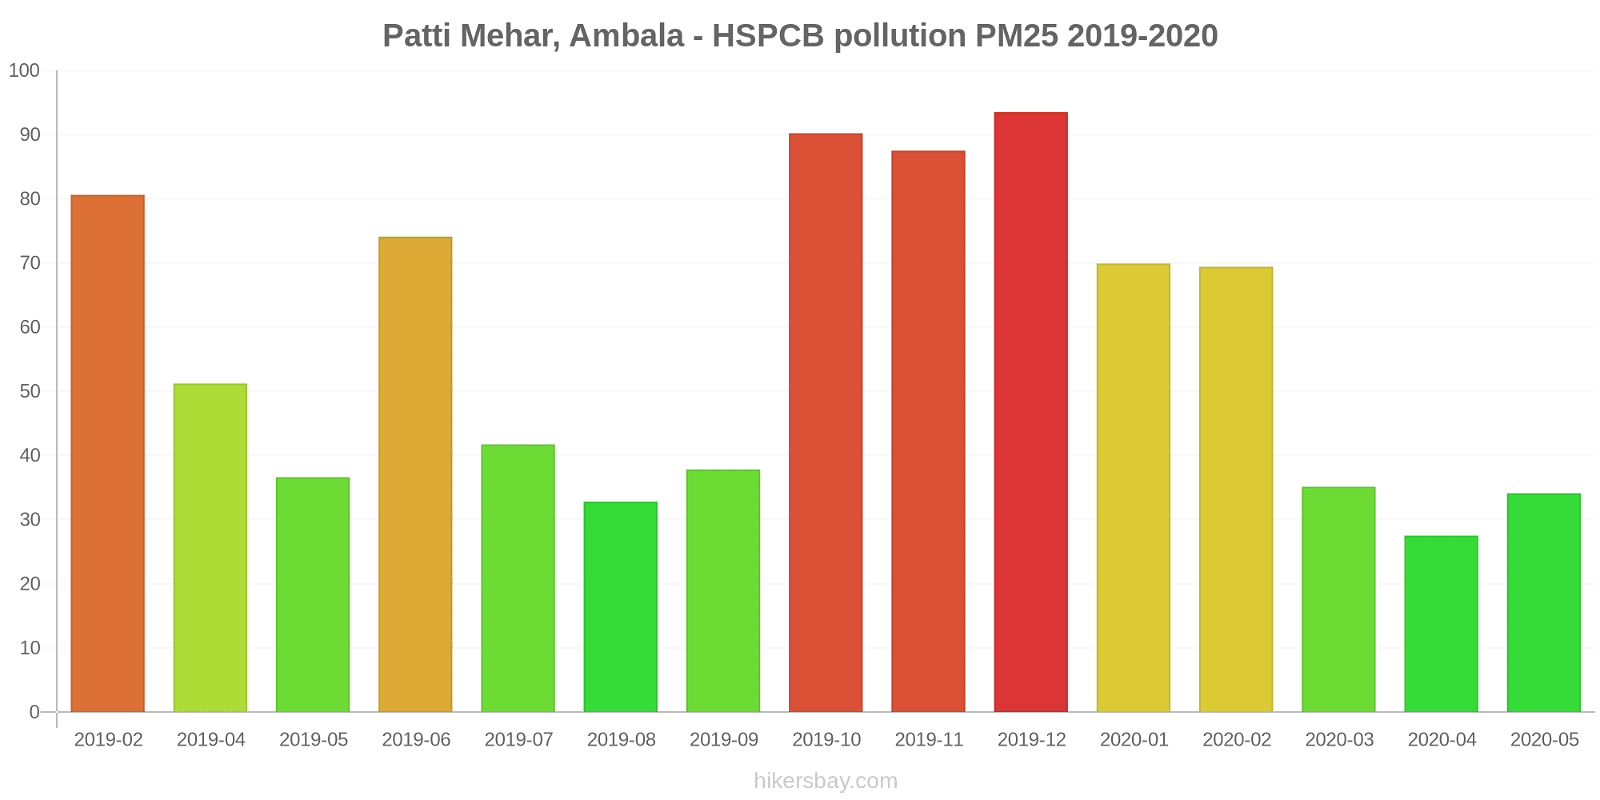
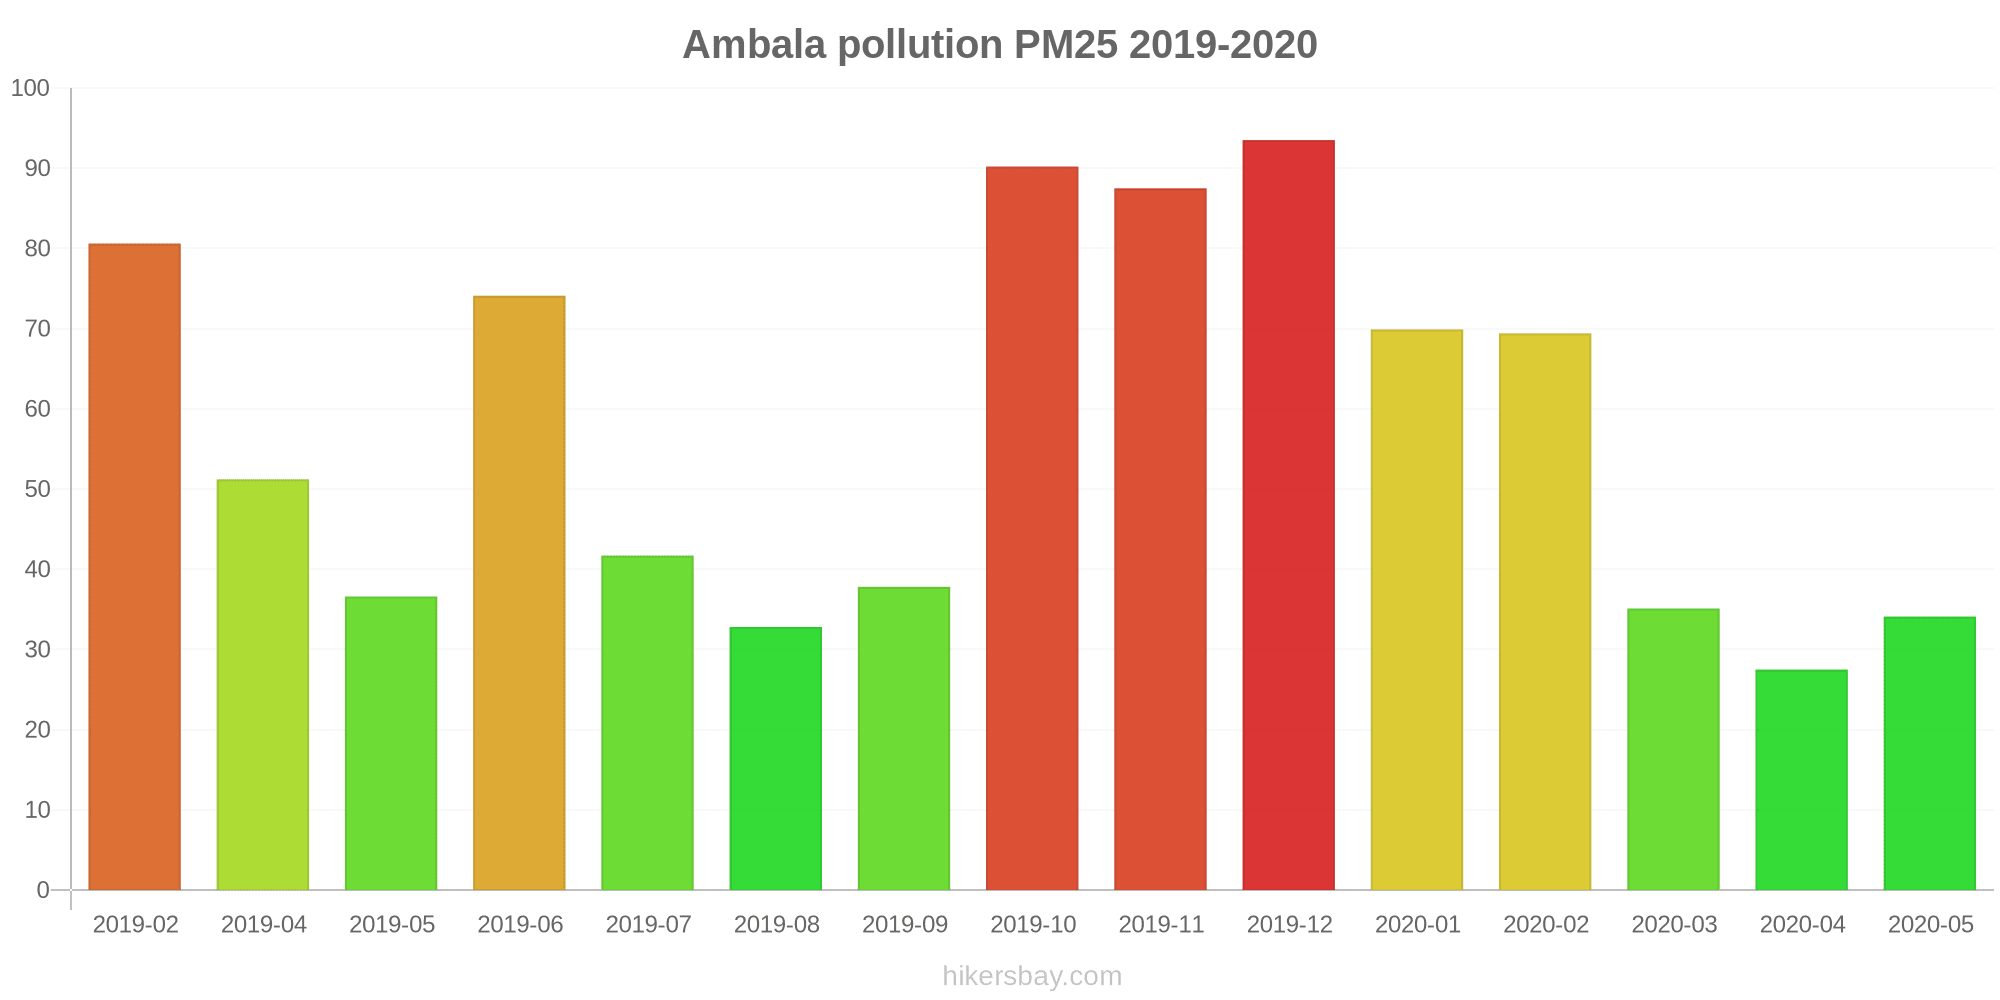
The highest PM2.5 values were recorded: 94 (December 2019).
The lowest level of particulate matter PM2.5 pollution occurs in month: April (28).
How high is the CO level? (carbon monoxide (CO))
1230 (Good)
How high is the level of NO2? (nitrogen dioxide (NO2))
3 (Good)
How is the O3 level today in Ambala? (ozone (O3))
8 (Good)
Current data Monday, October 31, 2022, 1:45 AM
PM10 126 (Very Unhealthy)
SO2 5 (Good)
PM2,5 116 (Very bad Hazardous)
CO 1230 (Good)
NO2 3 (Good)
O3 8 (Good)
Data on air pollution from recent days in Ambala
index
2022-10-31
pm10
129
Very Unhealthy
so2
6
Good
pm25
116
Very bad Hazardous
co
1215
Good
no2
5
Good
o3
9
Good
data source »
Air pollution in Ambala from February 2019 to May 2020

index
2020-05
2020-04
2020-03
2020-02
2020-01
2019-12
2019-11
2019-10
2019-09
2019-08
2019-07
2019-06
2019-05
2019-04
2019-02
pm25
34 (Moderate)
28 (Moderate)
35 (Unhealthy for Sensitive Groups)
69 (Unhealthy)
70 (Unhealthy)
94 (Very Unhealthy)
88 (Very Unhealthy)
90 (Very Unhealthy)
38 (Unhealthy for Sensitive Groups)
33 (Moderate)
42 (Unhealthy for Sensitive Groups)
74 (Unhealthy)
37 (Unhealthy for Sensitive Groups)
51 (Unhealthy for Sensitive Groups)
81 (Very Unhealthy)
no2
24 (Good)
17 (Good)
20 (Good)
32 (Good)
45 (Moderate)
38 (Good)
39 (Good)
41 (Moderate)
24 (Good)
22 (Good)
24 (Good)
29 (Good)
35 (Good)
39 (Good)
28 (Good)
so2
42 (Good)
24 (Good)
31 (Good)
49 (Good)
27 (Good)
16 (Good)
17 (Good)
18 (Good)
26 (Good)
24 (Good)
25 (Good)
19 (Good)
18 (Good)
22 (Good)
48 (Good)
co
403 (Good)
272 (Good)
310 (Good)
612 (Good)
767 (Good)
844 (Good)
812 (Good)
726 (Good)
427 (Good)
406 (Good)
394 (Good)
325 (Good)
259 (Good)
313 (Good)
820 (Good)
o3
42 (Good)
34 (Good)
29 (Good)
47 (Good)
68 (Good)
48 (Good)
29 (Good)
39 (Good)
26 (Good)
28 (Good)
42 (Good)
78 (Moderate)
77 (Moderate)
80 (Moderate)
56 (Good)
pm10
- (Good)
58 (Unhealthy for Sensitive Groups)
79 (Unhealthy for Sensitive Groups)
138 (Very Unhealthy)
131 (Very Unhealthy)
175 (Very bad Hazardous)
175 (Very bad Hazardous)
176 (Very bad Hazardous)
76 (Unhealthy for Sensitive Groups)
67 (Unhealthy for Sensitive Groups)
86 (Unhealthy)
133 (Very Unhealthy)
96 (Unhealthy)
184 (Very bad Hazardous)
199 (Very bad Hazardous)
data source »
Patti Mehar, Ambala - HSPCB
Monday, October 31, 2022, 1:45 AM
PM10 126 (Very Unhealthy)
particulate matter (PM10) suspended dust
SO2 4.7 (Good)
sulfur dioxide (SO2)
PM2,5 116 (Very bad Hazardous)
particulate matter (PM2.5) dust
CO 1230 (Good)
carbon monoxide (CO)
NO2 2.7 (Good)
nitrogen dioxide (NO2)
O3 7.9 (Good)
ozone (O3)
Patti Mehar, Ambala - HSPCB
index
2022-10-31
pm10
129
so2
6.3
pm25
116
co
1215
no2
4.7
o3
9.2
Patti Mehar, Ambala - HSPCB
2019-02 2020-05
index
2020-05
2020-04
2020-03
2020-02
2020-01
2019-12
2019-11
2019-10
2019-09
2019-08
2019-07
2019-06
2019-05
2019-04
2019-02
pm25
34
28
35
69
70
94
88
90
38
33
42
74
37
51
81
pm10
-
58
79
138
131
175
175
176
76
67
86
133
96
184
199
no2
24
17
20
32
45
38
39
41
24
22
24
29
35
39
28
so2
42
24
31
49
27
16
17
18
26
24
25
19
18
22
48
co
403
272
310
612
767
844
812
726
427
406
394
325
259
313
820
o3
42
34
29
47
68
48
29
39
26
28
42
78
77
80
56
* Pollution data source:
https://openaq.org
(caaqm)
The data is licensed under CC-By 4.0
PM10 126 (Very Unhealthy)
SO2 5 (Good)
PM2,5 116 (Very bad Hazardous)
CO 1230 (Good)
NO2 3 (Good)
O3 8 (Good)
Data on air pollution from recent days in Ambala
| index | 2022-10-31 |
|---|---|
| pm10 | 129 Very Unhealthy |
| so2 | 6 Good |
| pm25 | 116 Very bad Hazardous |
| co | 1215 Good |
| no2 | 5 Good |
| o3 | 9 Good |
| index | 2020-05 | 2020-04 | 2020-03 | 2020-02 | 2020-01 | 2019-12 | 2019-11 | 2019-10 | 2019-09 | 2019-08 | 2019-07 | 2019-06 | 2019-05 | 2019-04 | 2019-02 |
|---|---|---|---|---|---|---|---|---|---|---|---|---|---|---|---|
| pm25 | 34 (Moderate) | 28 (Moderate) | 35 (Unhealthy for Sensitive Groups) | 69 (Unhealthy) | 70 (Unhealthy) | 94 (Very Unhealthy) | 88 (Very Unhealthy) | 90 (Very Unhealthy) | 38 (Unhealthy for Sensitive Groups) | 33 (Moderate) | 42 (Unhealthy for Sensitive Groups) | 74 (Unhealthy) | 37 (Unhealthy for Sensitive Groups) | 51 (Unhealthy for Sensitive Groups) | 81 (Very Unhealthy) |
| no2 | 24 (Good) | 17 (Good) | 20 (Good) | 32 (Good) | 45 (Moderate) | 38 (Good) | 39 (Good) | 41 (Moderate) | 24 (Good) | 22 (Good) | 24 (Good) | 29 (Good) | 35 (Good) | 39 (Good) | 28 (Good) |
| so2 | 42 (Good) | 24 (Good) | 31 (Good) | 49 (Good) | 27 (Good) | 16 (Good) | 17 (Good) | 18 (Good) | 26 (Good) | 24 (Good) | 25 (Good) | 19 (Good) | 18 (Good) | 22 (Good) | 48 (Good) |
| co | 403 (Good) | 272 (Good) | 310 (Good) | 612 (Good) | 767 (Good) | 844 (Good) | 812 (Good) | 726 (Good) | 427 (Good) | 406 (Good) | 394 (Good) | 325 (Good) | 259 (Good) | 313 (Good) | 820 (Good) |
| o3 | 42 (Good) | 34 (Good) | 29 (Good) | 47 (Good) | 68 (Good) | 48 (Good) | 29 (Good) | 39 (Good) | 26 (Good) | 28 (Good) | 42 (Good) | 78 (Moderate) | 77 (Moderate) | 80 (Moderate) | 56 (Good) |
| pm10 | - (Good) | 58 (Unhealthy for Sensitive Groups) | 79 (Unhealthy for Sensitive Groups) | 138 (Very Unhealthy) | 131 (Very Unhealthy) | 175 (Very bad Hazardous) | 175 (Very bad Hazardous) | 176 (Very bad Hazardous) | 76 (Unhealthy for Sensitive Groups) | 67 (Unhealthy for Sensitive Groups) | 86 (Unhealthy) | 133 (Very Unhealthy) | 96 (Unhealthy) | 184 (Very bad Hazardous) | 199 (Very bad Hazardous) |
PM10 126 (Very Unhealthy)
particulate matter (PM10) suspended dustSO2 4.7 (Good)
sulfur dioxide (SO2)PM2,5 116 (Very bad Hazardous)
particulate matter (PM2.5) dustCO 1230 (Good)
carbon monoxide (CO)NO2 2.7 (Good)
nitrogen dioxide (NO2)O3 7.9 (Good)
ozone (O3)Patti Mehar, Ambala - HSPCB
| index | 2022-10-31 |
|---|---|
| pm10 | 129 |
| so2 | 6.3 |
| pm25 | 116 |
| co | 1215 |
| no2 | 4.7 |
| o3 | 9.2 |
Patti Mehar, Ambala - HSPCB

| index | 2020-05 | 2020-04 | 2020-03 | 2020-02 | 2020-01 | 2019-12 | 2019-11 | 2019-10 | 2019-09 | 2019-08 | 2019-07 | 2019-06 | 2019-05 | 2019-04 | 2019-02 |
|---|---|---|---|---|---|---|---|---|---|---|---|---|---|---|---|
| pm25 | 34 | 28 | 35 | 69 | 70 | 94 | 88 | 90 | 38 | 33 | 42 | 74 | 37 | 51 | 81 |
| pm10 | - | 58 | 79 | 138 | 131 | 175 | 175 | 176 | 76 | 67 | 86 | 133 | 96 | 184 | 199 |
| no2 | 24 | 17 | 20 | 32 | 45 | 38 | 39 | 41 | 24 | 22 | 24 | 29 | 35 | 39 | 28 |
| so2 | 42 | 24 | 31 | 49 | 27 | 16 | 17 | 18 | 26 | 24 | 25 | 19 | 18 | 22 | 48 |
| co | 403 | 272 | 310 | 612 | 767 | 844 | 812 | 726 | 427 | 406 | 394 | 325 | 259 | 313 | 820 |
| o3 | 42 | 34 | 29 | 47 | 68 | 48 | 29 | 39 | 26 | 28 | 42 | 78 | 77 | 80 | 56 |