Air Pollution in Assam: Real-time Air Quality Index and smog alert.
Pollution and air quality forecast for Assam. Today is Wednesday, May 13, 2026. The following air pollution values have been recorded for Assam:- sulfur dioxide (SO2) - 12 (Good)
- ozone (O3) - 165 (Unhealthy)
- carbon monoxide (CO) - 180 (Good)
- nitrogen dioxide (NO2) - 3 (Good)
- particulate matter (PM2.5) dust - 20 (Moderate)
- particulate matter (PM10) suspended dust - 30 (Moderate)

What is the air quality in Assam today? Is the air polluted in Assam?. Is there smog?
What is the level of SO2 pollution? (sulfur dioxide (SO2))
12 (Good)
How is the O3 level today in Assam? (ozone (O3))
165 (Unhealthy)
How high is the CO level? (carbon monoxide (CO))
180 (Good)
How high is the level of NO2? (nitrogen dioxide (NO2))
3 (Good)
What is the current level of PM2.5 in Assam? (particulate matter (PM2.5) dust)
Today's PM2.5 level is:
20 (Moderate)
For comparison, the highest level of PM2.5 in Assam in the last 7 days was: 27 (Thursday, July 28, 2022) and the lowest: 17 (Monday, August 1, 2022).
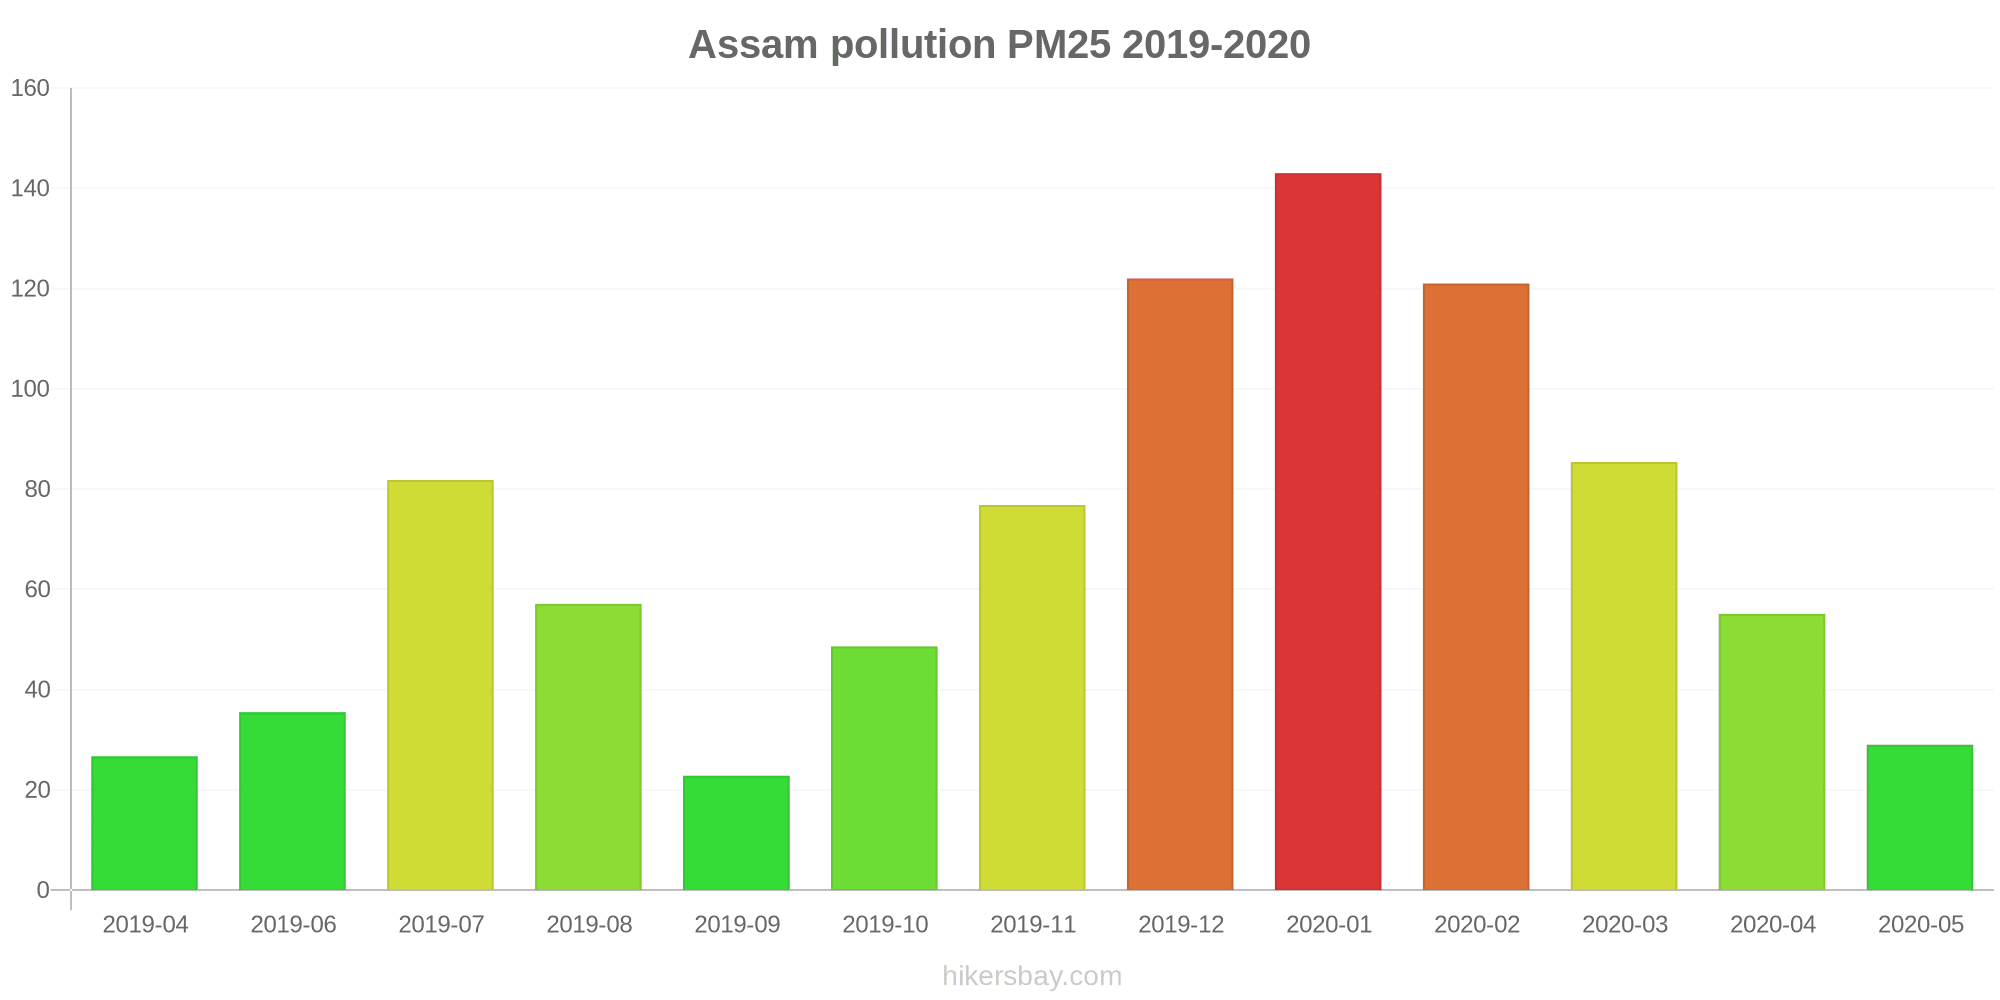
The highest PM2.5 values were recorded: 143 (January 2020).
The lowest level of particulate matter PM2.5 pollution occurs in month: September (23).
What is the level of PM10 today in Assam? (particulate matter (PM10) suspended dust)
The current level of particulate matter PM10 in Assam is:
30 (Moderate)
The highest PM10 values usually occur in month: 222 (January 2020).
The lowest value of particulate matter PM10 pollution in Assam is usually recorded in: April (36).
Current data Wednesday, August 3, 2022, 7:45 AM
SO2 12 (Good)
O3 165 (Unhealthy)
CO 180 (Good)
NO2 3 (Good)
PM2,5 20 (Moderate)
PM10 30 (Moderate)
Data on air pollution from recent days in Assam
index
2022-07-27
2022-07-28
2022-07-29
2022-07-30
2022-07-31
2022-08-01
2022-08-02
2022-08-03
so2
12
Good
12
Good
12
Good
12
Good
12
Good
12
Good
12
Good
12
Good
co
273
Good
374
Good
230
Good
237
Good
278
Good
273
Good
197
Good
179
Good
no2
3
Good
3
Good
3
Good
3
Good
3
Good
3
Good
2
Good
3
Good
pm25
25
Moderate
27
Moderate
25
Moderate
20
Moderate
20
Moderate
17
Moderate
19
Moderate
19
Moderate
pm10
45
Moderate
48
Moderate
48
Moderate
32
Moderate
32
Moderate
26
Moderate
29
Moderate
28
Moderate
o3
42
Good
38
Good
42
Good
25
Good
55
Good
59
Good
63
Good
34
Good
data source »
Air pollution in Assam from April 2019 to May 2020

index
2020-05
2020-04
2020-03
2020-02
2020-01
2019-12
2019-11
2019-10
2019-09
2019-08
2019-07
2019-06
2019-04
pm25
29 (Moderate)
55 (Unhealthy)
85 (Very Unhealthy)
121 (Very bad Hazardous)
143 (Very bad Hazardous)
122 (Very bad Hazardous)
77 (Very Unhealthy)
49 (Unhealthy for Sensitive Groups)
23 (Moderate)
57 (Unhealthy)
82 (Very Unhealthy)
36 (Unhealthy for Sensitive Groups)
27 (Moderate)
pm10
49 (Moderate)
98 (Unhealthy)
166 (Very bad Hazardous)
204 (Very bad Hazardous)
222 (Very bad Hazardous)
170 (Very bad Hazardous)
140 (Very Unhealthy)
78 (Unhealthy for Sensitive Groups)
44 (Moderate)
117 (Very Unhealthy)
105 (Unhealthy)
59 (Unhealthy for Sensitive Groups)
36 (Moderate)
no2
11 (Good)
9.6 (Good)
24 (Good)
21 (Good)
14 (Good)
11 (Good)
16 (Good)
13 (Good)
9.2 (Good)
9.5 (Good)
9.6 (Good)
14 (Good)
10 (Good)
so2
15 (Good)
16 (Good)
14 (Good)
14 (Good)
13 (Good)
12 (Good)
11 (Good)
14 (Good)
13 (Good)
12 (Good)
11 (Good)
11 (Good)
19 (Good)
co
430 (Good)
494 (Good)
582 (Good)
1 (Good)
1 (Good)
1 (Good)
975 (Good)
667 (Good)
537 (Good)
432 (Good)
428 (Good)
581 (Good)
429 (Good)
o3
37 (Good)
39 (Good)
20 (Good)
20 (Good)
19 (Good)
18 (Good)
18 (Good)
18 (Good)
16 (Good)
18 (Good)
13 (Good)
2.6 (Good)
42 (Good)
data source »
Quality of life in Assam
Green and Parks in the City
Assam
58%
Nepal: 32%
Bangladesh: 33%
Bhutan: 82%
Sri Lanka: 59%
Pakistan: 49%
particulate matter PM2.5
Assam
40 (Unhealthy for Sensitive Groups)
Pleasure of spending time in the city
Assam
49%
Nepal: 32%
Bangladesh: 26%
Bhutan: 61%
Sri Lanka: 52%
Pakistan: 43%
particulate matter PM10
Assam
74 (Unhealthy for Sensitive Groups)
Air Pollution
Assam
48%
Nepal: 76%
Bangladesh: 78%
Bhutan: 45%
Sri Lanka: 53%
Pakistan: 64%
Garbage Disposal
Assam
34%
Nepal: 25%
Bangladesh: 22%
Bhutan: 47%
Sri Lanka: 41%
Pakistan: 34%
Availability and quality of drinking water
Assam
53%
Nepal: 36%
Bangladesh: 44%
Bhutan: 64%
Sri Lanka: 65%
Pakistan: 44%
Cleanliness and tidiness
Assam
41%
Nepal: 27%
Bangladesh: 23%
Bhutan: 57%
Sri Lanka: 52%
Pakistan: 40%
Noise and Light pollution
Assam
54%
Nepal: 55%
Bangladesh: 63%
Bhutan: 55%
Sri Lanka: 50%
Pakistan: 59%
Water Pollution
Assam
58%
Nepal: 76%
Bangladesh: 74%
Bhutan: 56%
Sri Lanka: 57%
Pakistan: 70%
Source: Numbeo
Railway Colony, Guwahati - APCB
Wednesday, August 3, 2022, 7:45 AM
SO2 12 (Good)
sulfur dioxide (SO2)
O3 165 (Unhealthy)
ozone (O3)
CO 180 (Good)
carbon monoxide (CO)
NO2 2.6 (Good)
nitrogen dioxide (NO2)
PM2,5 20 (Moderate)
particulate matter (PM2.5) dust
PM10 30 (Moderate)
particulate matter (PM10) suspended dust
Railway Colony, Guwahati - APCB
index
2022-08-03
2022-08-02
2022-08-01
2022-07-31
2022-07-30
2022-07-29
2022-07-28
2022-07-27
so2
12
12
12
12
12
12
12
12
co
179
197
273
278
237
230
374
273
no2
2.6
2.5
2.6
2.5
2.6
2.6
2.5
2.5
pm25
19
19
17
20
20
25
27
25
pm10
28
29
26
32
32
48
48
45
o3
34
63
59
55
25
42
38
42
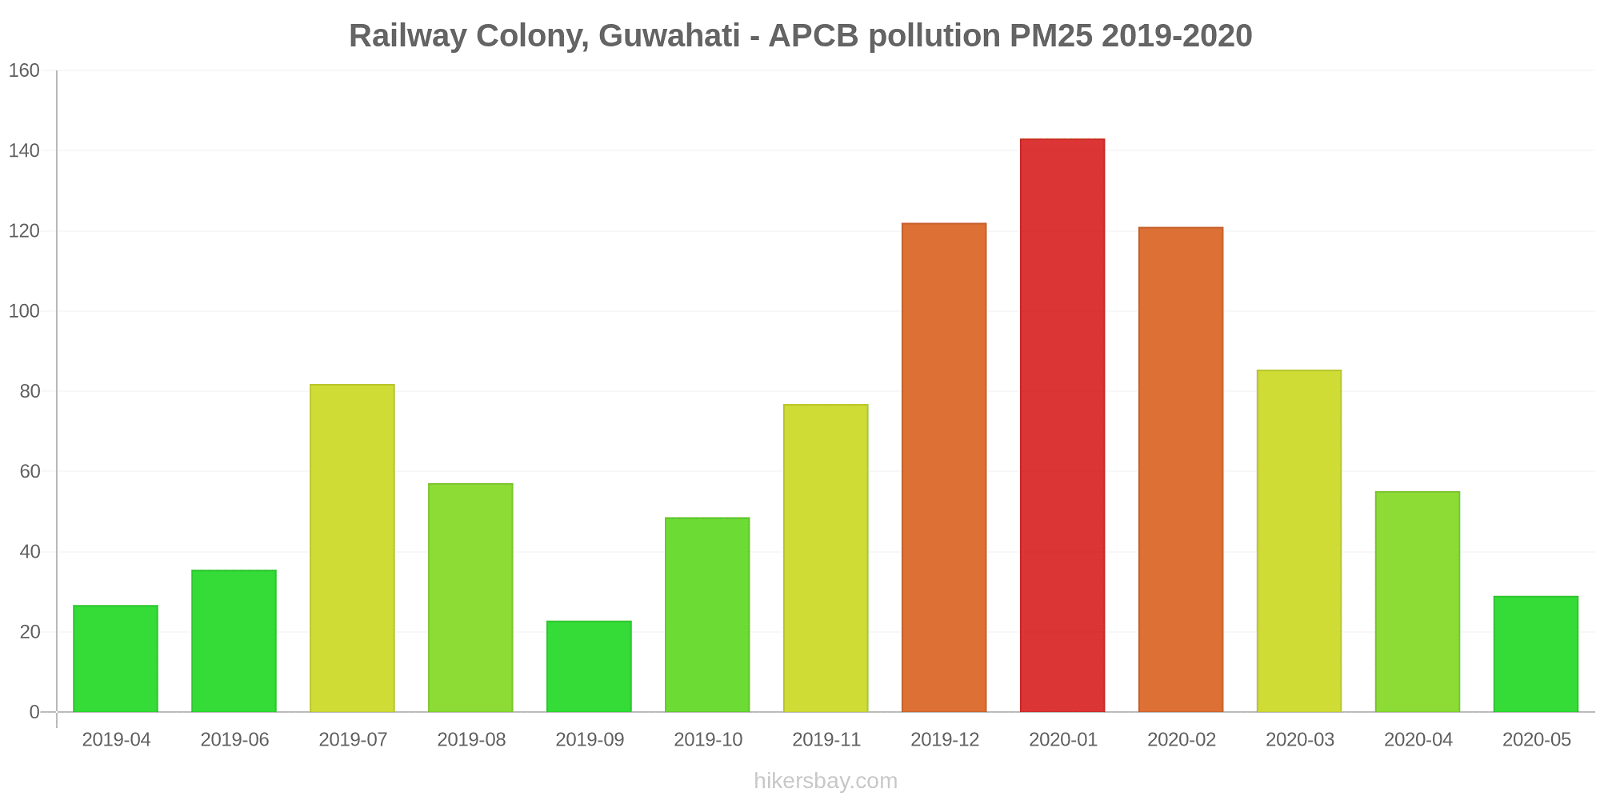
Railway Colony, Guwahati - APCB
2019-04 2020-05
index
2020-05
2020-04
2020-03
2020-02
2020-01
2019-12
2019-11
2019-10
2019-09
2019-08
2019-07
2019-06
2019-04
pm25
29
55
85
121
143
122
77
49
23
57
82
36
27
pm10
49
98
166
204
222
170
140
78
44
117
105
59
36
no2
11
9.6
24
21
14
11
16
13
9.2
9.5
9.6
14
10
so2
15
16
14
14
13
12
11
14
13
12
11
11
19
co
430
494
582
1
1
1
975
667
537
432
428
581
429
o3
37
39
20
20
19
18
18
18
16
18
13
2.6
42
* Pollution data source:
https://openaq.org
(caaqm)
The data is licensed under CC-By 4.0
SO2 12 (Good)
O3 165 (Unhealthy)
CO 180 (Good)
NO2 3 (Good)
PM2,5 20 (Moderate)
PM10 30 (Moderate)
Data on air pollution from recent days in Assam
| index | 2022-07-27 | 2022-07-28 | 2022-07-29 | 2022-07-30 | 2022-07-31 | 2022-08-01 | 2022-08-02 | 2022-08-03 |
|---|---|---|---|---|---|---|---|---|
| so2 | 12 Good |
12 Good |
12 Good |
12 Good |
12 Good |
12 Good |
12 Good |
12 Good |
| co | 273 Good |
374 Good |
230 Good |
237 Good |
278 Good |
273 Good |
197 Good |
179 Good |
| no2 | 3 Good |
3 Good |
3 Good |
3 Good |
3 Good |
3 Good |
2 Good |
3 Good |
| pm25 | 25 Moderate |
27 Moderate |
25 Moderate |
20 Moderate |
20 Moderate |
17 Moderate |
19 Moderate |
19 Moderate |
| pm10 | 45 Moderate |
48 Moderate |
48 Moderate |
32 Moderate |
32 Moderate |
26 Moderate |
29 Moderate |
28 Moderate |
| o3 | 42 Good |
38 Good |
42 Good |
25 Good |
55 Good |
59 Good |
63 Good |
34 Good |
| index | 2020-05 | 2020-04 | 2020-03 | 2020-02 | 2020-01 | 2019-12 | 2019-11 | 2019-10 | 2019-09 | 2019-08 | 2019-07 | 2019-06 | 2019-04 |
|---|---|---|---|---|---|---|---|---|---|---|---|---|---|
| pm25 | 29 (Moderate) | 55 (Unhealthy) | 85 (Very Unhealthy) | 121 (Very bad Hazardous) | 143 (Very bad Hazardous) | 122 (Very bad Hazardous) | 77 (Very Unhealthy) | 49 (Unhealthy for Sensitive Groups) | 23 (Moderate) | 57 (Unhealthy) | 82 (Very Unhealthy) | 36 (Unhealthy for Sensitive Groups) | 27 (Moderate) |
| pm10 | 49 (Moderate) | 98 (Unhealthy) | 166 (Very bad Hazardous) | 204 (Very bad Hazardous) | 222 (Very bad Hazardous) | 170 (Very bad Hazardous) | 140 (Very Unhealthy) | 78 (Unhealthy for Sensitive Groups) | 44 (Moderate) | 117 (Very Unhealthy) | 105 (Unhealthy) | 59 (Unhealthy for Sensitive Groups) | 36 (Moderate) |
| no2 | 11 (Good) | 9.6 (Good) | 24 (Good) | 21 (Good) | 14 (Good) | 11 (Good) | 16 (Good) | 13 (Good) | 9.2 (Good) | 9.5 (Good) | 9.6 (Good) | 14 (Good) | 10 (Good) |
| so2 | 15 (Good) | 16 (Good) | 14 (Good) | 14 (Good) | 13 (Good) | 12 (Good) | 11 (Good) | 14 (Good) | 13 (Good) | 12 (Good) | 11 (Good) | 11 (Good) | 19 (Good) |
| co | 430 (Good) | 494 (Good) | 582 (Good) | 1 (Good) | 1 (Good) | 1 (Good) | 975 (Good) | 667 (Good) | 537 (Good) | 432 (Good) | 428 (Good) | 581 (Good) | 429 (Good) |
| o3 | 37 (Good) | 39 (Good) | 20 (Good) | 20 (Good) | 19 (Good) | 18 (Good) | 18 (Good) | 18 (Good) | 16 (Good) | 18 (Good) | 13 (Good) | 2.6 (Good) | 42 (Good) |
Green and Parks in the City
Assam 58%
Nepal: 32% Bangladesh: 33% Bhutan: 82% Sri Lanka: 59% Pakistan: 49%particulate matter PM2.5
Assam 40 (Unhealthy for Sensitive Groups)
Pleasure of spending time in the city
Assam 49%
Nepal: 32% Bangladesh: 26% Bhutan: 61% Sri Lanka: 52% Pakistan: 43%particulate matter PM10
Assam 74 (Unhealthy for Sensitive Groups)
Air Pollution
Assam 48%
Nepal: 76% Bangladesh: 78% Bhutan: 45% Sri Lanka: 53% Pakistan: 64%Garbage Disposal
Assam 34%
Nepal: 25% Bangladesh: 22% Bhutan: 47% Sri Lanka: 41% Pakistan: 34%Availability and quality of drinking water
Assam 53%
Nepal: 36% Bangladesh: 44% Bhutan: 64% Sri Lanka: 65% Pakistan: 44%Cleanliness and tidiness
Assam 41%
Nepal: 27% Bangladesh: 23% Bhutan: 57% Sri Lanka: 52% Pakistan: 40%Noise and Light pollution
Assam 54%
Nepal: 55% Bangladesh: 63% Bhutan: 55% Sri Lanka: 50% Pakistan: 59%Water Pollution
Assam 58%
Nepal: 76% Bangladesh: 74% Bhutan: 56% Sri Lanka: 57% Pakistan: 70%SO2 12 (Good)
sulfur dioxide (SO2)O3 165 (Unhealthy)
ozone (O3)CO 180 (Good)
carbon monoxide (CO)NO2 2.6 (Good)
nitrogen dioxide (NO2)PM2,5 20 (Moderate)
particulate matter (PM2.5) dustPM10 30 (Moderate)
particulate matter (PM10) suspended dustRailway Colony, Guwahati - APCB
| index | 2022-08-03 | 2022-08-02 | 2022-08-01 | 2022-07-31 | 2022-07-30 | 2022-07-29 | 2022-07-28 | 2022-07-27 |
|---|---|---|---|---|---|---|---|---|
| so2 | 12 | 12 | 12 | 12 | 12 | 12 | 12 | 12 |
| co | 179 | 197 | 273 | 278 | 237 | 230 | 374 | 273 |
| no2 | 2.6 | 2.5 | 2.6 | 2.5 | 2.6 | 2.6 | 2.5 | 2.5 |
| pm25 | 19 | 19 | 17 | 20 | 20 | 25 | 27 | 25 |
| pm10 | 28 | 29 | 26 | 32 | 32 | 48 | 48 | 45 |
| o3 | 34 | 63 | 59 | 55 | 25 | 42 | 38 | 42 |
Railway Colony, Guwahati - APCB

| index | 2020-05 | 2020-04 | 2020-03 | 2020-02 | 2020-01 | 2019-12 | 2019-11 | 2019-10 | 2019-09 | 2019-08 | 2019-07 | 2019-06 | 2019-04 |
|---|---|---|---|---|---|---|---|---|---|---|---|---|---|
| pm25 | 29 | 55 | 85 | 121 | 143 | 122 | 77 | 49 | 23 | 57 | 82 | 36 | 27 |
| pm10 | 49 | 98 | 166 | 204 | 222 | 170 | 140 | 78 | 44 | 117 | 105 | 59 | 36 |
| no2 | 11 | 9.6 | 24 | 21 | 14 | 11 | 16 | 13 | 9.2 | 9.5 | 9.6 | 14 | 10 |
| so2 | 15 | 16 | 14 | 14 | 13 | 12 | 11 | 14 | 13 | 12 | 11 | 11 | 19 |
| co | 430 | 494 | 582 | 1 | 1 | 1 | 975 | 667 | 537 | 432 | 428 | 581 | 429 |
| o3 | 37 | 39 | 20 | 20 | 19 | 18 | 18 | 18 | 16 | 18 | 13 | 2.6 | 42 |