Air Pollution in Ballabgarh: Real-time Air Quality Index and smog alert.
Pollution and air quality forecast for Ballabgarh. Today is Monday, March 30, 2026. The following air pollution values have been recorded for Ballabgarh:- particulate matter (PM10) suspended dust - 300 (Very bad Hazardous)
- sulfur dioxide (SO2) - 4 (Good)
- particulate matter (PM2.5) dust - 123 (Very bad Hazardous)
- carbon monoxide (CO) - 3830 (Moderate)
- nitrogen dioxide (NO2) - 5 (Good)
- ozone (O3) - 6 (Good)

What is the air quality in Ballabgarh today? Is the air polluted in Ballabgarh?. Is there smog?
What is the level of PM10 today in Ballabgarh? (particulate matter (PM10) suspended dust)
The current level of particulate matter PM10 in Ballabgarh is:
300 (Very bad Hazardous)
The highest PM10 values usually occur in month: 368 (April 2019).
The lowest value of particulate matter PM10 pollution in Ballabgarh is usually recorded in: September (66).
What is the level of SO2 pollution? (sulfur dioxide (SO2))
4 (Good)
What is the current level of PM2.5 in Ballabgarh? (particulate matter (PM2.5) dust)
Today's PM2.5 level is:
123 (Very bad Hazardous)
For comparison, the highest level of PM2.5 in Ballabgarh in the last 7 days was: 126 (Monday, October 31, 2022) and the lowest: 126 (Monday, October 31, 2022).
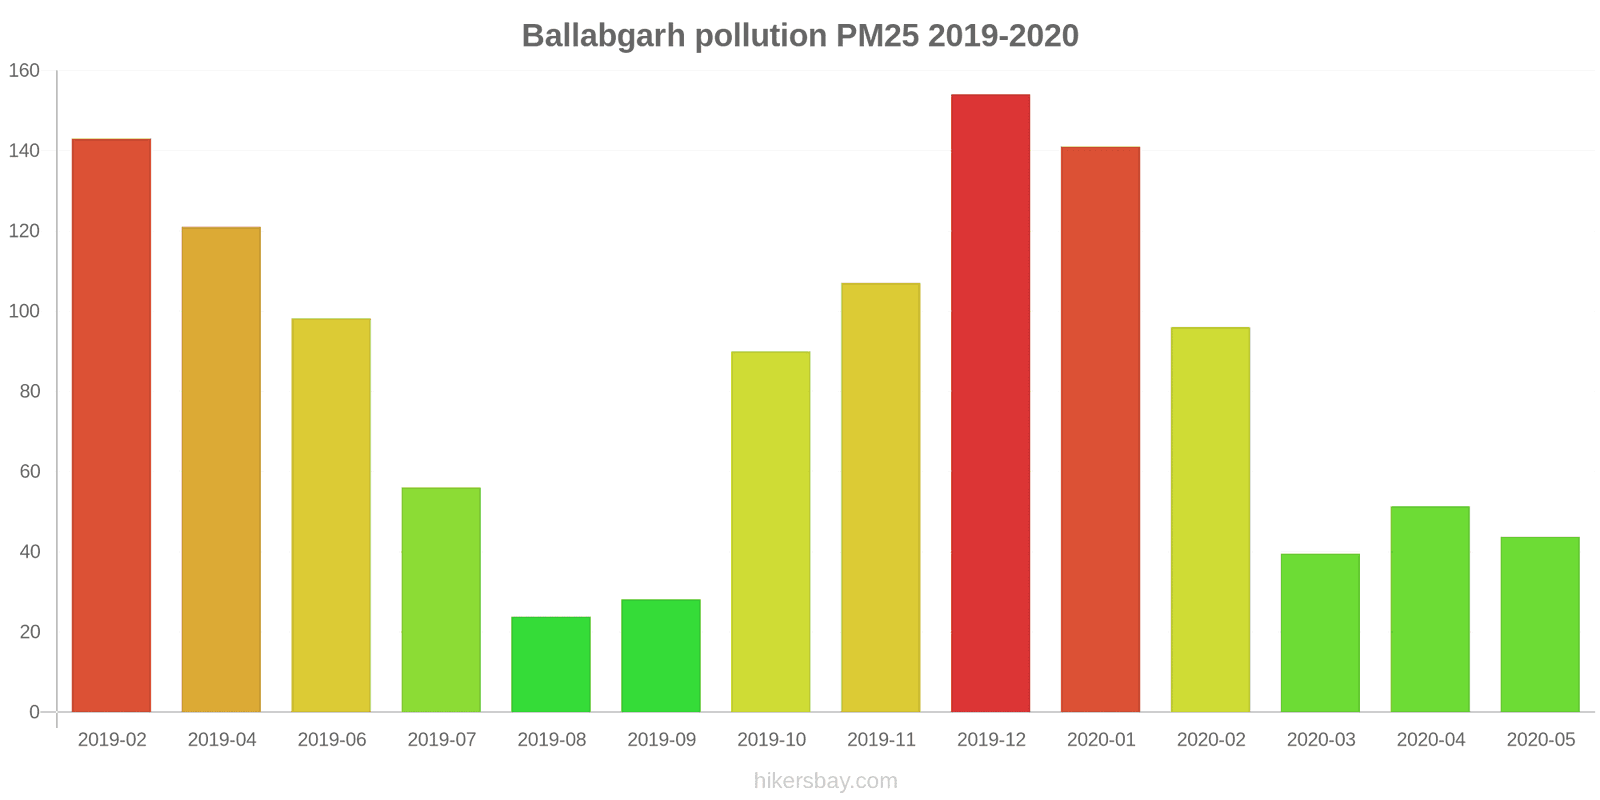
The highest PM2.5 values were recorded: 154 (December 2019).
The lowest level of particulate matter PM2.5 pollution occurs in month: August (24).
How high is the CO level? (carbon monoxide (CO))
3830 (Moderate)
How high is the level of NO2? (nitrogen dioxide (NO2))
5 (Good)
How is the O3 level today in Ballabgarh? (ozone (O3))
6 (Good)
Current data Monday, October 31, 2022, 1:45 AM
PM10 300 (Very bad Hazardous)
SO2 4 (Good)
PM2,5 123 (Very bad Hazardous)
CO 3830 (Moderate)
NO2 5 (Good)
O3 6 (Good)
Data on air pollution from recent days in Ballabgarh
index
2022-10-31
pm10
271
Very bad Hazardous
so2
4
Good
pm25
126
Very bad Hazardous
co
3525
Moderate
no2
5
Good
o3
3
Good
data source »
Air pollution in Ballabgarh from February 2019 to May 2020
index
2020-05
2020-04
2020-03
2020-02
2020-01
2019-12
2019-11
2019-10
2019-09
2019-08
2019-07
2019-06
2019-04
2019-02
pm25
44 (Unhealthy for Sensitive Groups)
51 (Unhealthy for Sensitive Groups)
40 (Unhealthy for Sensitive Groups)
96 (Very Unhealthy)
141 (Very bad Hazardous)
154 (Very bad Hazardous)
107 (Very Unhealthy)
90 (Very Unhealthy)
28 (Moderate)
24 (Moderate)
56 (Unhealthy)
98 (Very Unhealthy)
121 (Very bad Hazardous)
143 (Very bad Hazardous)
pm10
90 (Unhealthy)
68 (Unhealthy for Sensitive Groups)
98 (Unhealthy)
247 (Very bad Hazardous)
257 (Very bad Hazardous)
326 (Very bad Hazardous)
265 (Very bad Hazardous)
212 (Very bad Hazardous)
66 (Unhealthy for Sensitive Groups)
72 (Unhealthy for Sensitive Groups)
181 (Very bad Hazardous)
263 (Very bad Hazardous)
368 (Very bad Hazardous)
217 (Very bad Hazardous)
no2
5.5 (Good)
18 (Good)
22 (Good)
10 (Good)
53 (Moderate)
71 (Moderate)
40 (Moderate)
46 (Moderate)
29 (Good)
15 (Good)
18 (Good)
24 (Good)
52 (Moderate)
49 (Moderate)
so2
8 (Good)
6.2 (Good)
6.8 (Good)
9.4 (Good)
7.1 (Good)
6.7 (Good)
18 (Good)
8.7 (Good)
2.6 (Good)
2 (Good)
2.5 (Good)
9.8 (Good)
9.8 (Good)
11 (Good)
co
1 (Good)
1 (Good)
912 (Good)
1 (Good)
1 (Good)
1 (Good)
1 (Good)
1 (Good)
1 (Good)
1 (Good)
1 (Good)
976 (Good)
1 (Good)
4 (Good)
o3
8.8 (Good)
14 (Good)
9 (Good)
6 (Good)
5.3 (Good)
8.7 (Good)
12 (Good)
19 (Good)
39 (Good)
40 (Good)
56 (Good)
24 (Good)
14 (Good)
9.8 (Good)
data source »
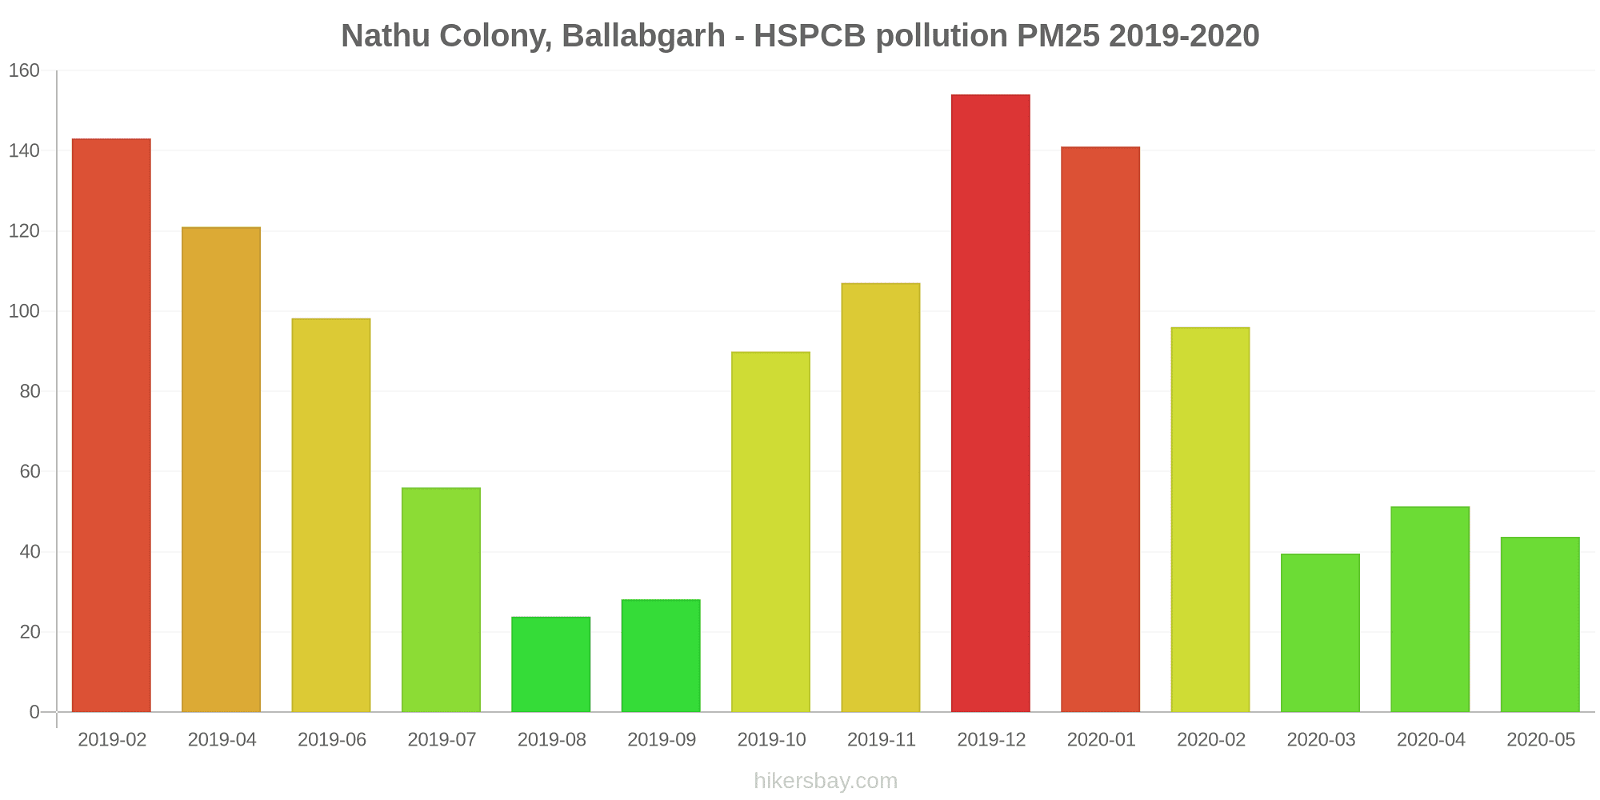
Nathu Colony, Ballabgarh - HSPCB
Monday, October 31, 2022, 1:45 AM
PM10 300 (Very bad Hazardous)
particulate matter (PM10) suspended dust
SO2 3.7 (Good)
sulfur dioxide (SO2)
PM2,5 123 (Very bad Hazardous)
particulate matter (PM2.5) dust
CO 3830 (Moderate)
carbon monoxide (CO)
NO2 4.8 (Good)
nitrogen dioxide (NO2)
O3 5.6 (Good)
ozone (O3)
Nathu Colony, Ballabgarh - HSPCB
index
2022-10-31
pm10
271
so2
3.7
pm25
126
co
3525
no2
4.8
o3
3.2
Nathu Colony, Ballabgarh - HSPCB
2019-02 2020-05
index
2020-05
2020-04
2020-03
2020-02
2020-01
2019-12
2019-11
2019-10
2019-09
2019-08
2019-07
2019-06
2019-04
2019-02
pm25
44
51
40
96
141
154
107
90
28
24
56
98
121
143
pm10
90
68
98
247
257
326
265
212
66
72
181
263
368
217
no2
5.5
18
22
10
53
71
40
46
29
15
18
24
52
49
so2
8
6.2
6.8
9.4
7.1
6.7
18
8.7
2.6
2
2.5
9.8
9.8
11
co
1
1
912
1
1
1
1
1
1
1
1
976
1
4
o3
8.8
14
9
6
5.3
8.7
12
19
39
40
56
24
14
9.8
* Pollution data source:
https://openaq.org
(caaqm)
The data is licensed under CC-By 4.0
PM10 300 (Very bad Hazardous)
SO2 4 (Good)
PM2,5 123 (Very bad Hazardous)
CO 3830 (Moderate)
NO2 5 (Good)
O3 6 (Good)
Data on air pollution from recent days in Ballabgarh
| index | 2022-10-31 |
|---|---|
| pm10 | 271 Very bad Hazardous |
| so2 | 4 Good |
| pm25 | 126 Very bad Hazardous |
| co | 3525 Moderate |
| no2 | 5 Good |
| o3 | 3 Good |

| index | 2020-05 | 2020-04 | 2020-03 | 2020-02 | 2020-01 | 2019-12 | 2019-11 | 2019-10 | 2019-09 | 2019-08 | 2019-07 | 2019-06 | 2019-04 | 2019-02 |
|---|---|---|---|---|---|---|---|---|---|---|---|---|---|---|
| pm25 | 44 (Unhealthy for Sensitive Groups) | 51 (Unhealthy for Sensitive Groups) | 40 (Unhealthy for Sensitive Groups) | 96 (Very Unhealthy) | 141 (Very bad Hazardous) | 154 (Very bad Hazardous) | 107 (Very Unhealthy) | 90 (Very Unhealthy) | 28 (Moderate) | 24 (Moderate) | 56 (Unhealthy) | 98 (Very Unhealthy) | 121 (Very bad Hazardous) | 143 (Very bad Hazardous) |
| pm10 | 90 (Unhealthy) | 68 (Unhealthy for Sensitive Groups) | 98 (Unhealthy) | 247 (Very bad Hazardous) | 257 (Very bad Hazardous) | 326 (Very bad Hazardous) | 265 (Very bad Hazardous) | 212 (Very bad Hazardous) | 66 (Unhealthy for Sensitive Groups) | 72 (Unhealthy for Sensitive Groups) | 181 (Very bad Hazardous) | 263 (Very bad Hazardous) | 368 (Very bad Hazardous) | 217 (Very bad Hazardous) |
| no2 | 5.5 (Good) | 18 (Good) | 22 (Good) | 10 (Good) | 53 (Moderate) | 71 (Moderate) | 40 (Moderate) | 46 (Moderate) | 29 (Good) | 15 (Good) | 18 (Good) | 24 (Good) | 52 (Moderate) | 49 (Moderate) |
| so2 | 8 (Good) | 6.2 (Good) | 6.8 (Good) | 9.4 (Good) | 7.1 (Good) | 6.7 (Good) | 18 (Good) | 8.7 (Good) | 2.6 (Good) | 2 (Good) | 2.5 (Good) | 9.8 (Good) | 9.8 (Good) | 11 (Good) |
| co | 1 (Good) | 1 (Good) | 912 (Good) | 1 (Good) | 1 (Good) | 1 (Good) | 1 (Good) | 1 (Good) | 1 (Good) | 1 (Good) | 1 (Good) | 976 (Good) | 1 (Good) | 4 (Good) |
| o3 | 8.8 (Good) | 14 (Good) | 9 (Good) | 6 (Good) | 5.3 (Good) | 8.7 (Good) | 12 (Good) | 19 (Good) | 39 (Good) | 40 (Good) | 56 (Good) | 24 (Good) | 14 (Good) | 9.8 (Good) |
PM10 300 (Very bad Hazardous)
particulate matter (PM10) suspended dustSO2 3.7 (Good)
sulfur dioxide (SO2)PM2,5 123 (Very bad Hazardous)
particulate matter (PM2.5) dustCO 3830 (Moderate)
carbon monoxide (CO)NO2 4.8 (Good)
nitrogen dioxide (NO2)O3 5.6 (Good)
ozone (O3)Nathu Colony, Ballabgarh - HSPCB
| index | 2022-10-31 |
|---|---|
| pm10 | 271 |
| so2 | 3.7 |
| pm25 | 126 |
| co | 3525 |
| no2 | 4.8 |
| o3 | 3.2 |
Nathu Colony, Ballabgarh - HSPCB

| index | 2020-05 | 2020-04 | 2020-03 | 2020-02 | 2020-01 | 2019-12 | 2019-11 | 2019-10 | 2019-09 | 2019-08 | 2019-07 | 2019-06 | 2019-04 | 2019-02 |
|---|---|---|---|---|---|---|---|---|---|---|---|---|---|---|
| pm25 | 44 | 51 | 40 | 96 | 141 | 154 | 107 | 90 | 28 | 24 | 56 | 98 | 121 | 143 |
| pm10 | 90 | 68 | 98 | 247 | 257 | 326 | 265 | 212 | 66 | 72 | 181 | 263 | 368 | 217 |
| no2 | 5.5 | 18 | 22 | 10 | 53 | 71 | 40 | 46 | 29 | 15 | 18 | 24 | 52 | 49 |
| so2 | 8 | 6.2 | 6.8 | 9.4 | 7.1 | 6.7 | 18 | 8.7 | 2.6 | 2 | 2.5 | 9.8 | 9.8 | 11 |
| co | 1 | 1 | 912 | 1 | 1 | 1 | 1 | 1 | 1 | 1 | 1 | 976 | 1 | 4 |
| o3 | 8.8 | 14 | 9 | 6 | 5.3 | 8.7 | 12 | 19 | 39 | 40 | 56 | 24 | 14 | 9.8 |