Air Pollution in Purba Bardhaman: Real-time Air Quality Index and smog alert.
Pollution and air quality forecast for Purba Bardhaman. Today is Wednesday, May 13, 2026. The following air pollution values have been recorded for Purba Bardhaman:- sulfur dioxide (SO2) - 14 (Good)
- particulate matter (PM2.5) dust - 62 (Unhealthy)
- carbon monoxide (CO) - 1025 (Good)
- particulate matter (PM10) suspended dust - 174 (Very bad Hazardous)
- ozone (O3) - 31 (Good)
- nitrogen dioxide (NO2) - 29 (Good)

What is the air quality in Purba Bardhaman today? Is the air polluted in Purba Bardhaman?. Is there smog?
What is the level of SO2 pollution? (sulfur dioxide (SO2))
14 (Good)
What is the current level of PM2.5 in Purba Bardhaman? (particulate matter (PM2.5) dust)
Today's PM2.5 level is:
62 (Unhealthy)
For comparison, the highest level of PM2.5 in Purba Bardhaman in the last 7 days was: 62 (Monday, October 31, 2022) and the lowest: 62 (Monday, October 31, 2022).
The highest PM2.5 values were recorded: 115 (November 2019).
The lowest level of particulate matter PM2.5 pollution occurs in month: May (21).
How high is the CO level? (carbon monoxide (CO))
1025 (Good)
What is the level of PM10 today in Purba Bardhaman? (particulate matter (PM10) suspended dust)
The current level of particulate matter PM10 in Purba Bardhaman is:
174 (Very bad Hazardous)
The highest PM10 values usually occur in month: 219 (February 2018).
The lowest value of particulate matter PM10 pollution in Purba Bardhaman is usually recorded in: September (34).
How is the O3 level today in Purba Bardhaman? (ozone (O3))
31 (Good)
How high is the level of NO2? (nitrogen dioxide (NO2))
29 (Good)
Current data Monday, October 31, 2022, 1:45 AM
SO2 14 (Good)
PM2,5 62 (Unhealthy)
CO 1025 (Good)
PM10 174 (Very bad Hazardous)
O3 31 (Good)
NO2 29 (Good)
Data on air pollution from recent days in Purba Bardhaman
index
2022-10-31
so2
14
Good
pm25
62
Unhealthy
co
1078
Good
pm10
169
Very bad Hazardous
o3
28
Good
no2
29
Good
data source »
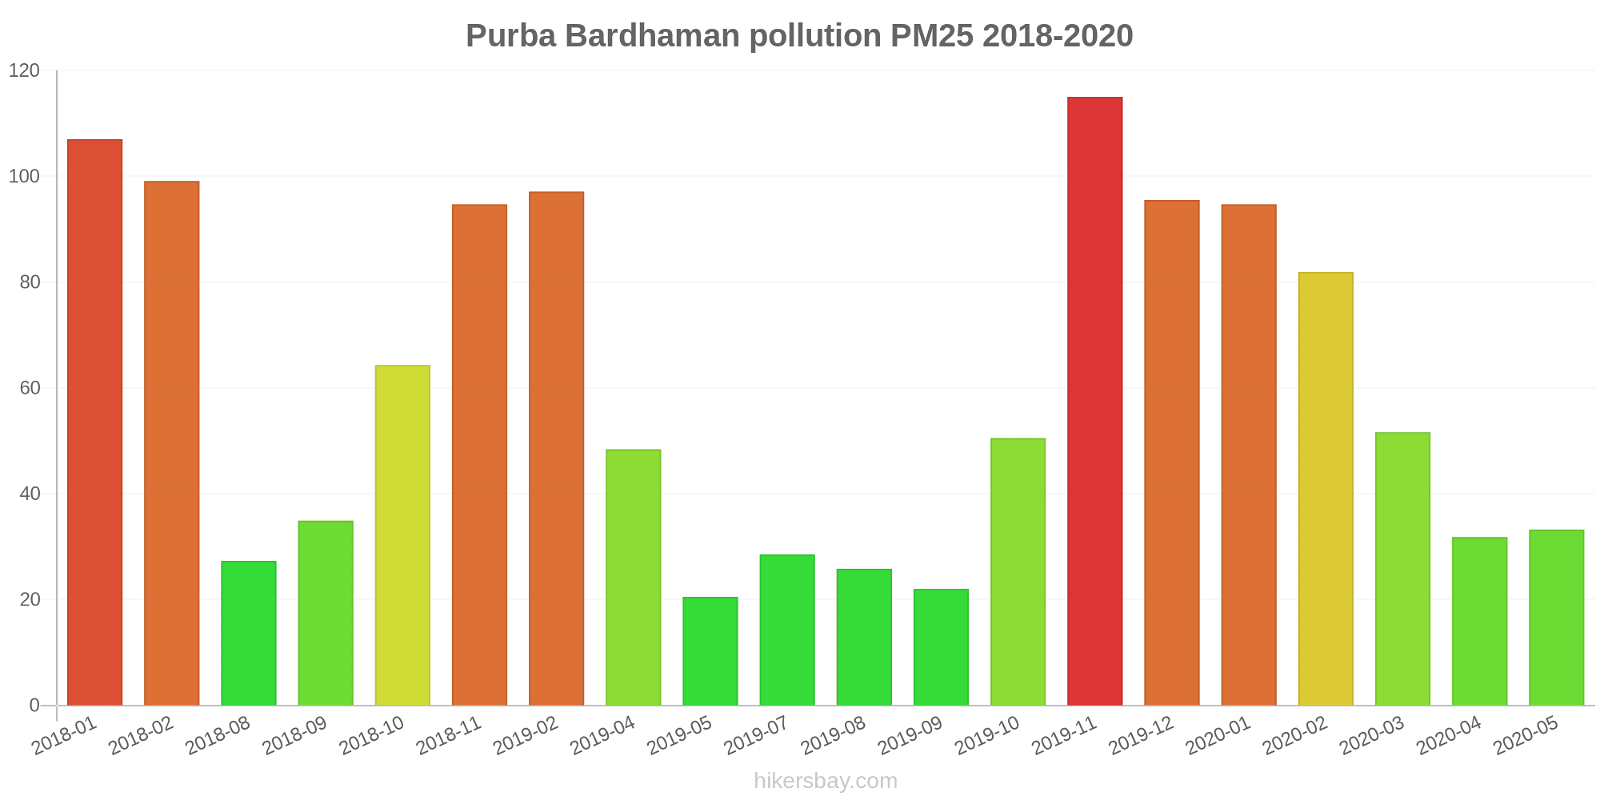
Air pollution in Purba Bardhaman from March 2018 to May 2020
index
2020-05
2020-04
2020-03
2020-02
2020-01
2019-12
2019-11
2019-10
2019-09
2019-08
2019-07
2019-05
2019-04
2019-02
2018-11
2018-10
2018-09
2018-08
2018-02
2018-01
2018-05
2018-04
2018-03
pm25
33 (Moderate)
32 (Moderate)
52 (Unhealthy for Sensitive Groups)
82 (Very Unhealthy)
95 (Very Unhealthy)
96 (Very Unhealthy)
115 (Very bad Hazardous)
51 (Unhealthy for Sensitive Groups)
22 (Moderate)
26 (Moderate)
29 (Moderate)
21 (Moderate)
48 (Unhealthy for Sensitive Groups)
97 (Very Unhealthy)
95 (Very Unhealthy)
64 (Unhealthy)
35 (Moderate)
27 (Moderate)
99 (Very Unhealthy)
107 (Very Unhealthy)
- (Good)
- (Good)
- (Good)
pm10
59 (Unhealthy for Sensitive Groups)
76 (Unhealthy for Sensitive Groups)
104 (Unhealthy)
157 (Very bad Hazardous)
163 (Very bad Hazardous)
166 (Very bad Hazardous)
212 (Very bad Hazardous)
58 (Unhealthy for Sensitive Groups)
34 (Moderate)
44 (Moderate)
57 (Unhealthy for Sensitive Groups)
39 (Moderate)
116 (Very Unhealthy)
143 (Very Unhealthy)
149 (Very Unhealthy)
111 (Very Unhealthy)
66 (Unhealthy for Sensitive Groups)
55 (Unhealthy for Sensitive Groups)
219 (Very bad Hazardous)
204 (Very bad Hazardous)
141 (Very Unhealthy)
160 (Very bad Hazardous)
218 (Very bad Hazardous)
no2
12 (Good)
15 (Good)
32 (Good)
24 (Good)
46 (Moderate)
50 (Moderate)
51 (Moderate)
22 (Good)
7.3 (Good)
23 (Good)
22 (Good)
20 (Good)
25 (Good)
4.2 (Good)
56 (Moderate)
51 (Moderate)
21 (Good)
22 (Good)
63 (Moderate)
54 (Moderate)
61 (Moderate)
72 (Moderate)
71 (Moderate)
so2
12 (Good)
13 (Good)
15 (Good)
18 (Good)
15 (Good)
11 (Good)
16 (Good)
11 (Good)
14 (Good)
37 (Good)
16 (Good)
14 (Good)
9.4 (Good)
15 (Good)
15 (Good)
15 (Good)
28 (Good)
11 (Good)
25 (Good)
16 (Good)
15 (Good)
14 (Good)
17 (Good)
co
475 (Good)
502 (Good)
617 (Good)
841 (Good)
967 (Good)
751 (Good)
923 (Good)
532 (Good)
342 (Good)
338 (Good)
595 (Good)
461 (Good)
485 (Good)
799 (Good)
921 (Good)
837 (Good)
647 (Good)
357 (Good)
1 (Good)
1 (Good)
779 (Good)
17 (Good)
47 (Good)
o3
21 (Good)
26 (Good)
28 (Good)
31 (Good)
80 (Moderate)
22 (Good)
38 (Good)
28 (Good)
16 (Good)
9.2 (Good)
12 (Good)
14 (Good)
41 (Good)
7.4 (Good)
25 (Good)
23 (Good)
17 (Good)
21 (Good)
26 (Good)
35 (Good)
19 (Good)
19 (Good)
- (Good)
data source »
Quality of life in Purba Bardhaman
Green and Parks in the City
Purba Bardhaman
57%
Nepal: 32%
Bangladesh: 33%
Bhutan: 82%
Sri Lanka: 59%
Pakistan: 49%
particulate matter PM2.5
Purba Bardhaman
61 (Unhealthy)
Pleasure of spending time in the city
Purba Bardhaman
30%
Nepal: 32%
Bangladesh: 26%
Bhutan: 61%
Sri Lanka: 52%
Pakistan: 43%
particulate matter PM10
Purba Bardhaman
110 (Very Unhealthy)
Air Pollution
Purba Bardhaman
80%
Nepal: 76%
Bangladesh: 78%
Bhutan: 45%
Sri Lanka: 53%
Pakistan: 64%
Garbage Disposal
Purba Bardhaman
42%
Nepal: 25%
Bangladesh: 22%
Bhutan: 47%
Sri Lanka: 41%
Pakistan: 34%
Availability and quality of drinking water
Purba Bardhaman
67%
Nepal: 36%
Bangladesh: 44%
Bhutan: 64%
Sri Lanka: 65%
Pakistan: 44%
Cleanliness and tidiness
Purba Bardhaman
29%
Nepal: 27%
Bangladesh: 23%
Bhutan: 57%
Sri Lanka: 52%
Pakistan: 40%
Noise and Light pollution
Purba Bardhaman
58%
Nepal: 55%
Bangladesh: 63%
Bhutan: 55%
Sri Lanka: 50%
Pakistan: 59%
Water Pollution
Purba Bardhaman
72%
Nepal: 76%
Bangladesh: 74%
Bhutan: 56%
Sri Lanka: 57%
Pakistan: 70%
Source: Numbeo
Asansol Court Area, Asansol - WBPCB
Monday, October 31, 2022, 1:45 AM
SO2 9.3 (Good)
sulfur dioxide (SO2)
PM2,5 74 (Unhealthy)
particulate matter (PM2.5) dust
CO 860 (Good)
carbon monoxide (CO)
PM10 183 (Very bad Hazardous)
particulate matter (PM10) suspended dust
O3 60 (Good)
ozone (O3)
NO2 37 (Good)
nitrogen dioxide (NO2)
Sidhu Kanhu Indoor Stadium, Durgapur - WBPCB
Monday, October 31, 2022, 1:45 AM
PM10 166 (Very bad Hazardous)
particulate matter (PM10) suspended dust
NO2 21 (Good)
nitrogen dioxide (NO2)
SO2 18 (Good)
sulfur dioxide (SO2)
CO 1190 (Good)
carbon monoxide (CO)
O3 1.4 (Good)
ozone (O3)
PM2,5 50 (Unhealthy for Sensitive Groups)
particulate matter (PM2.5) dust
Asansol Court Area, Asansol - WBPCB
index
2022-10-31
so2
9.8
pm25
73
co
965
pm10
171
o3
54
no2
37
Sidhu Kanhu Indoor Stadium, Durgapur - WBPCB
index
2022-10-31
pm10
166
no2
21
so2
18
co
1190
o3
1.4
pm25
50
Asansol Court Area, Asansol - WBPCB
2018-01 2020-05
index
2020-05
2020-04
2020-03
2020-02
2020-01
2019-12
2019-11
2019-10
2019-09
2019-08
2019-07
2019-05
2019-04
2019-02
2018-11
2018-10
2018-09
2018-08
2018-02
2018-01
no2
12
15
32
24
46
50
51
22
7.3
23
22
20
25
4.2
54
29
13
13
63
46
so2
9.9
13
17
22
15
11
16
8.6
14
60
16
0.54
4.7
16
15
19
28
5.5
29
20
co
475
502
617
841
967
751
923
532
342
338
375
402
410
725
949
728
623
1
1
1
o3
21
26
28
31
80
22
38
28
16
9.2
12
14
41
7.4
25
36
27
34
26
35
pm25
33
32
52
82
95
96
115
51
22
26
29
21
48
97
95
64
35
27
99
107
pm10
59
76
104
157
163
166
212
71
29
39
46
39
103
143
154
109
65
45
179
164
Sidhu Kanhu Indoor Stadium, Durgapur - WBPCB
index
2020-05
2020-04
2020-03
2020-02
2019-10
2019-09
2019-08
2019-07
2019-05
2019-04
2019-02
2018-11
2018-10
2018-09
2018-08
2018-05
2018-04
2018-03
2018-02
2018-01
no2
-
-
-
-
-
-
-
-
-
-
-
57
72
30
31
61
72
71
64
63
so2
13
13
13
13
14
14
15
16
27
14
13
15
11
-
16
15
14
17
20
13
co
-
-
-
-
-
-
-
814
519
560
872
892
946
671
713
779
17
47
1
1
pm10
-
-
-
-
44
38
49
69
39
129
-
143
112
66
65
141
160
218
259
243
o3
-
-
-
-
-
-
-
-
-
-
-
26
10
7
7.8
19
19
-
-
-
* Pollution data source:
https://openaq.org
(caaqm)
The data is licensed under CC-By 4.0
SO2 14 (Good)
PM2,5 62 (Unhealthy)
CO 1025 (Good)
PM10 174 (Very bad Hazardous)
O3 31 (Good)
NO2 29 (Good)
Data on air pollution from recent days in Purba Bardhaman
| index | 2022-10-31 |
|---|---|
| so2 | 14 Good |
| pm25 | 62 Unhealthy |
| co | 1078 Good |
| pm10 | 169 Very bad Hazardous |
| o3 | 28 Good |
| no2 | 29 Good |

| index | 2020-05 | 2020-04 | 2020-03 | 2020-02 | 2020-01 | 2019-12 | 2019-11 | 2019-10 | 2019-09 | 2019-08 | 2019-07 | 2019-05 | 2019-04 | 2019-02 | 2018-11 | 2018-10 | 2018-09 | 2018-08 | 2018-02 | 2018-01 | 2018-05 | 2018-04 | 2018-03 |
|---|---|---|---|---|---|---|---|---|---|---|---|---|---|---|---|---|---|---|---|---|---|---|---|
| pm25 | 33 (Moderate) | 32 (Moderate) | 52 (Unhealthy for Sensitive Groups) | 82 (Very Unhealthy) | 95 (Very Unhealthy) | 96 (Very Unhealthy) | 115 (Very bad Hazardous) | 51 (Unhealthy for Sensitive Groups) | 22 (Moderate) | 26 (Moderate) | 29 (Moderate) | 21 (Moderate) | 48 (Unhealthy for Sensitive Groups) | 97 (Very Unhealthy) | 95 (Very Unhealthy) | 64 (Unhealthy) | 35 (Moderate) | 27 (Moderate) | 99 (Very Unhealthy) | 107 (Very Unhealthy) | - (Good) | - (Good) | - (Good) |
| pm10 | 59 (Unhealthy for Sensitive Groups) | 76 (Unhealthy for Sensitive Groups) | 104 (Unhealthy) | 157 (Very bad Hazardous) | 163 (Very bad Hazardous) | 166 (Very bad Hazardous) | 212 (Very bad Hazardous) | 58 (Unhealthy for Sensitive Groups) | 34 (Moderate) | 44 (Moderate) | 57 (Unhealthy for Sensitive Groups) | 39 (Moderate) | 116 (Very Unhealthy) | 143 (Very Unhealthy) | 149 (Very Unhealthy) | 111 (Very Unhealthy) | 66 (Unhealthy for Sensitive Groups) | 55 (Unhealthy for Sensitive Groups) | 219 (Very bad Hazardous) | 204 (Very bad Hazardous) | 141 (Very Unhealthy) | 160 (Very bad Hazardous) | 218 (Very bad Hazardous) |
| no2 | 12 (Good) | 15 (Good) | 32 (Good) | 24 (Good) | 46 (Moderate) | 50 (Moderate) | 51 (Moderate) | 22 (Good) | 7.3 (Good) | 23 (Good) | 22 (Good) | 20 (Good) | 25 (Good) | 4.2 (Good) | 56 (Moderate) | 51 (Moderate) | 21 (Good) | 22 (Good) | 63 (Moderate) | 54 (Moderate) | 61 (Moderate) | 72 (Moderate) | 71 (Moderate) |
| so2 | 12 (Good) | 13 (Good) | 15 (Good) | 18 (Good) | 15 (Good) | 11 (Good) | 16 (Good) | 11 (Good) | 14 (Good) | 37 (Good) | 16 (Good) | 14 (Good) | 9.4 (Good) | 15 (Good) | 15 (Good) | 15 (Good) | 28 (Good) | 11 (Good) | 25 (Good) | 16 (Good) | 15 (Good) | 14 (Good) | 17 (Good) |
| co | 475 (Good) | 502 (Good) | 617 (Good) | 841 (Good) | 967 (Good) | 751 (Good) | 923 (Good) | 532 (Good) | 342 (Good) | 338 (Good) | 595 (Good) | 461 (Good) | 485 (Good) | 799 (Good) | 921 (Good) | 837 (Good) | 647 (Good) | 357 (Good) | 1 (Good) | 1 (Good) | 779 (Good) | 17 (Good) | 47 (Good) |
| o3 | 21 (Good) | 26 (Good) | 28 (Good) | 31 (Good) | 80 (Moderate) | 22 (Good) | 38 (Good) | 28 (Good) | 16 (Good) | 9.2 (Good) | 12 (Good) | 14 (Good) | 41 (Good) | 7.4 (Good) | 25 (Good) | 23 (Good) | 17 (Good) | 21 (Good) | 26 (Good) | 35 (Good) | 19 (Good) | 19 (Good) | - (Good) |
Green and Parks in the City
Purba Bardhaman 57%
Nepal: 32% Bangladesh: 33% Bhutan: 82% Sri Lanka: 59% Pakistan: 49%particulate matter PM2.5
Purba Bardhaman 61 (Unhealthy)
Pleasure of spending time in the city
Purba Bardhaman 30%
Nepal: 32% Bangladesh: 26% Bhutan: 61% Sri Lanka: 52% Pakistan: 43%particulate matter PM10
Purba Bardhaman 110 (Very Unhealthy)
Air Pollution
Purba Bardhaman 80%
Nepal: 76% Bangladesh: 78% Bhutan: 45% Sri Lanka: 53% Pakistan: 64%Garbage Disposal
Purba Bardhaman 42%
Nepal: 25% Bangladesh: 22% Bhutan: 47% Sri Lanka: 41% Pakistan: 34%Availability and quality of drinking water
Purba Bardhaman 67%
Nepal: 36% Bangladesh: 44% Bhutan: 64% Sri Lanka: 65% Pakistan: 44%Cleanliness and tidiness
Purba Bardhaman 29%
Nepal: 27% Bangladesh: 23% Bhutan: 57% Sri Lanka: 52% Pakistan: 40%Noise and Light pollution
Purba Bardhaman 58%
Nepal: 55% Bangladesh: 63% Bhutan: 55% Sri Lanka: 50% Pakistan: 59%Water Pollution
Purba Bardhaman 72%
Nepal: 76% Bangladesh: 74% Bhutan: 56% Sri Lanka: 57% Pakistan: 70%SO2 9.3 (Good)
sulfur dioxide (SO2)PM2,5 74 (Unhealthy)
particulate matter (PM2.5) dustCO 860 (Good)
carbon monoxide (CO)PM10 183 (Very bad Hazardous)
particulate matter (PM10) suspended dustO3 60 (Good)
ozone (O3)NO2 37 (Good)
nitrogen dioxide (NO2)PM10 166 (Very bad Hazardous)
particulate matter (PM10) suspended dustNO2 21 (Good)
nitrogen dioxide (NO2)SO2 18 (Good)
sulfur dioxide (SO2)CO 1190 (Good)
carbon monoxide (CO)O3 1.4 (Good)
ozone (O3)PM2,5 50 (Unhealthy for Sensitive Groups)
particulate matter (PM2.5) dustAsansol Court Area, Asansol - WBPCB
| index | 2022-10-31 |
|---|---|
| so2 | 9.8 |
| pm25 | 73 |
| co | 965 |
| pm10 | 171 |
| o3 | 54 |
| no2 | 37 |
Sidhu Kanhu Indoor Stadium, Durgapur - WBPCB
| index | 2022-10-31 |
|---|---|
| pm10 | 166 |
| no2 | 21 |
| so2 | 18 |
| co | 1190 |
| o3 | 1.4 |
| pm25 | 50 |
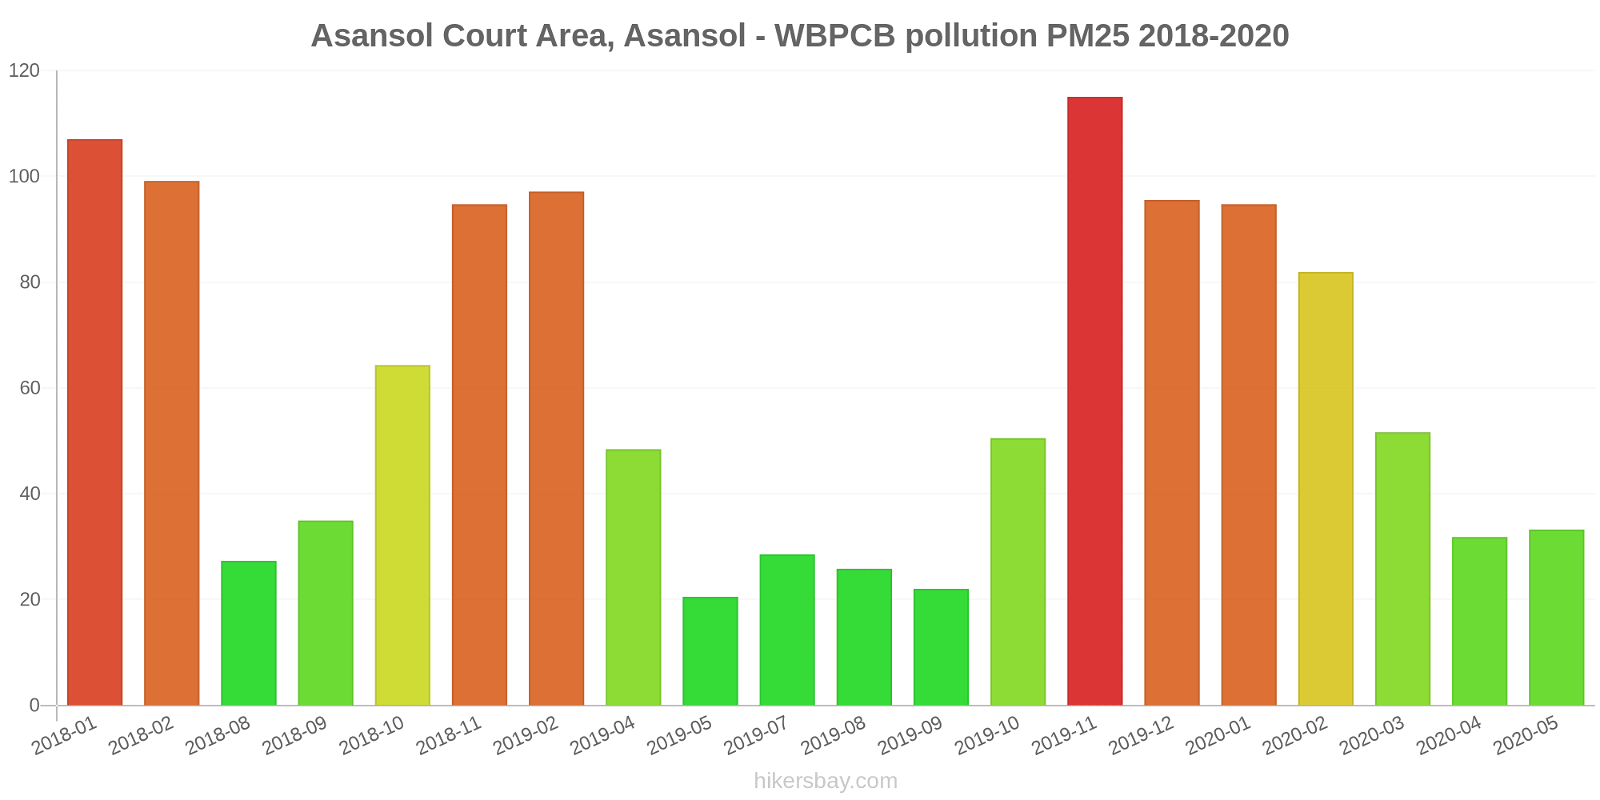
Asansol Court Area, Asansol - WBPCB

| index | 2020-05 | 2020-04 | 2020-03 | 2020-02 | 2020-01 | 2019-12 | 2019-11 | 2019-10 | 2019-09 | 2019-08 | 2019-07 | 2019-05 | 2019-04 | 2019-02 | 2018-11 | 2018-10 | 2018-09 | 2018-08 | 2018-02 | 2018-01 |
|---|---|---|---|---|---|---|---|---|---|---|---|---|---|---|---|---|---|---|---|---|
| no2 | 12 | 15 | 32 | 24 | 46 | 50 | 51 | 22 | 7.3 | 23 | 22 | 20 | 25 | 4.2 | 54 | 29 | 13 | 13 | 63 | 46 |
| so2 | 9.9 | 13 | 17 | 22 | 15 | 11 | 16 | 8.6 | 14 | 60 | 16 | 0.54 | 4.7 | 16 | 15 | 19 | 28 | 5.5 | 29 | 20 |
| co | 475 | 502 | 617 | 841 | 967 | 751 | 923 | 532 | 342 | 338 | 375 | 402 | 410 | 725 | 949 | 728 | 623 | 1 | 1 | 1 |
| o3 | 21 | 26 | 28 | 31 | 80 | 22 | 38 | 28 | 16 | 9.2 | 12 | 14 | 41 | 7.4 | 25 | 36 | 27 | 34 | 26 | 35 |
| pm25 | 33 | 32 | 52 | 82 | 95 | 96 | 115 | 51 | 22 | 26 | 29 | 21 | 48 | 97 | 95 | 64 | 35 | 27 | 99 | 107 |
| pm10 | 59 | 76 | 104 | 157 | 163 | 166 | 212 | 71 | 29 | 39 | 46 | 39 | 103 | 143 | 154 | 109 | 65 | 45 | 179 | 164 |
Sidhu Kanhu Indoor Stadium, Durgapur - WBPCB
| index | 2020-05 | 2020-04 | 2020-03 | 2020-02 | 2019-10 | 2019-09 | 2019-08 | 2019-07 | 2019-05 | 2019-04 | 2019-02 | 2018-11 | 2018-10 | 2018-09 | 2018-08 | 2018-05 | 2018-04 | 2018-03 | 2018-02 | 2018-01 |
|---|---|---|---|---|---|---|---|---|---|---|---|---|---|---|---|---|---|---|---|---|
| no2 | - | - | - | - | - | - | - | - | - | - | - | 57 | 72 | 30 | 31 | 61 | 72 | 71 | 64 | 63 |
| so2 | 13 | 13 | 13 | 13 | 14 | 14 | 15 | 16 | 27 | 14 | 13 | 15 | 11 | - | 16 | 15 | 14 | 17 | 20 | 13 |
| co | - | - | - | - | - | - | - | 814 | 519 | 560 | 872 | 892 | 946 | 671 | 713 | 779 | 17 | 47 | 1 | 1 |
| pm10 | - | - | - | - | 44 | 38 | 49 | 69 | 39 | 129 | - | 143 | 112 | 66 | 65 | 141 | 160 | 218 | 259 | 243 |
| o3 | - | - | - | - | - | - | - | - | - | - | - | 26 | 10 | 7 | 7.8 | 19 | 19 | - | - | - |