Air Pollution in Belapurpāda: Real-time Air Quality Index and smog alert.
Pollution and air quality forecast for Belapurpāda. Today is Wednesday, May 13, 2026. The following air pollution values have been recorded for Belapurpāda:- particulate matter (PM2.5) dust - 125 (Very bad Hazardous)
- particulate matter (PM10) suspended dust - 169 (Very bad Hazardous)
- nitrogen dioxide (NO2) - 21 (Good)
- sulfur dioxide (SO2) - 12 (Good)
- carbon monoxide (CO) - 1310 (Good)

What is the air quality in Belapurpāda today? Is the air polluted in Belapurpāda?. Is there smog?
What is the current level of PM2.5 in Belapurpāda? (particulate matter (PM2.5) dust)
Today's PM2.5 level is:
125 (Very bad Hazardous)
For comparison, the highest level of PM2.5 in Belapurpāda in the last 7 days was: 125 (Monday, October 31, 2022) and the lowest: 125 (Monday, October 31, 2022).
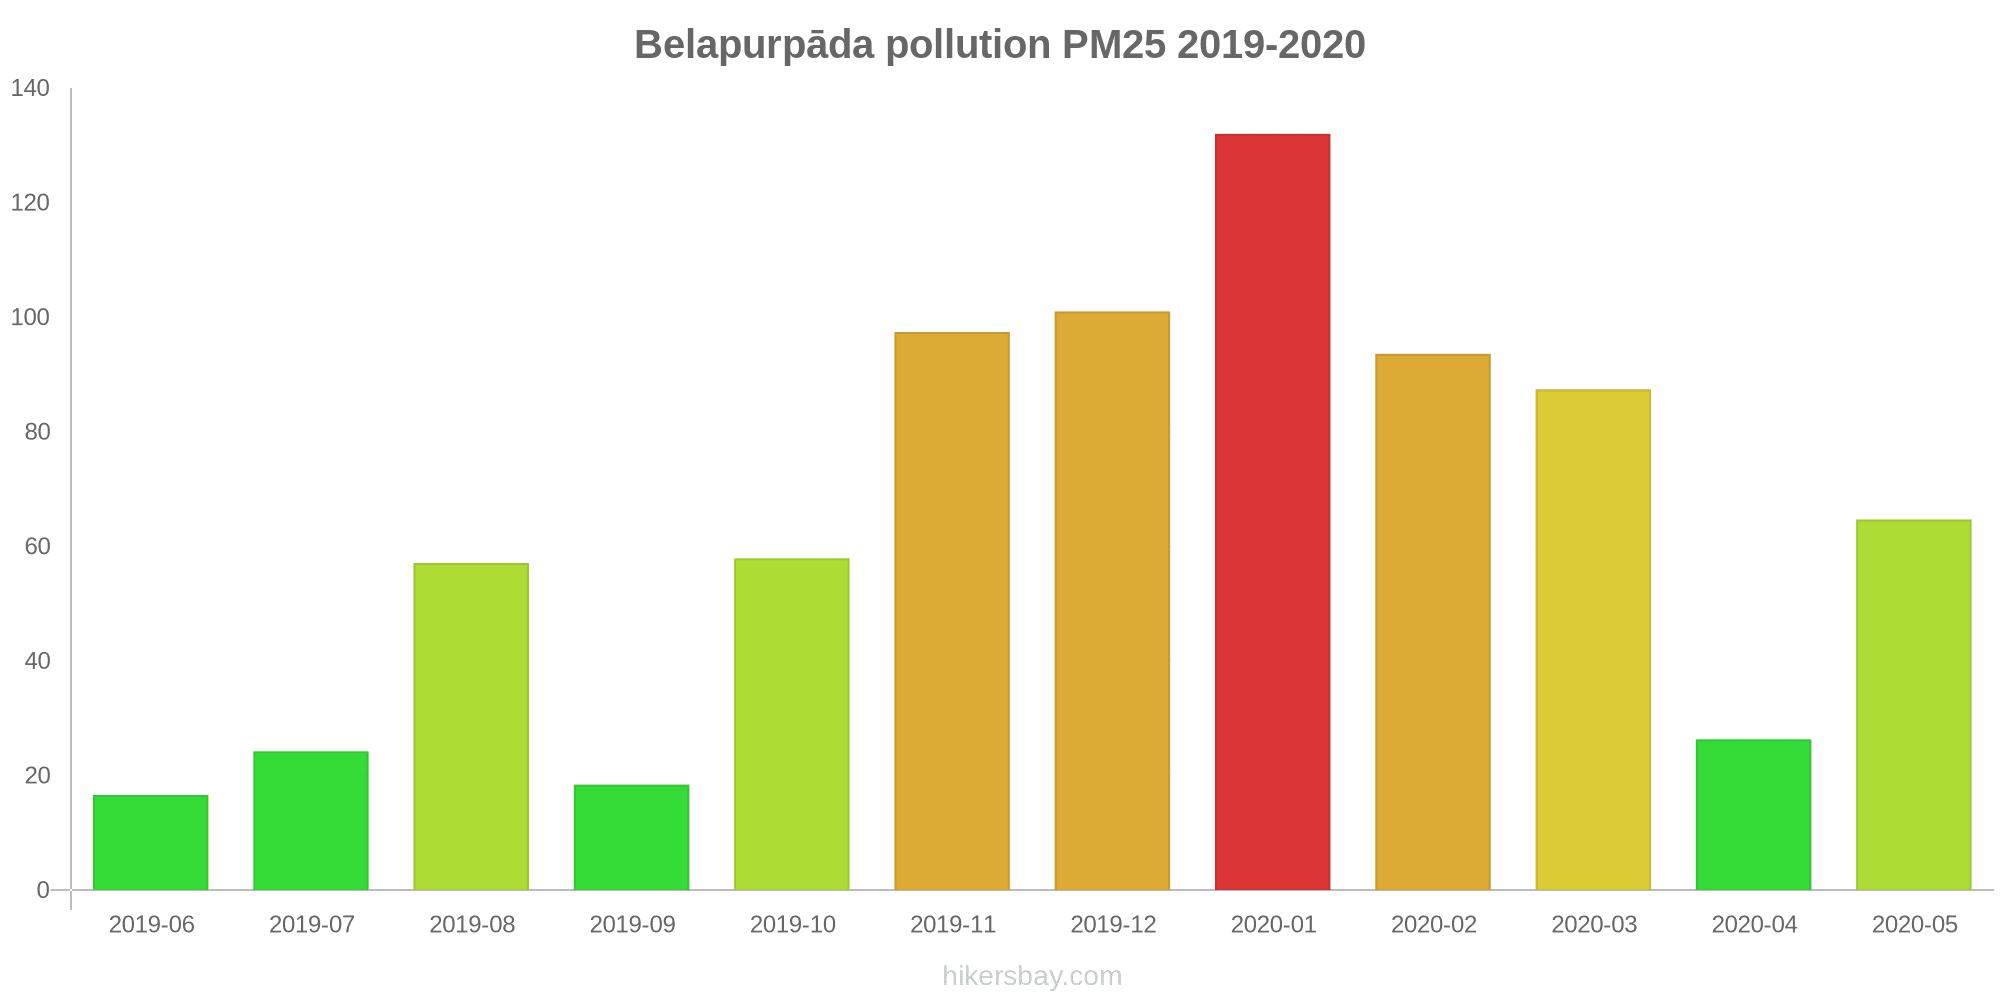
The highest PM2.5 values were recorded: 132 (January 2020).
The lowest level of particulate matter PM2.5 pollution occurs in month: June (17).
What is the level of PM10 today in Belapurpāda? (particulate matter (PM10) suspended dust)
The current level of particulate matter PM10 in Belapurpāda is:
169 (Very bad Hazardous)
The highest PM10 values usually occur in month: 238 (February 2020).
The lowest value of particulate matter PM10 pollution in Belapurpāda is usually recorded in: September (43).
How high is the level of NO2? (nitrogen dioxide (NO2))
21 (Good)
What is the level of SO2 pollution? (sulfur dioxide (SO2))
12 (Good)
How high is the CO level? (carbon monoxide (CO))
1310 (Good)
Current data Monday, October 31, 2022, 2:00 AM
PM2,5 125 (Very bad Hazardous)
PM10 169 (Very bad Hazardous)
NO2 21 (Good)
SO2 12 (Good)
CO 1310 (Good)
Data on air pollution from recent days in Belapurpāda
index
2022-10-31
pm25
125
Very bad Hazardous
pm10
169
Very bad Hazardous
no2
21
Good
so2
12
Good
co
1310
Good
data source »
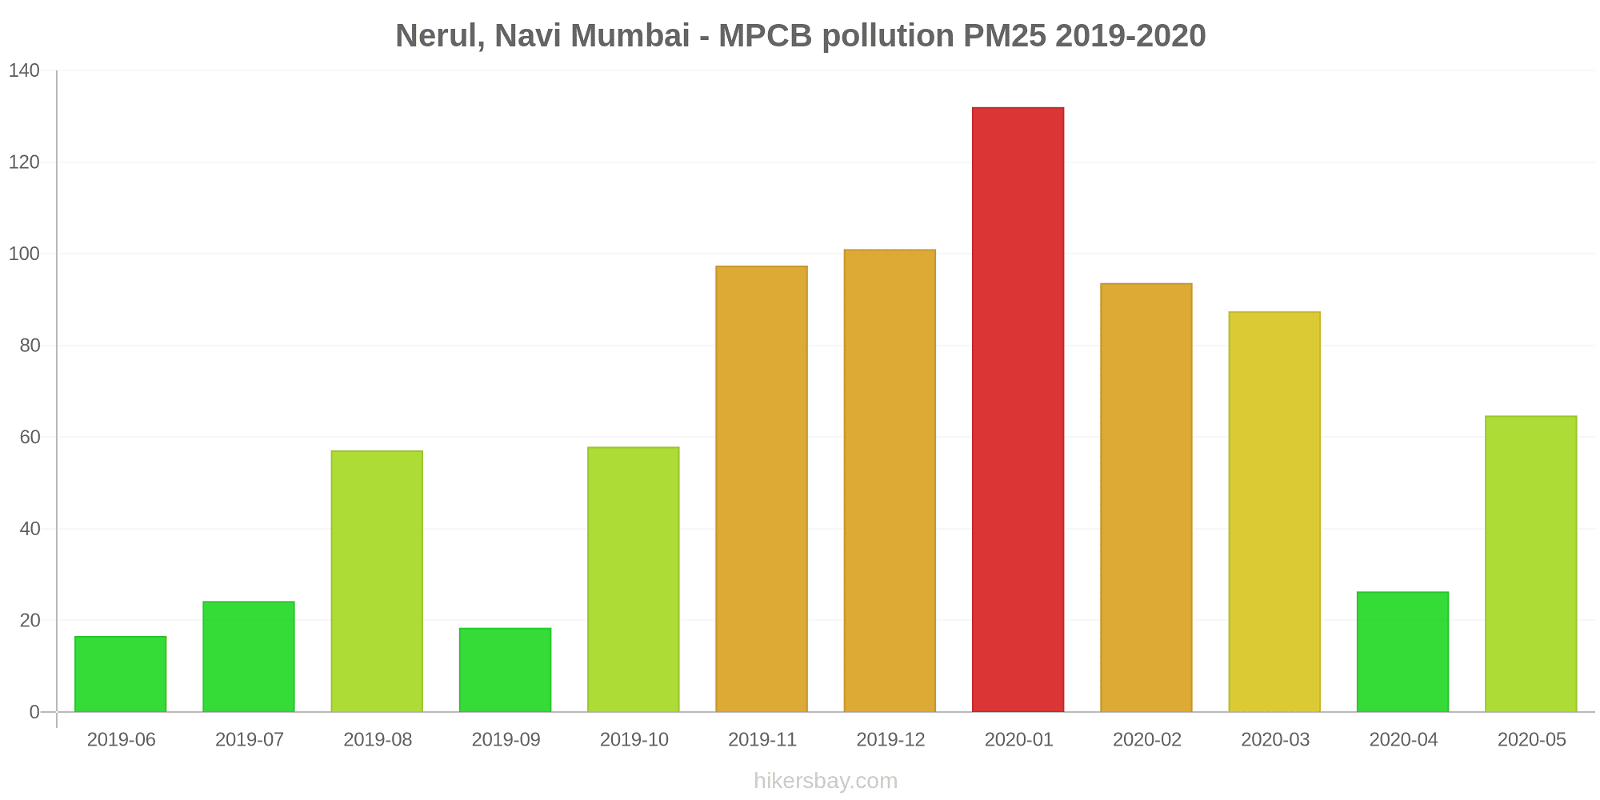
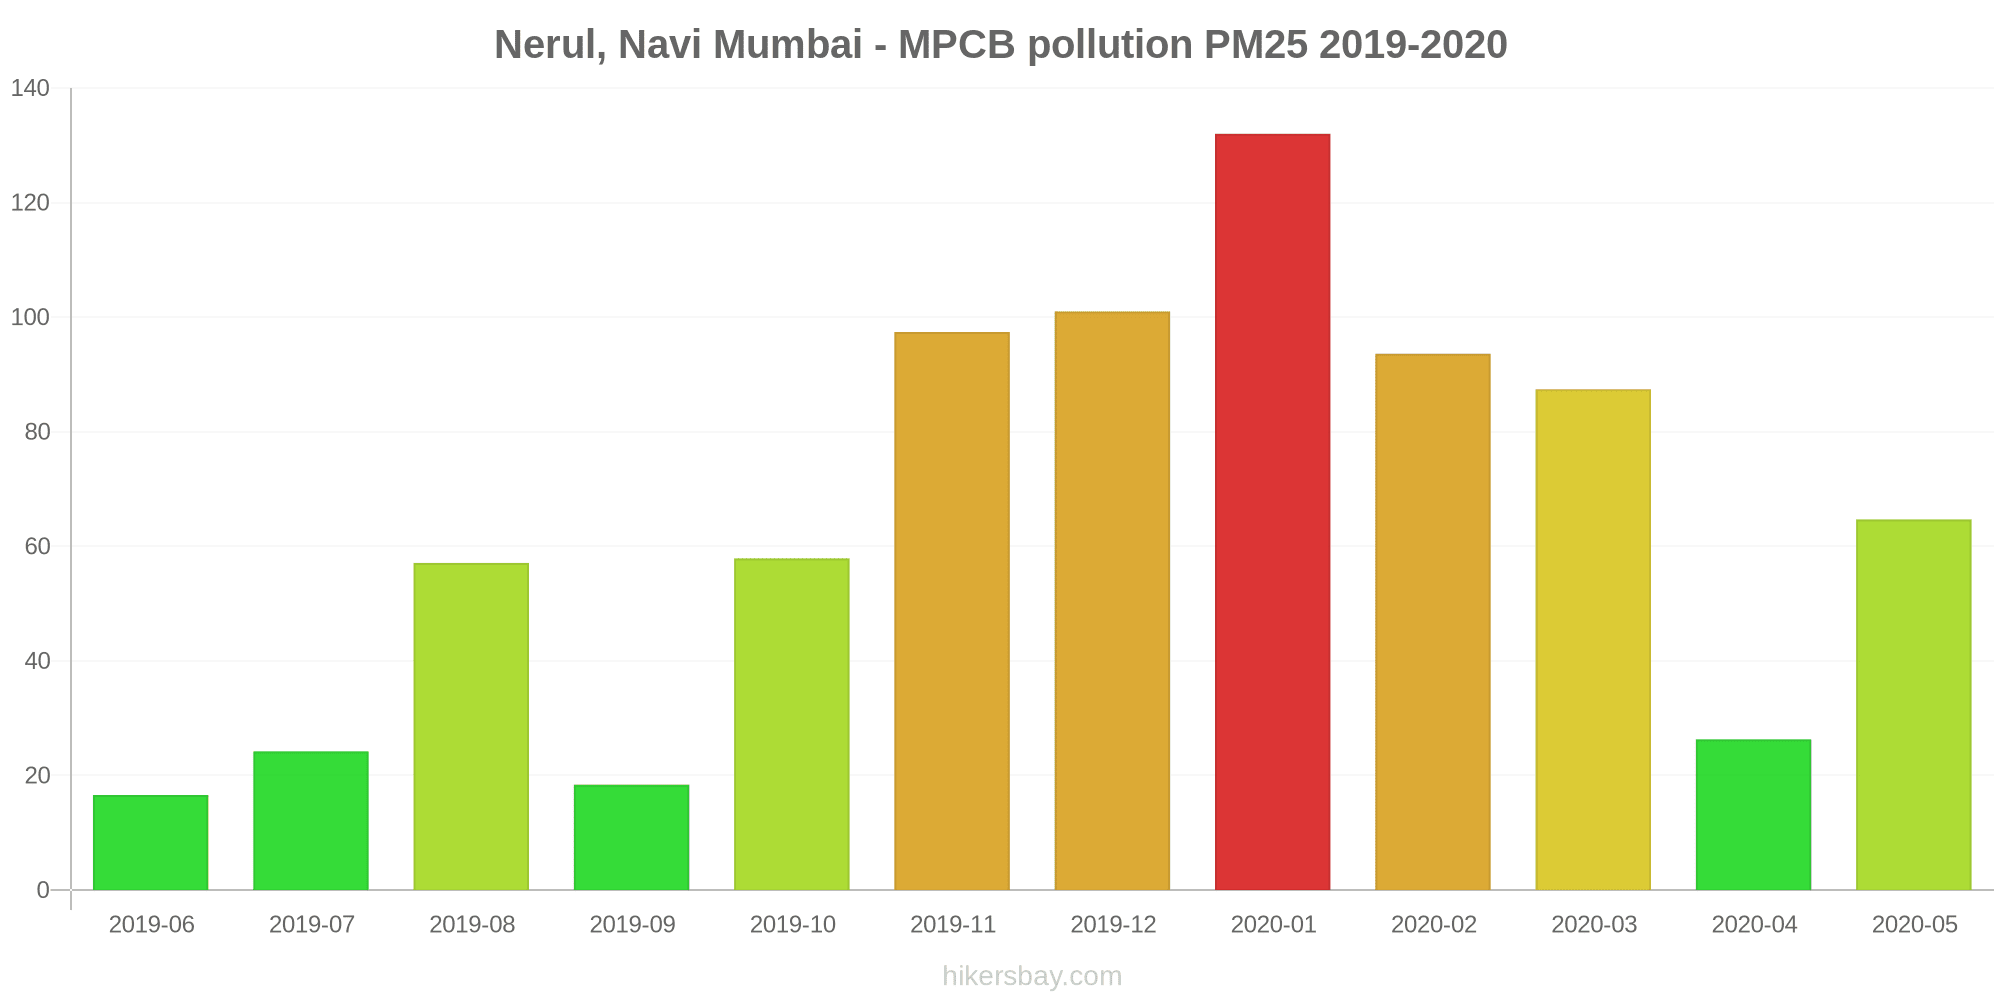
Air pollution in Belapurpāda from June 2019 to May 2020

index
2020-05
2020-04
2020-03
2020-02
2020-01
2019-12
2019-11
2019-10
2019-09
2019-08
2019-07
2019-06
pm25
65 (Unhealthy)
26 (Moderate)
87 (Very Unhealthy)
94 (Very Unhealthy)
132 (Very bad Hazardous)
101 (Very Unhealthy)
97 (Very Unhealthy)
58 (Unhealthy)
18 (Moderate)
57 (Unhealthy)
24 (Moderate)
17 (Moderate)
pm10
55 (Unhealthy for Sensitive Groups)
71 (Unhealthy for Sensitive Groups)
135 (Very Unhealthy)
238 (Very bad Hazardous)
218 (Very bad Hazardous)
181 (Very bad Hazardous)
192 (Very bad Hazardous)
106 (Unhealthy)
43 (Moderate)
79 (Unhealthy for Sensitive Groups)
50 (Unhealthy for Sensitive Groups)
222 (Very bad Hazardous)
no2
5.4 (Good)
6.9 (Good)
28 (Good)
63 (Moderate)
47 (Moderate)
44 (Moderate)
39 (Good)
17 (Good)
9 (Good)
10 (Good)
12 (Good)
9.9 (Good)
so2
12 (Good)
12 (Good)
14 (Good)
11 (Good)
6.9 (Good)
7.8 (Good)
9.4 (Good)
12 (Good)
12 (Good)
11 (Good)
11 (Good)
14 (Good)
co
1 (Good)
1 (Good)
1 (Good)
1 (Good)
1 (Good)
1 (Good)
1 (Good)
754 (Good)
342 (Good)
314 (Good)
369 (Good)
426 (Good)
o3
122 (Unhealthy for Sensitive Groups)
59 (Good)
34 (Good)
43 (Good)
9.8 (Good)
21 (Good)
22 (Good)
13 (Good)
17 (Good)
293 (Very bad Hazardous)
9.2 (Good)
4.5 (Good)
data source »
Nerul, Navi Mumbai - MPCB
Monday, October 31, 2022, 2:00 AM
PM2,5 125 (Very bad Hazardous)
particulate matter (PM2.5) dust
PM10 169 (Very bad Hazardous)
particulate matter (PM10) suspended dust
NO2 21 (Good)
nitrogen dioxide (NO2)
SO2 12 (Good)
sulfur dioxide (SO2)
CO 1310 (Good)
carbon monoxide (CO)
Nerul, Navi Mumbai - MPCB
index
2022-10-31
pm25
125
pm10
169
no2
21
so2
12
co
1310
Nerul, Navi Mumbai - MPCB
2019-06 2020-05
index
2020-05
2020-04
2020-03
2020-02
2020-01
2019-12
2019-11
2019-10
2019-09
2019-08
2019-07
2019-06
pm25
65
26
87
94
132
101
97
58
18
57
24
17
pm10
55
71
135
238
218
181
192
106
43
79
50
222
no2
5.4
6.9
28
63
47
44
39
17
9
10
12
9.9
so2
12
12
14
11
6.9
7.8
9.4
12
12
11
11
14
co
1
1
1
1
1
1
1
754
342
314
369
426
o3
122
59
34
43
9.8
21
22
13
17
293
9.2
4.5
* Pollution data source:
https://openaq.org
(caaqm)
The data is licensed under CC-By 4.0
PM2,5 125 (Very bad Hazardous)
PM10 169 (Very bad Hazardous)
NO2 21 (Good)
SO2 12 (Good)
CO 1310 (Good)
Data on air pollution from recent days in Belapurpāda
| index | 2022-10-31 |
|---|---|
| pm25 | 125 Very bad Hazardous |
| pm10 | 169 Very bad Hazardous |
| no2 | 21 Good |
| so2 | 12 Good |
| co | 1310 Good |
| index | 2020-05 | 2020-04 | 2020-03 | 2020-02 | 2020-01 | 2019-12 | 2019-11 | 2019-10 | 2019-09 | 2019-08 | 2019-07 | 2019-06 |
|---|---|---|---|---|---|---|---|---|---|---|---|---|
| pm25 | 65 (Unhealthy) | 26 (Moderate) | 87 (Very Unhealthy) | 94 (Very Unhealthy) | 132 (Very bad Hazardous) | 101 (Very Unhealthy) | 97 (Very Unhealthy) | 58 (Unhealthy) | 18 (Moderate) | 57 (Unhealthy) | 24 (Moderate) | 17 (Moderate) |
| pm10 | 55 (Unhealthy for Sensitive Groups) | 71 (Unhealthy for Sensitive Groups) | 135 (Very Unhealthy) | 238 (Very bad Hazardous) | 218 (Very bad Hazardous) | 181 (Very bad Hazardous) | 192 (Very bad Hazardous) | 106 (Unhealthy) | 43 (Moderate) | 79 (Unhealthy for Sensitive Groups) | 50 (Unhealthy for Sensitive Groups) | 222 (Very bad Hazardous) |
| no2 | 5.4 (Good) | 6.9 (Good) | 28 (Good) | 63 (Moderate) | 47 (Moderate) | 44 (Moderate) | 39 (Good) | 17 (Good) | 9 (Good) | 10 (Good) | 12 (Good) | 9.9 (Good) |
| so2 | 12 (Good) | 12 (Good) | 14 (Good) | 11 (Good) | 6.9 (Good) | 7.8 (Good) | 9.4 (Good) | 12 (Good) | 12 (Good) | 11 (Good) | 11 (Good) | 14 (Good) |
| co | 1 (Good) | 1 (Good) | 1 (Good) | 1 (Good) | 1 (Good) | 1 (Good) | 1 (Good) | 754 (Good) | 342 (Good) | 314 (Good) | 369 (Good) | 426 (Good) |
| o3 | 122 (Unhealthy for Sensitive Groups) | 59 (Good) | 34 (Good) | 43 (Good) | 9.8 (Good) | 21 (Good) | 22 (Good) | 13 (Good) | 17 (Good) | 293 (Very bad Hazardous) | 9.2 (Good) | 4.5 (Good) |
PM2,5 125 (Very bad Hazardous)
particulate matter (PM2.5) dustPM10 169 (Very bad Hazardous)
particulate matter (PM10) suspended dustNO2 21 (Good)
nitrogen dioxide (NO2)SO2 12 (Good)
sulfur dioxide (SO2)CO 1310 (Good)
carbon monoxide (CO)Nerul, Navi Mumbai - MPCB
| index | 2022-10-31 |
|---|---|
| pm25 | 125 |
| pm10 | 169 |
| no2 | 21 |
| so2 | 12 |
| co | 1310 |
Nerul, Navi Mumbai - MPCB
| index | 2020-05 | 2020-04 | 2020-03 | 2020-02 | 2020-01 | 2019-12 | 2019-11 | 2019-10 | 2019-09 | 2019-08 | 2019-07 | 2019-06 |
|---|---|---|---|---|---|---|---|---|---|---|---|---|
| pm25 | 65 | 26 | 87 | 94 | 132 | 101 | 97 | 58 | 18 | 57 | 24 | 17 |
| pm10 | 55 | 71 | 135 | 238 | 218 | 181 | 192 | 106 | 43 | 79 | 50 | 222 |
| no2 | 5.4 | 6.9 | 28 | 63 | 47 | 44 | 39 | 17 | 9 | 10 | 12 | 9.9 |
| so2 | 12 | 12 | 14 | 11 | 6.9 | 7.8 | 9.4 | 12 | 12 | 11 | 11 | 14 |
| co | 1 | 1 | 1 | 1 | 1 | 1 | 1 | 754 | 342 | 314 | 369 | 426 |
| o3 | 122 | 59 | 34 | 43 | 9.8 | 21 | 22 | 13 | 17 | 293 | 9.2 | 4.5 |