Air Pollution in Bhāndup: Real-time Air Quality Index and smog alert.
Pollution and air quality forecast for Bhāndup. Today is Wednesday, May 13, 2026. The following air pollution values have been recorded for Bhāndup:- particulate matter (PM2.5) dust - 38 (Unhealthy for Sensitive Groups)
- ozone (O3) - 4 (Good)
- carbon monoxide (CO) - 1700 (Good)
- particulate matter (PM10) suspended dust - 69 (Unhealthy for Sensitive Groups)
- sulfur dioxide (SO2) - 22 (Good)
- nitrogen dioxide (NO2) - 28 (Good)

What is the air quality in Bhāndup today? Is the air polluted in Bhāndup?. Is there smog?
What is the current level of PM2.5 in Bhāndup? (particulate matter (PM2.5) dust)
Today's PM2.5 level is:
38 (Unhealthy for Sensitive Groups)
For comparison, the highest level of PM2.5 in Bhāndup in the last 7 days was: 36 (Thursday, October 13, 2022) and the lowest: 10 (Friday, October 7, 2022).
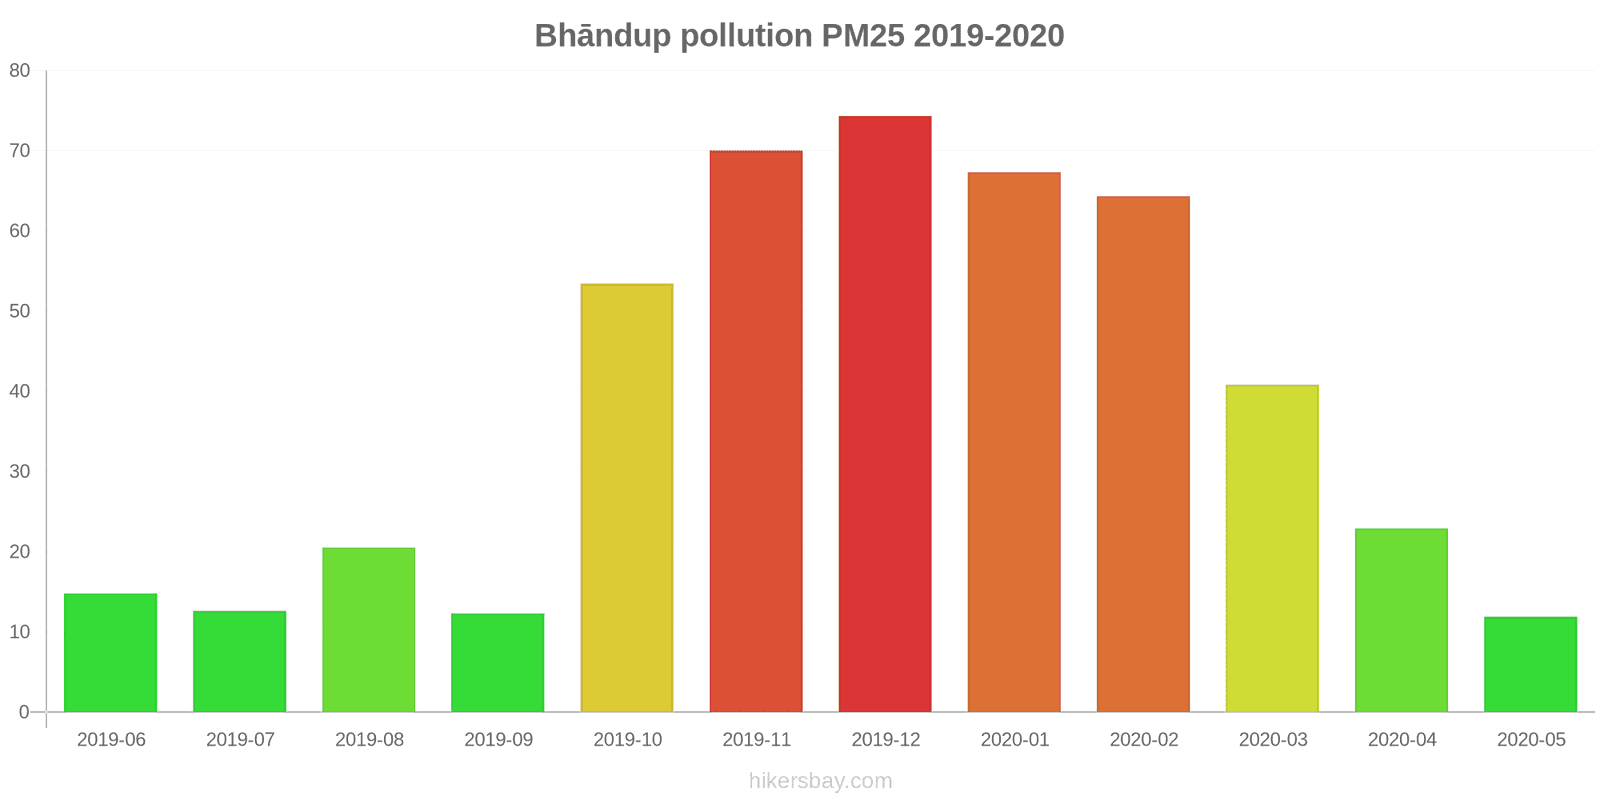
The highest PM2.5 values were recorded: 74 (December 2019).
The lowest level of particulate matter PM2.5 pollution occurs in month: May (12).
How is the O3 level today in Bhāndup? (ozone (O3))
4 (Good)
How high is the CO level? (carbon monoxide (CO))
1700 (Good)
What is the level of PM10 today in Bhāndup? (particulate matter (PM10) suspended dust)
The current level of particulate matter PM10 in Bhāndup is:
69 (Unhealthy for Sensitive Groups)
The highest PM10 values usually occur in month: 241 (May 2020).
The lowest value of particulate matter PM10 pollution in Bhāndup is usually recorded in: September (34).
What is the level of SO2 pollution? (sulfur dioxide (SO2))
22 (Good)
How high is the level of NO2? (nitrogen dioxide (NO2))
28 (Good)
Current data Friday, October 14, 2022, 6:00 AM
PM2,5 38 (Unhealthy for Sensitive Groups)
O3 4 (Good)
CO 1700 (Good)
PM10 69 (Unhealthy for Sensitive Groups)
SO2 22 (Good)
NO2 28 (Good)
Data on air pollution from recent days in Bhāndup
index
2022-10-07
2022-10-08
2022-10-09
2022-10-10
2022-10-11
2022-10-12
2022-10-13
2022-10-14
co
205
Good
1295
Good
1282
Good
1449
Good
1306
Good
1620
Good
1711
Good
1512
Good
no2
22
Good
26
Good
20
Good
20
Good
21
Good
10
Good
24
Good
16
Good
so2
3
Good
21
Good
21
Good
21
Good
21
Good
23
Good
22
Good
22
Good
pm10
23
Moderate
28
Moderate
35
Moderate
51
Unhealthy for Sensitive Groups
52
Unhealthy for Sensitive Groups
49
Moderate
61
Unhealthy for Sensitive Groups
50
Unhealthy for Sensitive Groups
o3
11
Good
5
Good
5
Good
7
Good
5
Good
2
Good
4
Good
2
Good
pm25
10
Good
15
Moderate
12
Good
24
Moderate
25
Moderate
28
Moderate
36
Unhealthy for Sensitive Groups
35
Unhealthy for Sensitive Groups
data source »
Air pollution in Bhāndup from June 2019 to May 2020
index
2020-05
2020-04
2020-03
2020-02
2020-01
2019-12
2019-11
2019-10
2019-09
2019-08
2019-07
2019-06
pm25
12 (Good)
23 (Moderate)
41 (Unhealthy for Sensitive Groups)
64 (Unhealthy)
67 (Unhealthy)
74 (Unhealthy)
70 (Unhealthy)
53 (Unhealthy for Sensitive Groups)
12 (Good)
21 (Moderate)
13 (Good)
15 (Moderate)
pm10
241 (Very bad Hazardous)
69 (Unhealthy for Sensitive Groups)
96 (Unhealthy)
128 (Very Unhealthy)
116 (Very Unhealthy)
120 (Very Unhealthy)
111 (Very Unhealthy)
87 (Unhealthy)
34 (Moderate)
81 (Unhealthy)
42 (Moderate)
45 (Moderate)
no2
1.8 (Good)
3 (Good)
8.8 (Good)
23 (Good)
21 (Good)
18 (Good)
14 (Good)
12 (Good)
3.8 (Good)
4 (Good)
9.3 (Good)
10 (Good)
so2
25 (Good)
3.8 (Good)
3.6 (Good)
9.6 (Good)
6.5 (Good)
7.9 (Good)
11 (Good)
6.7 (Good)
7 (Good)
4.4 (Good)
8 (Good)
20 (Good)
co
213 (Good)
1 (Good)
851 (Good)
1 (Good)
833 (Good)
1 (Good)
1 (Good)
2 (Good)
680 (Good)
307 (Good)
363 (Good)
402 (Good)
o3
21 (Good)
21 (Good)
26 (Good)
55 (Good)
60 (Good)
47 (Good)
25 (Good)
19 (Good)
17 (Good)
13 (Good)
9.9 (Good)
6 (Good)
data source »
Powai, Mumbai - MPCB
Friday, October 14, 2022, 6:00 AM
PM2,5 38 (Unhealthy for Sensitive Groups)
particulate matter (PM2.5) dust
O3 4 (Good)
ozone (O3)
CO 1700 (Good)
carbon monoxide (CO)
PM10 69 (Unhealthy for Sensitive Groups)
particulate matter (PM10) suspended dust
SO2 22 (Good)
sulfur dioxide (SO2)
NO2 28 (Good)
nitrogen dioxide (NO2)
Powai, Mumbai - MPCB
index
2022-10-14
2022-10-13
2022-10-12
2022-10-11
2022-10-10
2022-10-09
2022-10-08
2022-10-07
co
1512
1711
1620
1306
1449
1282
1295
205
no2
16
24
9.9
21
20
20
26
22
so2
22
22
23
21
21
21
21
2.6
pm10
50
61
49
52
51
35
28
23
o3
1.7
4.5
1.7
4.6
6.9
4.9
4.6
11
pm25
35
36
28
25
24
12
15
9.8
Powai, Mumbai - MPCB
2019-06 2020-05

index
2020-05
2020-04
2020-03
2020-02
2020-01
2019-12
2019-11
2019-10
2019-09
2019-08
2019-07
2019-06
pm25
12
23
41
64
67
74
70
53
12
21
13
15
pm10
241
69
96
128
116
120
111
87
34
81
42
45
no2
1.8
3
8.8
23
21
18
14
12
3.8
4
9.3
10
so2
25
3.8
3.6
9.6
6.5
7.9
11
6.7
7
4.4
8
20
co
213
1
851
1
833
1
1
2
680
307
363
402
o3
21
21
26
55
60
47
25
19
17
13
9.9
6
* Pollution data source:
https://openaq.org
(caaqm)
The data is licensed under CC-By 4.0
PM2,5 38 (Unhealthy for Sensitive Groups)
O3 4 (Good)
CO 1700 (Good)
PM10 69 (Unhealthy for Sensitive Groups)
SO2 22 (Good)
NO2 28 (Good)
Data on air pollution from recent days in Bhāndup
| index | 2022-10-07 | 2022-10-08 | 2022-10-09 | 2022-10-10 | 2022-10-11 | 2022-10-12 | 2022-10-13 | 2022-10-14 |
|---|---|---|---|---|---|---|---|---|
| co | 205 Good |
1295 Good |
1282 Good |
1449 Good |
1306 Good |
1620 Good |
1711 Good |
1512 Good |
| no2 | 22 Good |
26 Good |
20 Good |
20 Good |
21 Good |
10 Good |
24 Good |
16 Good |
| so2 | 3 Good |
21 Good |
21 Good |
21 Good |
21 Good |
23 Good |
22 Good |
22 Good |
| pm10 | 23 Moderate |
28 Moderate |
35 Moderate |
51 Unhealthy for Sensitive Groups |
52 Unhealthy for Sensitive Groups |
49 Moderate |
61 Unhealthy for Sensitive Groups |
50 Unhealthy for Sensitive Groups |
| o3 | 11 Good |
5 Good |
5 Good |
7 Good |
5 Good |
2 Good |
4 Good |
2 Good |
| pm25 | 10 Good |
15 Moderate |
12 Good |
24 Moderate |
25 Moderate |
28 Moderate |
36 Unhealthy for Sensitive Groups |
35 Unhealthy for Sensitive Groups |

| index | 2020-05 | 2020-04 | 2020-03 | 2020-02 | 2020-01 | 2019-12 | 2019-11 | 2019-10 | 2019-09 | 2019-08 | 2019-07 | 2019-06 |
|---|---|---|---|---|---|---|---|---|---|---|---|---|
| pm25 | 12 (Good) | 23 (Moderate) | 41 (Unhealthy for Sensitive Groups) | 64 (Unhealthy) | 67 (Unhealthy) | 74 (Unhealthy) | 70 (Unhealthy) | 53 (Unhealthy for Sensitive Groups) | 12 (Good) | 21 (Moderate) | 13 (Good) | 15 (Moderate) |
| pm10 | 241 (Very bad Hazardous) | 69 (Unhealthy for Sensitive Groups) | 96 (Unhealthy) | 128 (Very Unhealthy) | 116 (Very Unhealthy) | 120 (Very Unhealthy) | 111 (Very Unhealthy) | 87 (Unhealthy) | 34 (Moderate) | 81 (Unhealthy) | 42 (Moderate) | 45 (Moderate) |
| no2 | 1.8 (Good) | 3 (Good) | 8.8 (Good) | 23 (Good) | 21 (Good) | 18 (Good) | 14 (Good) | 12 (Good) | 3.8 (Good) | 4 (Good) | 9.3 (Good) | 10 (Good) |
| so2 | 25 (Good) | 3.8 (Good) | 3.6 (Good) | 9.6 (Good) | 6.5 (Good) | 7.9 (Good) | 11 (Good) | 6.7 (Good) | 7 (Good) | 4.4 (Good) | 8 (Good) | 20 (Good) |
| co | 213 (Good) | 1 (Good) | 851 (Good) | 1 (Good) | 833 (Good) | 1 (Good) | 1 (Good) | 2 (Good) | 680 (Good) | 307 (Good) | 363 (Good) | 402 (Good) |
| o3 | 21 (Good) | 21 (Good) | 26 (Good) | 55 (Good) | 60 (Good) | 47 (Good) | 25 (Good) | 19 (Good) | 17 (Good) | 13 (Good) | 9.9 (Good) | 6 (Good) |
PM2,5 38 (Unhealthy for Sensitive Groups)
particulate matter (PM2.5) dustO3 4 (Good)
ozone (O3)CO 1700 (Good)
carbon monoxide (CO)PM10 69 (Unhealthy for Sensitive Groups)
particulate matter (PM10) suspended dustSO2 22 (Good)
sulfur dioxide (SO2)NO2 28 (Good)
nitrogen dioxide (NO2)Powai, Mumbai - MPCB
| index | 2022-10-14 | 2022-10-13 | 2022-10-12 | 2022-10-11 | 2022-10-10 | 2022-10-09 | 2022-10-08 | 2022-10-07 |
|---|---|---|---|---|---|---|---|---|
| co | 1512 | 1711 | 1620 | 1306 | 1449 | 1282 | 1295 | 205 |
| no2 | 16 | 24 | 9.9 | 21 | 20 | 20 | 26 | 22 |
| so2 | 22 | 22 | 23 | 21 | 21 | 21 | 21 | 2.6 |
| pm10 | 50 | 61 | 49 | 52 | 51 | 35 | 28 | 23 |
| o3 | 1.7 | 4.5 | 1.7 | 4.6 | 6.9 | 4.9 | 4.6 | 11 |
| pm25 | 35 | 36 | 28 | 25 | 24 | 12 | 15 | 9.8 |
Powai, Mumbai - MPCB

| index | 2020-05 | 2020-04 | 2020-03 | 2020-02 | 2020-01 | 2019-12 | 2019-11 | 2019-10 | 2019-09 | 2019-08 | 2019-07 | 2019-06 |
|---|---|---|---|---|---|---|---|---|---|---|---|---|
| pm25 | 12 | 23 | 41 | 64 | 67 | 74 | 70 | 53 | 12 | 21 | 13 | 15 |
| pm10 | 241 | 69 | 96 | 128 | 116 | 120 | 111 | 87 | 34 | 81 | 42 | 45 |
| no2 | 1.8 | 3 | 8.8 | 23 | 21 | 18 | 14 | 12 | 3.8 | 4 | 9.3 | 10 |
| so2 | 25 | 3.8 | 3.6 | 9.6 | 6.5 | 7.9 | 11 | 6.7 | 7 | 4.4 | 8 | 20 |
| co | 213 | 1 | 851 | 1 | 833 | 1 | 1 | 2 | 680 | 307 | 363 | 402 |
| o3 | 21 | 21 | 26 | 55 | 60 | 47 | 25 | 19 | 17 | 13 | 9.9 | 6 |